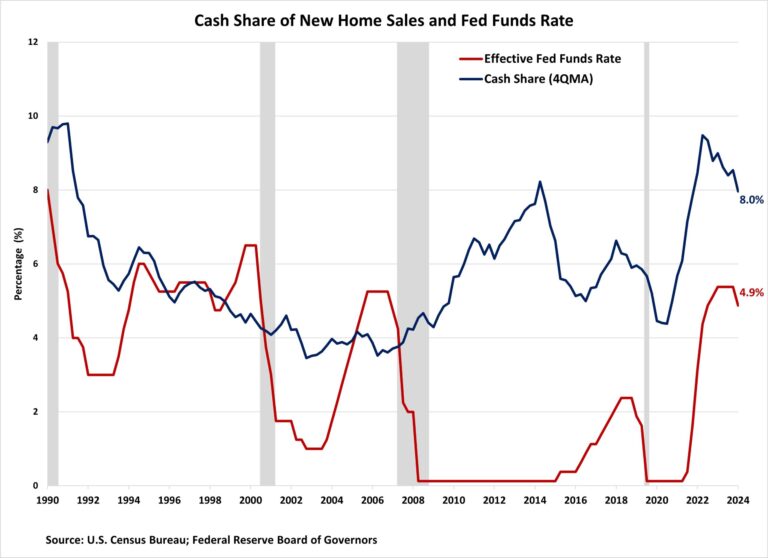
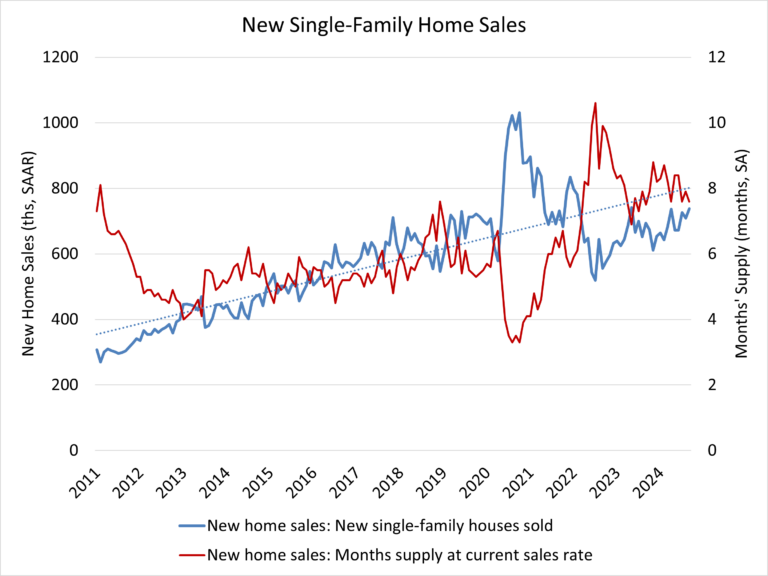
All-cash purchases accounted for 7.9% of new home sales in the third quarter of 2024, marking the highest level this year but lowest level for the third quarter since 2022, according to NAHB analysis of the latest Census Quarterly Sales by Price and Financing report. Among mortgaged home sales, FHA-backed and VA-backed sales fell while conventional sales increased. This is in line with the overall trend observed in mortgage activity, as mortgage demand grew with moderating rates during this period. Despite the decline in total sales, the median purchase price of new homes (across all financing types) continued to increase in the third quarter.
Since the Federal Reserve began raising interest rates in early 2022, the share of all-cash new home sales has increased significantly, with an average of 8.7% amid this tightening cycle. The interest rate hikes have caused the average mortgage rate to more than double, surging from 3.1% in the fourth quarter of 2021 to 7.0% by the end of second quarter of 2024. The chart below illustrates how much more sensitive the all-cash share has become to changes in the federal funds rate since 2017. However, after peaking at 10.7% in the fourth quarter of 2022, the all-cash share has recently trended lower.
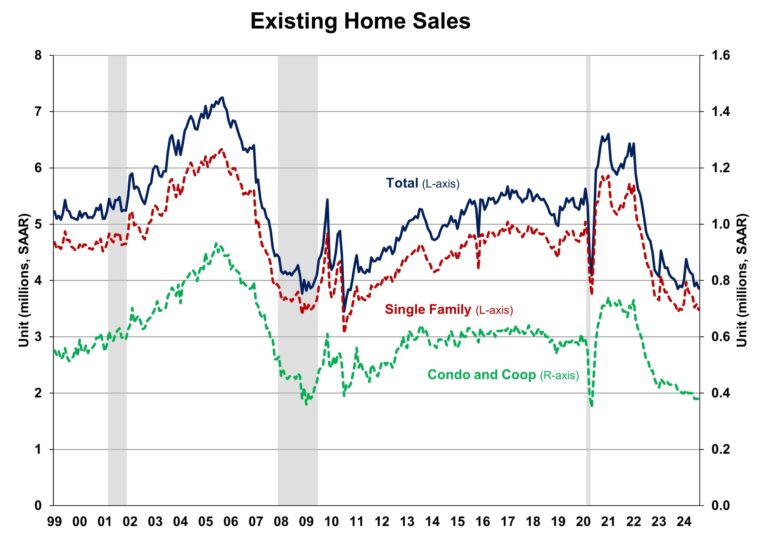
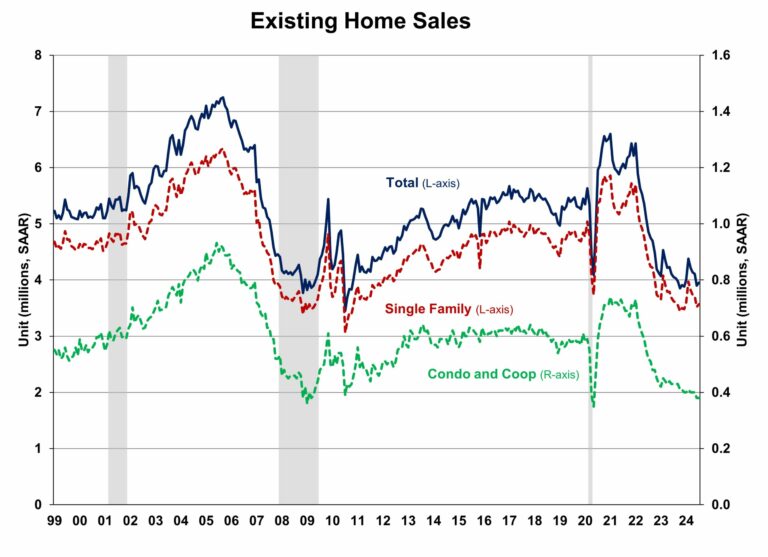
Although cash sales make up a relatively small portion of new home sales, they constitute a larger share of existing home sales. This share also increased significantly since the Fed began raising interest rates in early 2022. According to estimates from the National Association of Realtors, 30% of existing home transactions were all-cash sales in September 2024, up from 26% in August and 29% a year ago.
The share of FHA-backed sales fell from 13.0% to 11.9% in the third quarter of 2024, reaching the lowest level since the fourth quarter of 2022. This share remains below the post-Great Recession average of 17.0%. Meanwhile, the share of VA-backed sales also decreased, falling from 5.4% to 5.1%. Among declines in other types of new home financing, the share of conventional loans financed sales saw an increase in the third quarter of 2024, climbing from 73.9% to 75.1%, the highest level since the fourth quarter of 2022.
Price by Type of Financing
Different sources of financing also serve distinct market segments, which is revealed in part by the median new home price associated with each. In the third quarter, the national median sales price of a new home was $420,400. Split by types of financing, the median prices of new homes financed with conventional loans, FHA loans, VA loans, and cash were $466,100, $352,100, $404,000, and $401,600, respectively.
The purchase price of new homes financed with conventional and cash declined over the past year, while the price of homes financed with FHA loans and VA loans increased. The largest decline occurred in cash sales prices, which fell 21.1% over the year. This is in stark contrast to year-over-year price changes in the third quarter of 2022 and 2023, when median sales price rose 16.9% and 18.2% (see below).
Discover more from Eye On Housing
Subscribe to get the latest posts sent to your email.
This article was originally published by a eyeonhousing.org . Read the Original article here. .
