Tag

Sales

Browsing


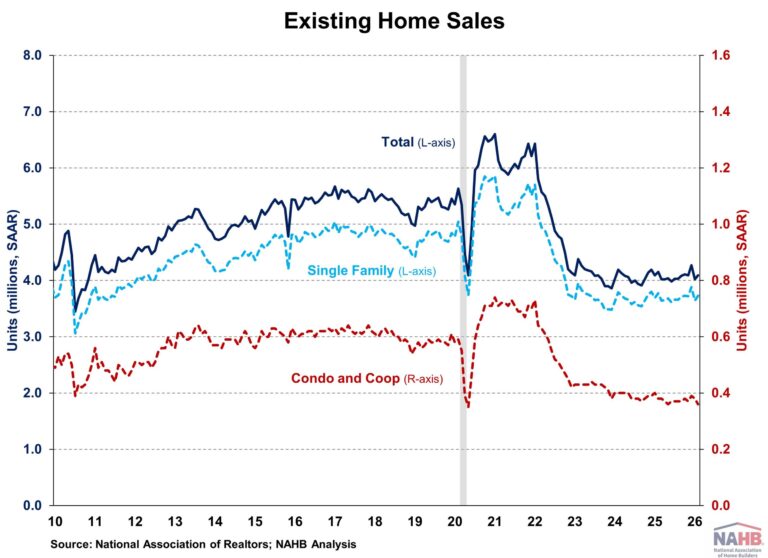
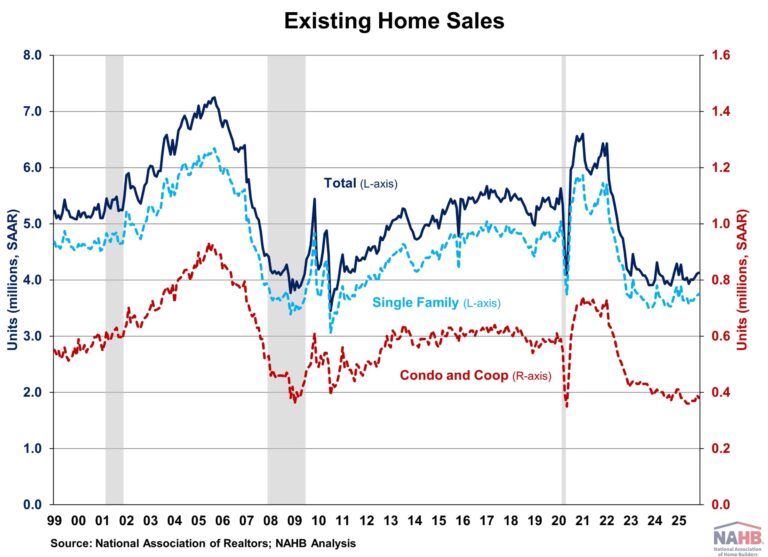
Existing home sales fell in January to a more than two-year low after December’s strong rebound, as tight inventory continued to push home prices higher and winter storms weighed on activity. Despite mortgage rates trending lower and wage growth outpacing price gains, limited resale supply kept many buyers on the sidelines. Resale inventory remained at lowest level since January 2025. Though home price appreciation has slowed in recent months, affordability remains a challenge.

Total existing home sales, including single-family homes, townhomes, condominiums, and co-ops, fell 8.4% to a seasonally adjusted annual rate of 3.91 million in January, according to the National Association of Realtors (NAR). This marks the lowest level since August 2024. On a year-over-year basis, sales were 4.4% lower than a year ago.

The existing home inventory level was 1.2 million units in January, down 0.8% from December but up 3.4% from a year ago. At the current sales rate, January unsold inventory sits at a 3.7-months’ supply, up from 3.5-months in December and January 2024. Inventory between 4.5 to 6 months’ supply is generally considered a balanced market.

Homes stayed on the market for a median of 46 days in January, up from 39 days in the previous month and 41 days in January 2025.

The first-time buyer share was 31% in January, up from 29% in December and 28% from a year ago.

The January all-cash sales share was 27% of transactions, down from 28% in December and 29% a year ago. All-cash buyers are less affected by changes in interest rates.

The January median sales price of all existing homes was $396,800, up 0.9% from last year. This marks the new high for the month of January and the 31st consecutive month of year-over-year increases. The median condominium/co-op price in January was up 3.8% from a year ago at $364,600. Recent gains for home inventory will put downward pressure on resale home prices in most markets in 2026.

Sales declined in all four major regions in January, ranging from 5.9% in the Northeast to 10.3% in the West. On a year-over-year basis, sales also fell across all regions, from 1.6% in the South to 7.9% in the West.

The Pending Home Sales Index (PHSI) is a forward-looking indicator based on signed contracts. The PHSI fell from 79.2 to 71.8 in December after four months of increases. On a year-over-year basis, pending sales were 3.0% lower than a year ago, according to the National Association of Realtors’ data. The decline suggests buyers are holding back due to limited inventory choices.


This article was originally published by a eyeonhousing.org . Read the Original article here. .


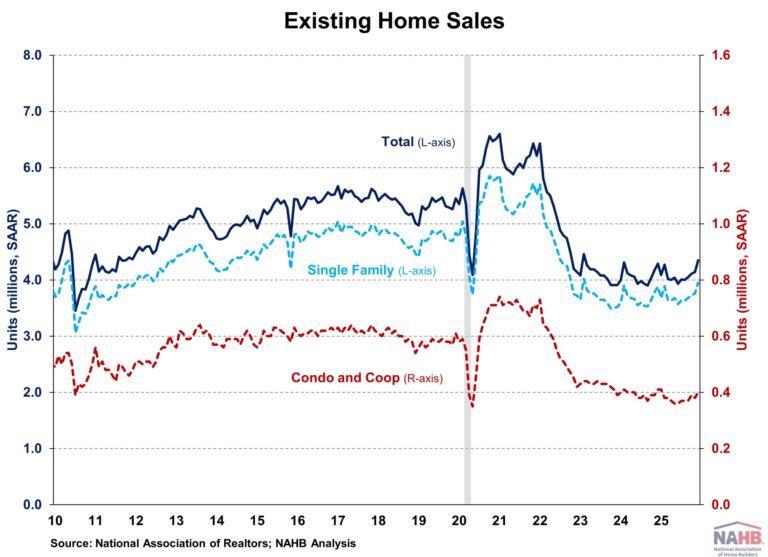
Existing home sales rose in December to the fastest pace in nearly three years, but annual sales for 2025 remained at a 30-year low as elevated home prices and mortgage rates kept buyers on the sidelines, according to the National Association of Realtors (NAR). While mortgage rates have eased from 7% seen at the start of 2025 to near 6% by year-end, tight inventory continued to push home prices higher as more homeowners took listings off the market. Resale inventory dropped to its lowest level since January 2025. Though home price appreciation has been slowed in recent months, housing affordability remains a challenge.

Total existing home sales, including single-family homes, townhomes, condominiums, and co-ops, rose 5.1% to a seasonally adjusted annual rate of 4.35 million in December, the highest level for 2025 and highest since February 2023. On a year-over-year basis, sales were 1.4% higher than a year ago. For the year 2025, existing home sales totaled 4.06 million, unchanged from 2024 and matching the lowest level since 1995.

The existing home inventory level was 1.18 million units in December, down 18.1% from November but up 3.5% from a year ago. At the current sales rate, December unsold inventory sits at a 3.3-months’ supply, down from 4.2-months in November but up from 3.2-months in December 2024. Inventory between 4.5 to 6 months’ supply is generally considered a balanced market.

The December median sales price of all existing homes was $405,400, up 0.4% from last year. This marks the 30th consecutive month of year-over-year increases. The median condominium/co-op price in December was up 1.5% from a year ago at $364,400.  Recent gains for home inventory will put downward pressure on resale home prices in most markets in 2026. All four major regions saw an increase in sales in December, with gains ranging from 2.0% in the Northeast and Midwest to 6.9% in the South. However, sales were mixed on a year-over-year basis. Sales remained unchanged in the Midwest and West, rose 3.6% in the South, and fell 1.9% in the Northeast.

The Pending Home Sales Index (PHSI) is a forward-looking indicator based on signed contracts. The PHSI rose from 76.7 to 79.2 in November due to lower mortgage rates. On a year-over-year basis, pending sales were 2.6% higher than a year ago, according to the National Association of Realtors’ data.


This article was originally published by a eyeonhousing.org . Read the Original article here. .

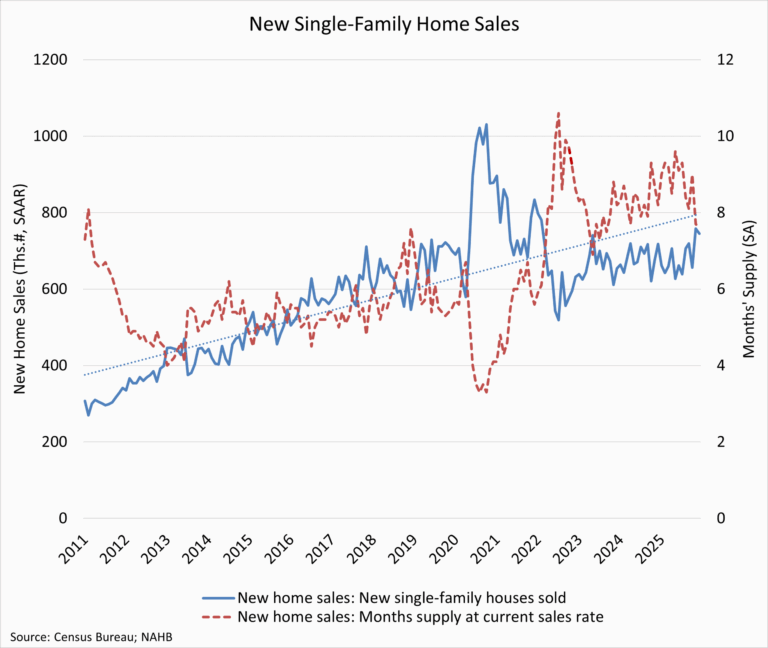
The new home sector has played an increasingly important role in meeting housing demand as resale inventory remains constrained in many regions. The latest data released today (and delayed because of the government shutdown in fall of 2025) indicate that new single-family home sales continue to reflect a stabilizing market after a period of heightened volatility. While month-to-month activity shows some variability, sales remain stronger than a year ago, signaling that buyer interest in newly built homes has improved.

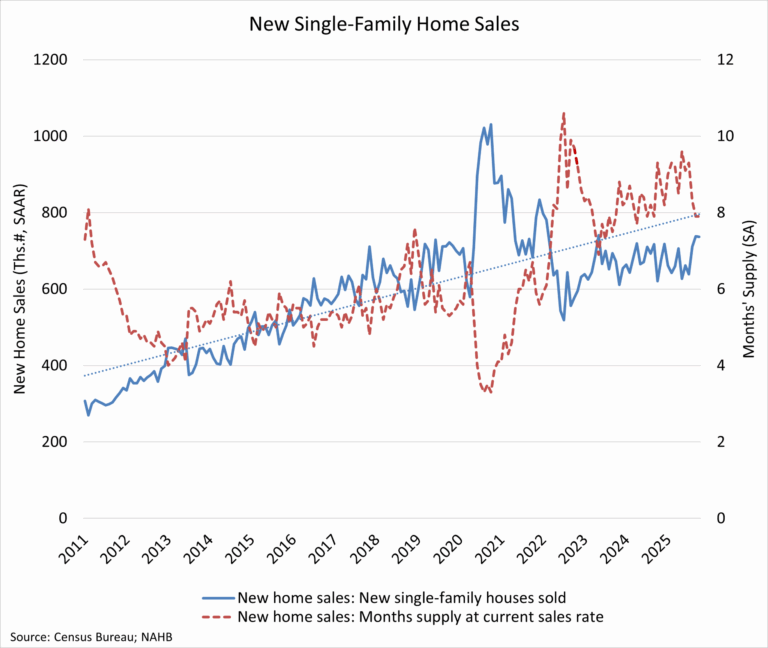
Sales of newly built single-family homes increased 18.7 percent year over year in October to a seasonally adjusted annual rate of 737,000 units, according to the U.S. Department of Housing and Urban Development and the U.S. Census Bureau. This represented a modest 0.1 percent decline from September and a 1.2 percent decrease on a year-to-date basis. A new home sale is recorded when a contract is signed or a deposit is accepted, regardless of the stage of construction. The seasonally adjusted annual rate reflects the pace of sales that would occur over a 12-month period if current conditions persisted.

New single-family home inventory totaled 488,000 units in October, unchanged from the prior month and 1.7 percent higher than a year earlier. At the current sales pace, the months’ supply of new homes stood at 7.9, down from 9.3 months one year ago, though still above the six-month level that is generally considered balanced.

Combined new and existing home inventory has edged lower in recent months, with total months’ supply declining to 4.9, reflecting slower construction activity. Meanwhile, inventory conditions in the existing home market have shown gradual improvement, and moderating prices across both markets have helped support buyer demand amid ongoing affordability concerns.

By the end of October 2025, there were 124,000 completed, ready-to-occupy homes available for sale on a not seasonally adjusted basis, up 10.7 percent from a year earlier. Completed homes accounted for roughly one-quarter of total inventory, while homes under construction made up 51 percent. The remaining 24 percent of homes sold in October had not yet started construction at the time the sales contract was signed.

Home prices showed further signs of easing in October. The median new home sale price declined 3.3 percent to $392,300, marking an 8.0 percent decrease from a year ago. Affordability improved at the lower end of the market, with 25 percent of new homes priced below $300,000, the highest share in recent months. Thirty percent of homes were priced above $500,000, while the remaining 45 percent fell within the $300,000 to $500,000 range.

Regionally, year-to-date new home sales declined in three of the four regions, falling 0.1 percent in the Midwest, 7.2 percent in the West, and 22.9 percent in the Northeast. The South was the only region to post growth, with sales up 2.9 percent.


This article was originally published by a eyeonhousing.org . Read the Original article here. .

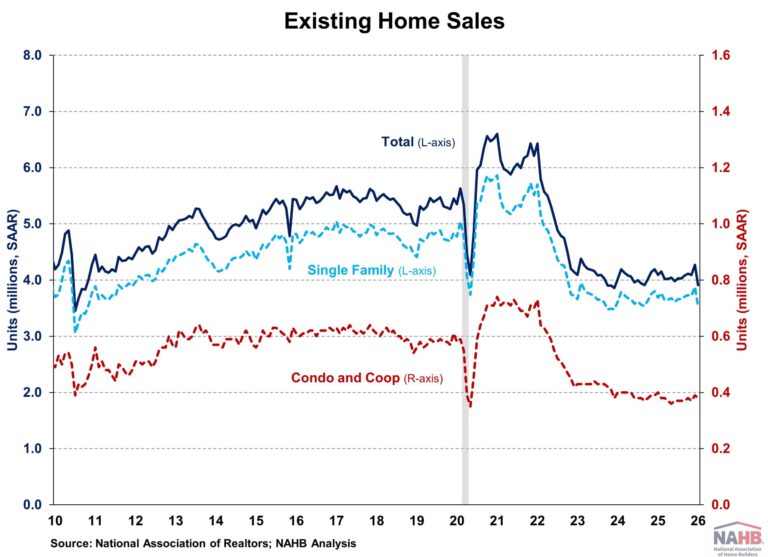
Existing home sales rose for the third consecutive month in November as lower mortgage rates continued to boost home sales, according to the National Association of Realtors (NAR). However, the increase remained modest as mortgage rates still stayed above 6% while down from recent highs. The weakening job market also weighed on buyer activity.

Meanwhile, inventory fell for the fourth consecutive month as homeowners with record-high housing wealth held back from listing properties. Relatively tight supply continued to push home prices higher and challenge housing affordability, even as wage growth outpaced home price gains.

Total existing home sales, including single-family homes, townhomes, condominiums, and co-ops, rose 0.5% to a seasonally adjusted annual rate of 4.13 million in November, the highest level since February. However, on a year-over-year basis, sales were 1.0% lower than a year ago.

The existing home inventory level was 1.43 million units in November, down 5.9% from October but up 7.5% from a year ago. At the current sales rate, November unsold inventory sits at a 4.2-months’ supply, down from 4.4-months in October but up from 3.8-months in November 2024. Inventory between 4.5 to 6 months’ supply is generally considered a balanced market.

Homes stayed on the market for a median of 36 days in November, up from 34 days last month and 32 days in November 2024.

The first-time buyer share was 30% in November, down from 32% in October but unchanged from a year ago.

The November all-cash sales share was 27% of transactions, down from 29% in October but up from 25% a year ago. All-cash buyers are less affected by changes in interest rates.

The November median sales price of all existing homes was $409,200, up 1.2% from last year. This marks the 29th consecutive month of year-over-year increases. The median condominium/co-op price in November was up 0.1% from a year ago at $358,600.  Recent gains for home inventory will put downward pressure on resale home prices in most markets in 2025.

Existing home sales in November were mixed across the four major regions. Sales rose in the Northeast (+4.1%) and South (+1.1%), fell in the Midwest (-2.0%), and remained unchanged in the West. On a year-over-year basis, sales were unchanged in the Northeast and South (2.8%), while down in the Midwest (-3.0%) and West (-1.3%).

The Pending Home Sales Index (PHSI) is a forward-looking indicator based on signed contracts. The PHSI rose from 74.9 to 76.3 in October. On a year-over-year basis, pending sales were 0.4% lower than a year ago, according to the National Association of Realtors’ data.


This article was originally published by a eyeonhousing.org . Read the Original article here. .

Existing home sales rose to an eight-month high in October as buyers took advantage of lower mortgage rates, according to the National Association of Realtors (NAR). Resale inventory improved from a year ago but remained below pre-pandemic levels. Relatively tight supply continued to push home prices higher and challenge housing affordability. These affordability pressures vary by region, with first-time buyers in the Northeast facing limited inventory, while buyers in the West struggle with elevated home prices.

Mortgage rates hovered between 6.5% and 7% earlier this year due to economic and tariff uncertainty. However, with the Fed resuming rate cuts in September, mortgage rates have fallen gradually. As of October 30th, the average mortgage rate decreased to 6.17%, the lowest in over a year. With additional rate cuts expected in coming months, lower mortgage rates and improved inventory should bring more buyers and sellers into the market.

Total existing home sales, including single-family homes, townhomes, condominiums, and co-ops, rose 1.2% to a seasonally adjusted annual rate of 4.10 million in October, the highest level since February. On a year-over-year basis, sales were 1.7% higher than a year ago.

The existing home inventory level was 1.52 million units in October, down 0.7% from September but up 10.9% from a year ago. At the current sales rate, October unsold inventory sits at a 4.4-months’ supply, down from 4.5-months in September but up from 4.1-months in October 2024. Inventory between 4.5 to 6 months’ supply is generally considered a balanced market.

Homes stayed on the market for a median of 34 days in October, up from 33 days last month and 29 days in October 2024.

The first-time buyer share was 32% in October, up from 30% in September and 27% from a year ago.

The October all-cash sales share was 29% of transactions, down from 30% in September but up from 27% a year ago. All-cash buyers are less affected by changes in interest rates.

The October median sales price of all existing homes was $415,200, up 2.1% from last year. This marks the 28th consecutive month of year-over-year increases. The median condominium/co-op price in October was up 0.9% from a year ago at $363,700.  Recent gains for home inventory will put downward pressure on resale home prices in most markets in 2025.

Existing home sales in October were mixed across the four major regions. Sales rose in the Midwest (5.3%) and South (0.5%), fell in the West (-1.3%), and remained unchanged in the Northeast. On a year-over-year basis, sales were up in the Northeast (4.3%), South (2.8%) and Midwest (2.1%), while down in the West (-2.6%).

The Pending Home Sales Index (PHSI) is a forward-looking indicator based on signed contracts. The PHSI remained unchanged at 74.8 in September, suggesting job market concerns kept buyers on the sideline despite mortgage rates near one-year lows. On a year-over-year basis, pending sales were 0.9% lower than a year ago, according to the National Association of Realtors’ data.


This article was originally published by a eyeonhousing.org . Read the Original article here. .

Challenging affordability conditions, elevated interest rates and economic uncertainty continue to act as headwinds on the housing sector as many potential buyers continue to stay on the sidelines.

Sales of newly built single-family homes edged 0.6% higher in June, rising to a seasonally adjusted annual rate of 627,000, according to newly released data from the U.S. Department of Housing and Urban Development and the U.S. Census Bureau. This marks a 0.6% increase from May’s unrevised figures. However, this is 6.6% below the June 2024 level. June new home sales are down 4.3% on a year-to-date basis. The past two months have been the slowest sales pace since October of last year, as mortgage rates averaged above 6.8% in June.

A new home sale occurs when a sales contract is signed, or a deposit is accepted. The home can be at any stage of construction: not yet started, under construction or completed. In addition to adjusting for seasonal effects, the June reading of 627,000 units is the number of homes that would sell if this pace continued for the next 12 months.

New single-family home inventory continued to rise with 511,000 residences marketed for sale as of June. This is 1.2% higher than the previous month, and 8.5% higher than a year ago. At the current sales pace, the months’ supply for new homes remained elevated at 9.8 compared to 8.4 a year ago. A measure near a six months’ supply is considered balanced.

As expected, the combined new and existing total months’ supply has risen over the last few months to a balanced 5.4 months due to continued buyer hesitation in both new and existing home sales markets. Elevated mortgage rates and sustained price levels continue to limit purchasing power, particularly among first-time and middle-income buyers.

A year ago, there were 94,000 completed, ready-to-occupy homes available for sale (not seasonally adjusted). By the end of June 2025, that number increased 21.3% to 114,000. However, completed, ready-to-occupy inventory remains just 22% of total inventory, while homes under construction account for 54%. The remaining 24% of new homes sold in June were homes that had not started construction when the sales contract was signed.

The median new home sale price edged down 4.9% in June to $401,800. This is down 2.9% compared to a year ago. In terms of affordability, the share of entry-level homes priced below $300,000 has been steadily falling in recent years. Only 14% of the homes were priced in this entry-level affordable range, while 28% of the homes were priced above $500,000. Most of the homes were priced between $300,000-$500,000.

Regionally, on a year-to-date basis, new home sales are down in all four regions, falling 1.6% in the South, 4.0% in the West, 8.5% in the Midwest, and 25.6% in the Northeast.

Discover more from Eye On Housing

Subscribe to get the latest posts sent to your email.


This article was originally published by a eyeonhousing.org . Read the Original article here. .

Existing home sales fell to 9-month low in June as home prices hit another monthly record high, according to the National Association of Realtors (NAR). Sluggish pace of sales suggest that higher mortgage rates and elevated home prices are continuing to sideline buyers, despite improved inventory conditions.

Mortgage rates have hovered between 6.5% and 7% due to ongoing economic and tariff uncertainty this year, prompting the Fed to pause interest rate cuts. With mortgage rates expected to stay above 6% for longer due to an anticipated slower easing pace in 2025, these prolonged higher rates and high home prices would continue to weigh on the market. As such, sales are likely to remain limited in the coming months.

Total existing home sales, including single-family homes, townhomes, condominiums, and co-ops, fell 2.7% to a seasonally adjusted annual rate of 3.93 million in June, the lowest level since October 2024. On a year-over-year basis, sales were unchanged from a year ago.

The existing home inventory level was 1.53 million units in June, down 0.6% from May, but up 15.9% from a year ago. At the current sales rate, June unsold inventory sits at a 4.7-months’ supply, up from 4.6-months in May and 4.0-months in June 2024. Inventory between 4.5 to 6 month’s supply is generally considered a balanced market.

Homes stayed on the market for a median of 27 days in June, unchanged from May but up from 22 days in June 2024.

The first-time buyer share was 30% in June, unchanged from May but up 29% from a year ago.

The June all-cash sales share was 29% of transactions, up from 27% in May and 28% a year ago. All-cash buyers are less affected by changes in interest rates.

The June median sales price of all existing homes was $453,300, up 2.0% from last year. This marked an all-time high for the month of June and the 24th consecutive month of year-over-year increases. The median condominium/co-op price in June was up 0.8% from a year ago at $374,500.  Recent gains for home inventory will put downward pressure on resale home prices in most markets in 2025.

Geographically, three of the four regions experienced a decline in existing home sales in June, with a decrease of 2.2% in the South, 4.0% in the Midwest, and 8.0% in the Northeast. Meanwhile, sales in the West rose 1.4%. On a year-over-year basis, sales were up in the Midwest (2.2%) and the South (1.7%) but were down in the West (-4.1%) and the Northeast (-4.2%).

The Pending Home Sales Index (PHSI) is a forward-looking indicator based on signed contracts. The PHSI rose from 71.3 to 72.6 in May, suggesting a solid labor market is supporting the market despite the elevated mortgage rates. On a year-over-year basis, pending sales were 1.1% higher than a year ago, per National Association of Realtors data.

Discover more from Eye On Housing

Subscribe to get the latest posts sent to your email.


This article was originally published by a eyeonhousing.org . Read the Original article here. .

From 2020 to 2024, sales of lower-priced new homes declined significantly as the market moved toward higher-priced segments. Rising construction costs—driven by inflation, supply chain disruptions, and labor shortages—as well as higher regulatory costs, made it increasingly difficult for builders to construct affordable homes. On the other hand, low levels of inventory pushed up the price of new single-family homes, deepening the housing affordability crisis for first-time and middle-income buyers.

National New Home Sales by Sales Price

Data from the U.S. Census’s Survey of Construction (SOC) shows that total sales of new single-family homes declined by 17% during the 2020—2024 period. Meanwhile, the median sales price of new single-family homes increased significantly, rising from $330,900 in 2020 to $420,300 in 2024. This steep rise in sales price has placed additional pressure on prospective home buyers, particularly those seeking homes in the lower-priced segments.

Between 2020 and 2024, the market for new single-family homes experienced significant shifts in the distribution of sales by price range. Most notably, there was a sharp decline in sales of lower-priced homes. Homes priced under $300,000 experienced a 65% decline in sales, while sales of homes priced between $300,000 and $399,999 fell by 10%. In contrast, higher-end segments saw substantial growth, with sales of homes priced between $800,000 and $999,999 more than doubling and those priced at $1,000,000 or more increasing by 85%.

The market share of lower-priced homes declined dramatically. In 2020, homes priced under $300,000 accounted for 40% of the total new single-family home sales, making them a dominant category. By 2024, this category had dropped to the third largest, overtaken by homes in the $300,000—$399,999 and $400,000—$499,999 ranges. Meanwhile, the share of higher-priced homes expanded, reflecting a broader shift toward more expensive construction and away from affordability.

Regional New Home Sales by Sales Price

The regional picture mirrors these national trends, though the magnitude and affected price category vary by geography. Between 2020 and 2024, all four regions—the Northeast, Midwest, South, and West—saw declines in new home sales. The West experienced the steepest drop at 28%, followed by the Midwest at 14%, the South at 13%, and the Northeast at 8%. The declines mainly reflect significant declines in lower-priced home sales.

In the Midwest and South, the declines in new home sales were limited to homes priced under $300,000. In the Northeast and West, where the regions tend to have higher median home prices, sales declines occurred in multiple price categories. The Northeast saw a broader decline in new homes sold under $600,000, while new home sales in the West reported declines in three price categories under $500,000.

Furthermore, all four regions also experienced a decline in the market share of lower-priced homes. In 2020, more than half of the new homes sold in the Midwest and South were priced under $300,000. By 2024, that share had plummeted to just 16% in the Midwest and 23% in the South. The Northeast and West also saw notable shifts, with the share of homes priced between $300,000 and $499,999 dropping sharply over the same period.

Discover more from Eye On Housing

Subscribe to get the latest posts sent to your email.


This article was originally published by a eyeonhousing.org . Read the Original article here. .


Elevated interest rates and economic uncertainty sent more home buyers to the sidelines in May as housing affordability conditions remain challenging.

Sales of newly built single-family homes declined 13.7% in May, falling back to a seasonally adjusted annual rate of 623,000 according to newly released data from the U.S. Department of Housing and Urban Development and the U.S. Census Bureau. This was the slowest pace since October of last year, as mortgage rates averaged 6.83% in May. Sales were particularly slow in the South, with the pace of sales down 21% in May.

The slowing of the housing market has occurred despite the growing use of of builder sales incentives, including 37% of home builders reporting cutting prices in the June NAHB/Wells Fargo Housing Market Index survey.

On a year-to-date basis, new home sales are 3.2% lower thus far in 2025. As a result of slowing home sales conditions, inventory continues to rise, marking an elevated 9.8 months’ supply in May.

As estimated by NAHB, total months’ supply, defined as a combination of current new and resale single-family inventory, now stands at 5.2. This is the highest sales-adjusted inventory level since 2015 and will place downward pressure on housing construction starts in the months ahead.

A new home sale occurs when a sales contract is signed, or a deposit is accepted. The home can be in any stage of construction: not yet started, under construction or completed. In addition to adjusting for seasonal effects, the May reading of 623,000 units is the number of homes that would sell if this pace continued for the next 12 months.

New single-family home inventory continued to rise with 507,000 residences marketed for sale as of May. This is 1.4% higher than the previous month and 8.1% higher than a year ago. At the current sales pace, the months’ supply for new homes stands at 9.8 compared to 8.5 a year ago. Completed, ready-to-occupy new home inventory stood at 115,000 in May, up 29% compared to a year ago on a non-seasonally adjusted basis. However, this measure was higher at the end of 2024.

The median new home sale price in May was $426,600, compared to $414,300 a year ago. This measure reflects the fact that higher income borrowers face fewer budget constraints than lower income prospective home buyers. New home sales priced below $500,000 were down 15% in May of 2025 compared to the May 2024.

Regionally, on a year-to-date basis, new home sales are down 20.7% in the Northeast, 11.9% in the Midwest and 1.8% in the South. Sales are up 2.1% in the West.

Discover more from Eye On Housing

Subscribe to get the latest posts sent to your email.


This article was originally published by a eyeonhousing.org . Read the Original article here. .


Existing home sales rose 0.8% in May but remained near historical lows, according to the National Association of Realtors (NAR). Despite the modest increase, this marks the slowest pace for May since 2009. The sluggish sales suggest higher mortgage rates and elevated home prices continue to sideline buyers even with improved inventory conditions.

Mortgage rates have hovered between 6.5% and 7% due to ongoing economic and tariff uncertainty this year, prompting the Fed to pause interest rate cuts. With mortgage rates expected to stay above 6% for longer due to an anticipated slower easing pace in 2025, these prolonged higher rates and high home prices would continue to weigh on the market. As such, sales are likely to remain limited in the coming months.

Total existing home sales, including single-family homes, townhomes, condominiums, and co-ops, rose 0.8% to a seasonally adjusted annual rate of 4.03 million in May. On a year-over-year basis, sales were 0.7% lower than a year ago.

The first-time buyer share was 30% in May, down from 34% in April and 31% from a year ago.

The existing home inventory level was 1.54 million units in May, up 6.2% from April, and up 20.3% from a year ago. At the current sales rate, May unsold inventory sits at a 4.6-months’ supply, up from 4.4-months in April and 3.8-months in May 2024. Inventory between 4.5 to 6 month’s supply is generally considered a balanced market.

Homes stayed on the market for an average of 27 days in May, down from 29 days in April but up from 24 days in May 2024.

The May all-cash sales share was 27% of transactions, up from 25% in April but down from 28% a year ago. All-cash buyers are less affected by changes in interest rates.

The May median sales price of all existing homes was $422,800, up 1.3% from last year. This marked an all-time high for the month of May and the 23rd consecutive month of year-over-year increases. The median condominium/co-op price in May was up 0.7% from a year ago at $371,300.  Recent gains for home inventory will put downward pressure on resale home prices in most markets in 2025.

Geographically, three of the four regions saw an increase in existing home sales in May, with an increase of 1.7% in the South, 1.0% in the Midwest, and 4.2% in the Northeast. Meanwhile, sales in the West fell 5.4%. On a year-over-year basis, sales were up in the Northeast (4.2%) and the Midwest (1.0%), while sales were down in the South (-0.5%) and the West (-6.7%).

The Pending Home Sales Index (PHSI) is a forward-looking indicator based on signed contracts. The PHSI fell from 76.1 to 71.3 in April, suggesting buyers remained constrained by higher mortgage rates. On a year-over-year basis, pending sales were 2.5% lower than a year ago, per National Association of Realtors data.

Discover more from Eye On Housing

Subscribe to get the latest posts sent to your email.


This article was originally published by a eyeonhousing.org . Read the Original article here. .

Pin It