Tag

Rises

Browsing


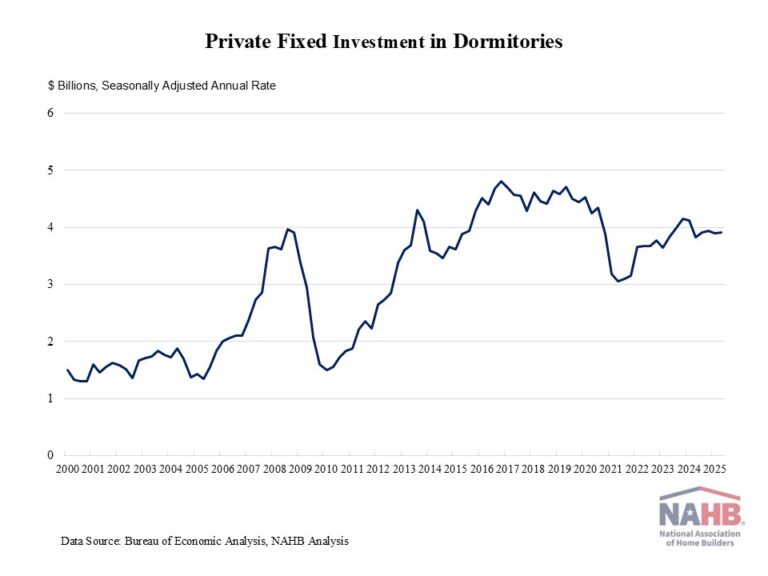
Private fixed investment in student dormitories inched up 0.3% in the second quarter of 2025, reaching a seasonally adjusted annual rate (SAAR) of $3.9 billion. This gain followed a 1.1% decrease in the previous quarter, as elevated interest rates placed a damper on student housing construction. Moreover, private fixed investment in dorms was 2.1% higher than a year ago 

Private fixed investment in student housing experienced a surge after the Great Recession, as college enrollment increased from 17.2 million in 2006 to 20.4 million in 2011. However, during the pandemic, private fixed investment in student housing declined drastically from $4.4 billion (SAAR) in the last quarter of 2019 to a lower annual pace of $3 billion in the second quarter of 2021, as COVID-19 interrupted normal on-campus learning. According to the National Student Clearinghouse Research Center, college enrollment fell by 3.6% in the fall of 2020 and by 3.1% in the fall of 2021.  

Since then, private fixed investment in dorms has rebounded, as college enrollments show a gradual recovery from pandemic driven declines. Effective in-person learning requires college students to return to campuses, boosting the student housing sector.  Still, demographic trends are reshaping the outlook for student housing. The U.S. faces slower growth in the college-age population as birth rates declined following the Great Recession. As a result, total enrollment in postsecondary institutions is projected to only increase 8% from 2020 to 2030, according to the National Center for Education Statistics, well below the 37% increase between 2000 and 2010. 

Despite recent fluctuations, the student housing construction shows signs of recovery and future growth is expected in response to increasing student enrollment projections. 

Discover more from Eye On Housing

Subscribe to get the latest posts sent to your email.


This article was originally published by a eyeonhousing.org . Read the Original article here. .


Personal income increased by 0.3% in June, following a 0.4% dip in May, according to the latest data from the Bureau of Economic Analysis. The gains in personal income were largely driven by higher wages and social benefits. However, the pace of personal income growth slowed from its peak monthly gain of 1.4% in January 2024.  

Real disposable income, the amount remaining after adjusted for taxes and inflation, was unchanged in June, following a 0.7% decline in May. On a year-over-year basis, real (inflation-adjusted) disposable income rose 1.7%, down from a 6.5% year-over-year peak recorded in June 2023.  

Spending also showed signs of softening. Personal consumption expenditures rose 0.3% in June, after staying flat in May. Real spending, adjusted to remove inflation, increased 0.1% in June, with expenditures on goods climbing 0.1% and spending on services up 0.1%.


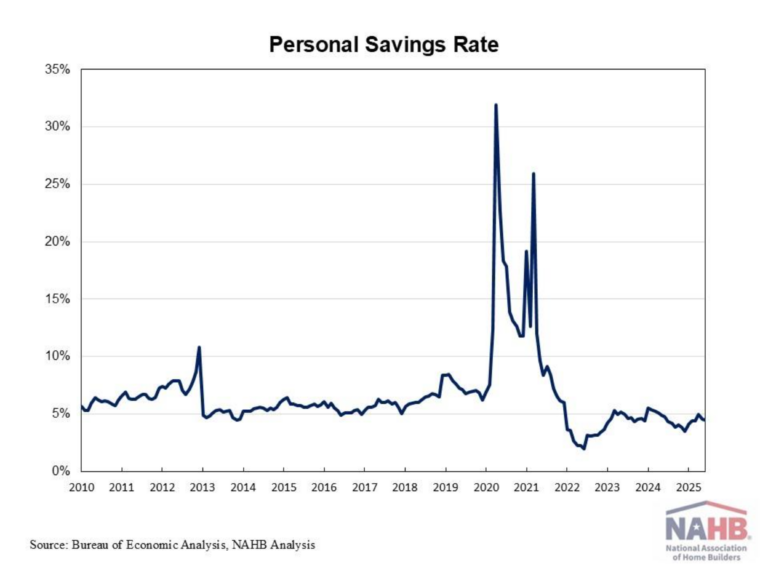
With income growth outpacing spending, the personal savings rate increased to 4.5% in June. But with inflation eroding compensation gains, people are dipping into savings to support spending. This trend will ultimately lead to a slowing of consumer spending. 

Discover more from Eye On Housing

Subscribe to get the latest posts sent to your email.


This article was originally published by a eyeonhousing.org . Read the Original article here. .

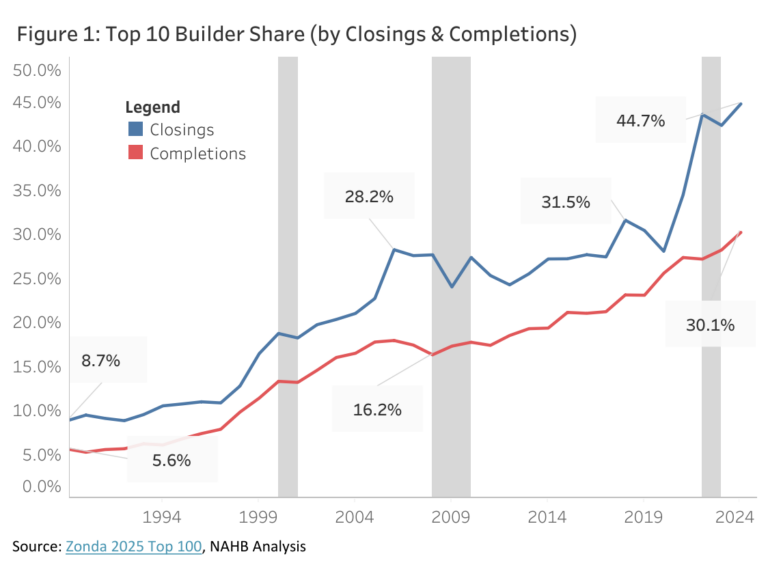
The top ten builders captured a record 44.7% of all new U.S. single-family home closings in 2024, up 2.4 percentage points from 2023 (42.3%). This is the highest share ever captured by the top ten builders since NAHB began tracking BUILDER magazine data on new single-family home closings in 1989. The 2024 share constitutes 306,932 closings out of 686,000 new single-family houses sold in 2024. However, closings by the top 10 builders only represent 30.1% of new single-family home completions, a wider measure of home building that covers not-for-sale home construction. Also of note, the top 15 builders accounted for more than half of all closings (51%) for the first time ever in 2024.

The top ten builder share has increased significantly –albeit unevenly– in the last 35 years. In 1989, the top ten builders accounted for only 8.7% of single-family home closings. By 2000, the share had more than doubled to 18.7%, growing to 28.2% by 2006 and 31.5% by 2018. After slight declines in 2019 and 2020, the share exceeded 40% for the first time in 2022 (43.5%) and reached a record high in 2024 (44.7%). (Figure 1).

Meanwhile, the top ten builder share by completions, has also trended upward, with a share of just 5.6% in 1989. It reached double digits for the first time in 1999 (11.3%) and rose to a cycle high of 17.9% in 2006. The share broke the 20% mark for the first time in 2015 (21.0%) and has continued to trend upward since, reaching an all-time high of 30.1% in 2024 (Figure 1).

The top five highest producing builders did not change from 2023 to 2024, with D.R. Horton maintaining its position as America’s largest single-family home builder. D.R. Horton captured 13.6% of the market with 93,311 closings, marking a fourth consecutive year with a market share above 10%, and a 23rd consecutive year atop the list. Results also show that 2024 marked the third year in a row where the top three builders accounted for more than a quarter (29.9%) of overall closings, with Lennar and PulteGroup achieving 11.7% and 4.6%, respectively. With 3.3% and 2.3% of overall closings, NVR and Meritage Homes ranked fourth and fifth on the list, respectively.

Notably, SH Residential Holdings (U.S. subsidiary of Sekisui House, a Japanese homebuilder, who acquired M.D.C. Holdings in 2024) broke into the top ten in 2024, ranking sixth on the list with 2.2% of the market. Clayton Properties Group, ranking 8th in 2023, fell out of the top 10 for the first time since 2019. KB Home (2.1%), Taylor Morrison (1.9%), Century Communities (1.6%), and Toll Brothers (1.6%) round out the top 10 builders for 2024 (Figure 2).

Builder Magazine also released Local Leaders data on the top 10 builders in the top 50 largest new-home markets in the U.S. where ranking is determined by the number of single-family permits, which NAHB will analyze in a later post.

Discover more from Eye On Housing

Subscribe to get the latest posts sent to your email.


This article was originally published by a eyeonhousing.org . Read the Original article here. .

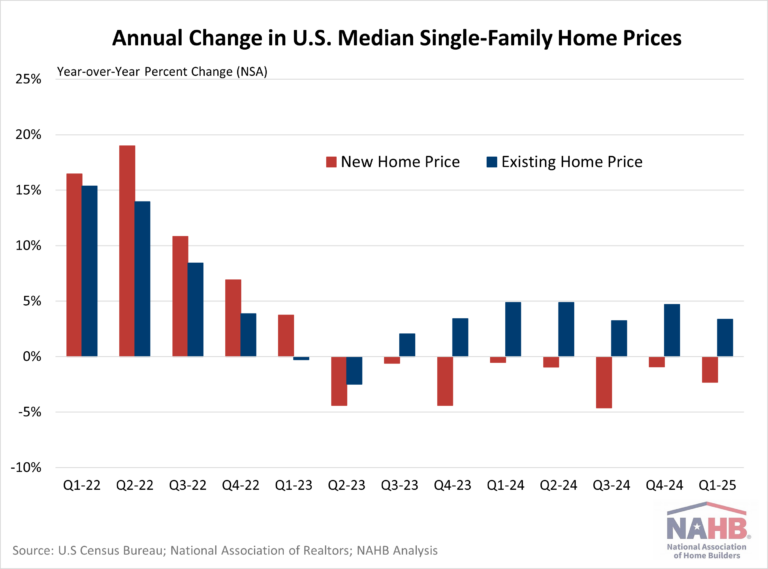
The median price for a new single-family home sold in the first quarter of 2025 was $416,900, a mere $14,600 above the existing home sale price of $402,300, according to U.S. Census Bureau and National Association of Realtors data (not seasonally adjusted – NSA).

Typically, new homes carry a price premium over existing homes. However, the median existing home price exceeded the new home price in the second quarter of 2024 and again in the third quarter of 2024. The first quarter of 2025’s $14,600 price difference is considerably modest by historical standards. Just over two years ago in Q4 2022, the price gap hit a peak with new homes selling for $64,200 more than existing homes. The average difference over the last five years was $26,700, while the decade (2010-2019) prior saw a much wider gap of $66,000.

Both new and existing homes saw dramatic increases in prices post-pandemic due to higher construction costs and limited supply. While overall home prices remain elevated compared to historical norms, new home prices have moderated due to builder business decisions, but existing home prices continue to increase because of lean supply.

The median price for a new single-family home sold in the first quarter of 2025 decreased 2.32% from the previous year. New home prices have continued to experience year-over-year declines for eight consecutive quarters.

Meanwhile, the median price for existing single-family homes increased 3.38% from one year ago. Existing home prices have continued to experience year-over-year increases for seven consecutive quarters.

There are several factors as to why new and existing homes are selling at similar price points. Tight inventory continues to push up prices for existing homes, as many homeowners who secured low mortgage rates during the pandemic are hesitant to sell due to current high interest rates.

Meanwhile, new home pricing is more volatile – prices change due to the types and locations of homes being built. Despite various challenges facing the industry, home builders are adapting to affordability challenges by building on smaller lots, constructing smaller homes, and offering incentives. Additionally, there has been a shift in home building toward the South, associated with less expensive homes because of policy effects.

The least expensive region for homes in the first quarter was the Midwest, with a median price of $367,500 for new homes and $297,800 for existing homes. The South followed closely, with a median new home price of $376,000 and an existing home price of $361,800.

New homes were most expensive in the Northeast with a median price of $784,900, while the West sold at $522,100. However, for existing homes, the West led as the most expensive region at $626,000, followed by the Northeast at $482,700.

The new home price premium was most pronounced in the Northeast, where new homes sold for $302,200 more than existing homes. In contrast, the South saw little difference with a modest $14,200— similar to the national trend. Uniquely, this pattern reversed in the West, where existing homes were $103,900 more than new homes.

Discover more from Eye On Housing

Subscribe to get the latest posts sent to your email.


This article was originally published by a eyeonhousing.org . Read the Original article here. .

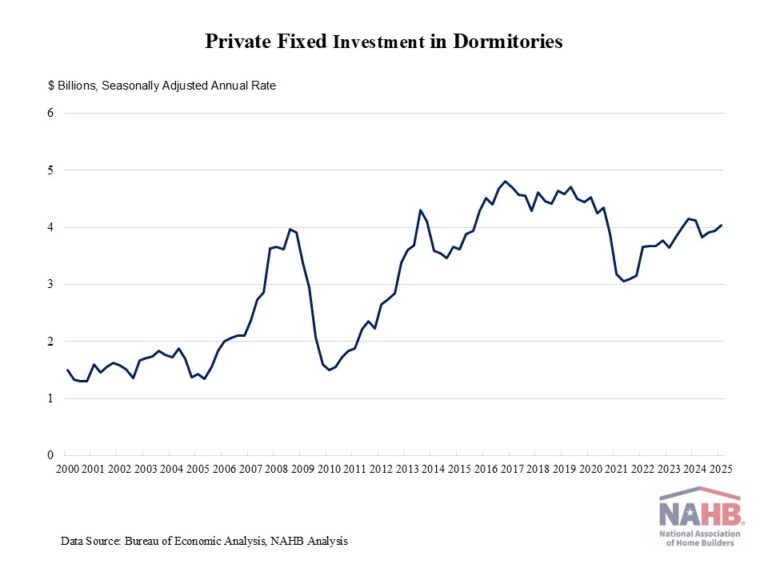
Private fixed investment in student dormitories increased by 2.3% in the first quarter of 2025, reaching a seasonally adjusted annual rate (SAAR) of $4.04 billion. This gain followed a 1.0% increase in the previous quarter. However, private fixed investment in dorms was 2% lower than a year ago, as elevated interest rates place a damper on student housing construction.  

Private fixed investment in student housing experienced a surge after the Great Recession, as college enrollment increased from 17.2 million in 2006 to 20.4 million in 2011. However, during the pandemic, private fixed investment in student housing declined drastically from $4.4 billion (SAAR) in the last quarter of 2019 to a lower annual pace of $3 billion in the second quarter of 2021, as COVID-19 interrupted normal on-campus learning. According to the National Student Clearinghouse Research Center, college enrollment fell by 3.6% in the fall of 2020 and by 3.1% in the fall of 2021.  

Since then, private fixed investment in dorms has rebounded, as college enrollments show a gradual recovery from pandemic driven declines. Effective in-person learning requires college students to return to campuses, boosting the student housing sector.  Still, demographic trends are reshaping the outlook for student housing. The U.S. faces slower growth in the college-age population as birth rates declined following the Great Recession. As a result, total enrollment in postsecondary institutions is projected to only increase 8% from 2020 to 2030, according to the National Center for Education Statistics, well below the 37% increase between 2000 and 2010. 

Despite recent fluctuations, the student housing construction shows signs of recovery and future growth is expected in response to increasing student enrollment projections. 

Discover more from Eye On Housing

Subscribe to get the latest posts sent to your email.


This article was originally published by a eyeonhousing.org . Read the Original article here. .

Personal income increased by 0.5% in March, following a 0.7% rise in February and a 0.6% gain in January, according to the latest data from the Bureau of Economic Analysis. The gains in personal income were largely driven by higher wages and salaries. However, the pace of personal income growth slowed from its peak monthly gain of 1.4% in January 2024.

Real disposable income, the amount remaining after adjusted for taxes and inflation, inched up 0.5% in March, following a 0.4% increase in February and 0.2% gain in January. On a year-over-year basis, real (inflation-adjusted) disposable income rose 1.7%, down from a 6.5% year-over-year peak recorded in June 2023. No adjustments were made to personal income for the federal employees’ deferred resignation program in March, as participants are still considered as employed and continue to receive compensations until their official separation from the federal government.

Meanwhile, personal consumption expenditures rose 0.7% in March, building on a 0.5% increase in February. Real spending, adjusted to remove inflation, increased 0.7% in March, with expenditures on goods climbing 1.3% and spending on services up 0.4%.

As spending outpaced personal income growth, the personal savings rate dipped to 3.9% in March. With inflation eroding compensation gains, people are dipping into savings to support spending. This trend will ultimately lead to a slowing of consumer spending.

Discover more from Eye On Housing

Subscribe to get the latest posts sent to your email.


This article was originally published by a eyeonhousing.org . Read the Original article here. .

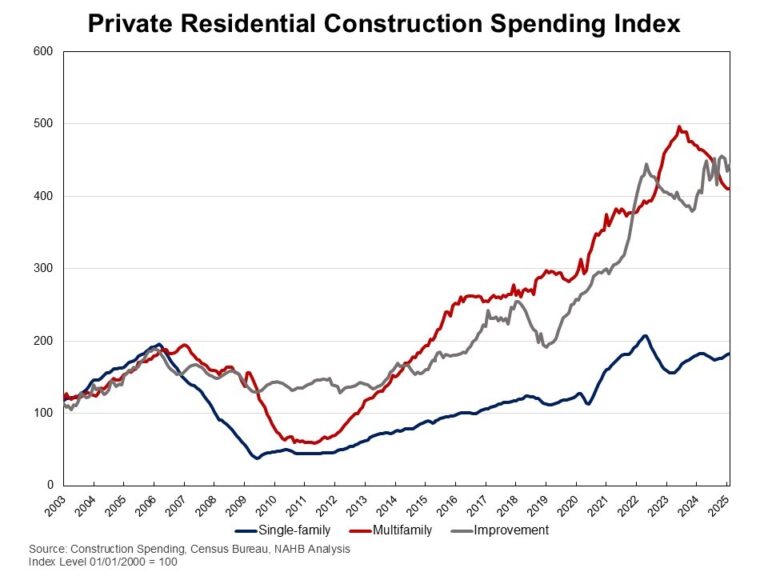
Private residential construction spending increased by 1.3% in February, rebounding from a 1.2% dip in January. The growth was largely driven by higher spending on single-family construction and residential improvements. On a year-over-year basis, the February report showed a 1.6% gain, indicating a modest growth in private residential construction spending during market uncertainties. 

The monthly increase in total private construction spending was primarily driven by gains in spending on single-family construction and residential improvements. Single-family construction spending was up 1% for the month, continuing to grow after a five-month decline from April to August 2024. This growth is consistent with strong single-family housing starts in February. However, single-family construction spending remained 0.1% lower than a year ago. Meanwhile, improvement spending rose by 2% in February and was 8.9% higher compared to the same period last year. In contrast, multifamily construction spending stayed flat in February, extending the downward trend that began in December 2023. Compared to a year ago, multifamily construction spending was down 11.6%. 

The NAHB construction spending index is shown in the graph below. The index illustrates how   spending on single-family construction has slowed since early 2024 under the pressure of elevated interest rates and concerns over building material tariffs. Multifamily construction spending growth has also slowed down after the peak in July 2023. Meanwhile, improvement spending has increased its pace since late 2023.  

Spending on private nonresidential construction was up 2.5% over a year ago. The annual private nonresidential spending increase was mainly due to higher spending for the class of manufacturing ($10.5 billion), followed by the power category ($6.4 billion). 

Discover more from Eye On Housing

Subscribe to get the latest posts sent to your email.


This article was originally published by a eyeonhousing.org . Read the Original article here. .

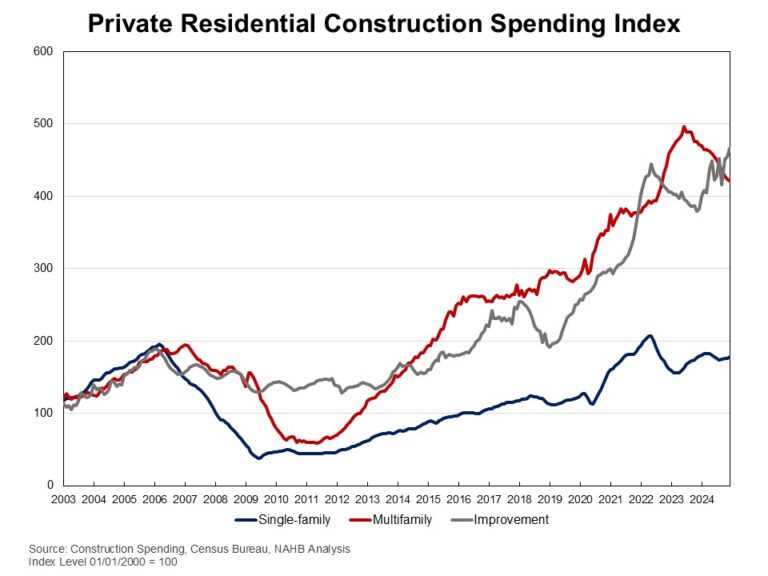
Private residential construction spending increased by 1.5% in December 2024, according to the latest U.S. Census Construction Spending data. It was the third consecutive monthly increase since September 2024.  On a year-over-year basis, the December report showed a 6% increase.

The monthly increase in total private construction spending was primarily driven by higher spending on single-family construction and residential improvements. Single-family construction spending was up 1% for the month. This marks a continuation of growth after a five-month decline from April to August, aligning with steady builder confidence seen in the Housing Market Index. However, single-family construction remained 0.8% lower than a year ago. Improvement spending rose by 2.6% in December and was 21.9% higher compared to the same period last year. In contrast, multifamily construction spending edged down 0.3% in December, following an 8.4% increase in October and a 0.8% up in November. Compared to a year ago, multifamily construction spending was still 10.5% lower.

The NAHB construction spending index is shown in the graph below. The index illustrates how   spending on single-family construction has slowed since early 2024 under the pressure of elevated interest rates. Multifamily construction spending growth has also slowed down after the peak in July 2023. Meanwhile, improvement spending has increased its pace since late 2023.

Spending on private nonresidential construction was up 2.3% over a year ago. The annual private nonresidential spending increase was mainly due to higher spending for the class of manufacturing ($23.6 billion), followed by the power category ($4.5 billion).

Discover more from Eye On Housing

Subscribe to get the latest posts sent to your email.


This article was originally published by a eyeonhousing.org . Read the Original article here. .

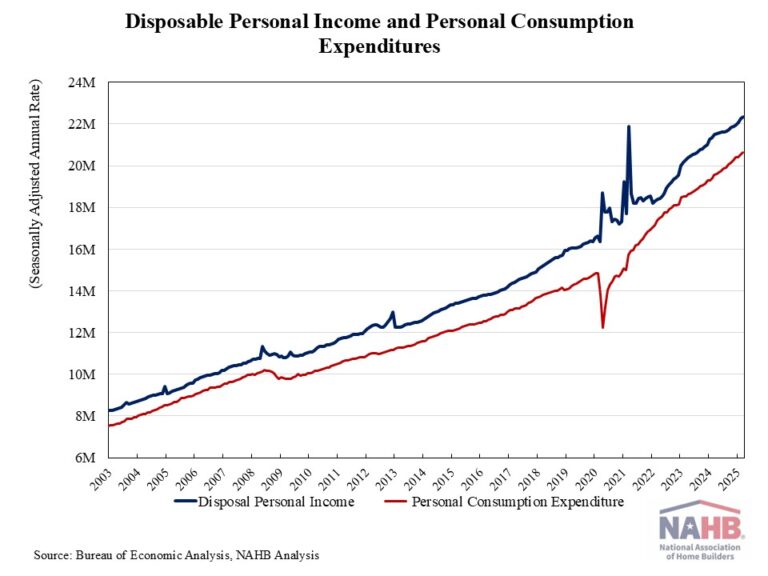
Personal income increased by 0.4% in December, following a 0.3% rise in November and a 0.7% gain in October, according to the latest data from the Bureau of Economic Analysis. The gains in personal income were largely driven by higher wages and salaries. However, the pace of personal income growth slowed from its peak monthly gain of 1.4% in January 2024.

Real disposable income, the amount remaining after adjusted for taxes and inflation, inched up 0.1% in December, matching November’s gain and following a 0.4% increase in October. On a year-over-year basis, real (inflation-adjusted) disposable income rose 2.4%, down from a 6.5% year-over-year peak recorded in June 2023.

Meanwhile, personal consumption expenditures rose 0.7% in December, building on a 0.6% increase in November and 0.5% in October. Real spending, adjusted to remove inflation, increased 0.4% in December, with expenditures on goods climbing 0.7% and spending on services up 0.3%.

As spending outpaced personal income growth, the personal savings rate dipped to 3.8% in December, down from 4.1% in November and 4.3% in October. With inflation eroding compensation gains, people are dipping into savings to support spending. This trend will ultimately lead to a slowing of consumer spending.

Discover more from Eye On Housing

Subscribe to get the latest posts sent to your email.


This article was originally published by a eyeonhousing.org . Read the Original article here. .

Private residential construction spending increased by 1.5% in October, according to the latest U.S. Census Construction Spending data. Year-over-year, the October report showed a 6.4% increase.

The monthly increase in total private construction spending was primarily driven by higher spending on residential improvements. Improvement spending surged by 2.7% in October and was 18.5% higher compared to the same period last year.

Spending on single-family construction inched up by 0.8% for the month. This marks a continuation of growth after a five-month decline from April to August, aligning with the rising builder confidence. Compared to a year ago, spending on single-family construction was 1.3% higher.

Meanwhile, multifamily construction spending ended its streak of ten consecutive monthly declines, edging up by 0.2% in October. Despite this slightly monthly gain, multifamily construction spending remained 6.8% lower compared to a year ago.

The NAHB construction spending index is shown in the graph below. The index illustrates how   spending on single-family construction has slowed since early 2024 under the pressure of elevated interest rates. Multifamily construction spending growth has also slowed down after the peak in July 2023. Meanwhile, improvement spending has increased its pace since late 2023.

Spending on private nonresidential construction was up 3.5% over a year ago. The annual private nonresidential spending increase was mainly due to higher spending for the class of manufacturing ($32.9 billion), followed by the power category ($6.4 billion).

Discover more from Eye On Housing

Subscribe to get the latest posts sent to your email.


This article was originally published by a eyeonhousing.org . Read the Original article here. .

Pin It