Tag

Rise

Browsing


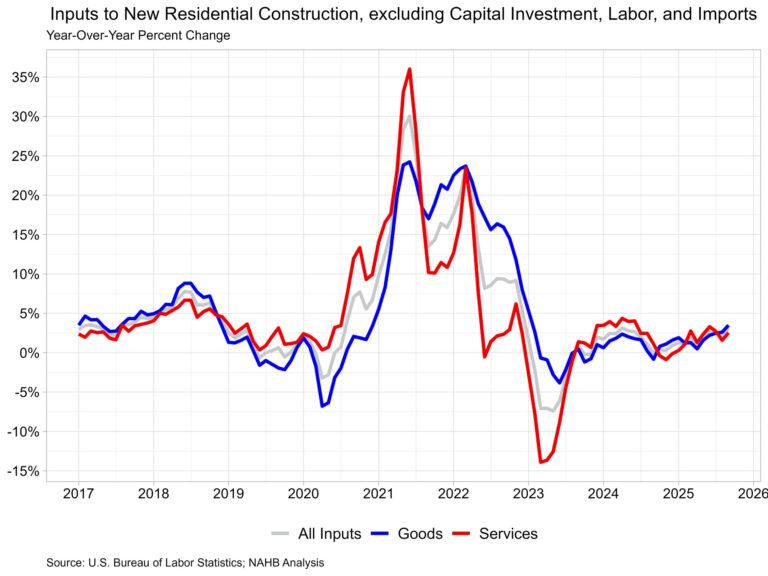
Prices for residential building materials rose again in July, marking the largest year-over-year increase in over two years. The underlying price growth trend remained the same, with service prices continuing to grow at a faster pace than goods prices. Similar to last month, parts for construction machinery and metal molding/trim experienced significant price growth, as both increased over 25% compared to last year.

Prices for inputs to new residential construction—excluding capital investment, labor, and imports—rose 0.2% in July, following a 0.8% increase in June. These figures are taken from the most recent Producer Price Index (PPI) report published by U.S. Bureau of Labor Statistics. The PPI measures prices that domestic producers receive for their goods and services; this differs from the Consumer Price Index which measures what consumers pay and includes both domestic products as well as imports.

The inputs to the new residential construction price index grew 2.8% from July of last year. The index can be broken into two components­—the goods component increased 2.4% over the year, while services increased 3.3%. For comparison, the total final demand index, which measures all goods and services across the economy, increased 3.3% over the year, with final demand with respect to goods up 1.9% and final demand for services up 4.0%.

Input Goods

The goods component has a larger importance to the total residential construction inputs price index, representing around 60%. On a monthly basis, the price of input goods to new residential construction was up 0.4% in July.

The input goods to residential construction index can be further broken down into two separate components, one measuring energy inputs with the other measuring remaining goods. The latter of these two components simply represents building materials used in residential construction, which makes up around 93% of the goods index.

Energy input prices jumped up 3.9% between June and July but were 8.1% lower than one year ago. Building material prices were up 0.2% between June and July and up 3.3% compared to one year ago.

Tariffs on building materials do not directly show up in the PPI data because the PPI measures prices for domestically produced goods and services. In fact, tariffs and taxes are explicitly excluded from the PPI. Despite this, price changes in reaction to tariffs are included in the PPI, meaning price increases to pass on increased costs of materials will show up in this pricing data.  Announced tariffs in recent months have resulted in material increases across a few different goods, specifically certain metal products and equipment.

In July, the largest year-over-year input price increase was for construction machinery and equipment parts, reporting a 31.4% increase over the year. Meanwhile, metal molding and trim prices were up 25.6%, fabricated steel plate prices were up 14.3%, and nonferrous wire/cable up 10.5%. Metal commodities have been the primary targets of tariffs, with 50% tariffs in effect on steel and aluminum products and a 50% tariff on semifinished products of copper.

Input Services

Prices for service inputs to residential construction reported a decrease of 0.2% in July. On a year-over-year basis, service input prices are up 3.3%. The price index for service inputs to residential construction can be broken out into three separate components: a trade services component, a transportation and warehousing services component, and a services excluding trade, transportation and warehousing component (other services).

 The most significant component is trade services (around 60%), followed by other services (around 29%), and finally transportation and warehousing services (around 11%). The largest component, trade services, was up 5.2% from a year ago. The other services component was up 1.2% over the year.  Lastly, prices for transportation and warehousing services fell 0.6% compared to July of last year.

Inputs to New Construction Satellite Data

Within the PPI that BLS publishes, new experimental data was recently published regarding inputs to new construction. The data expands existing inputs to industry indexes by incorporating import prices with prices for domestically produced goods and services. With this additional data, users can track how industry input costs are changing among domestically produced products and imported products. This data focuses on new construction, but the complete dataset includes indices across numerous industries that can be found here on the BLS website.

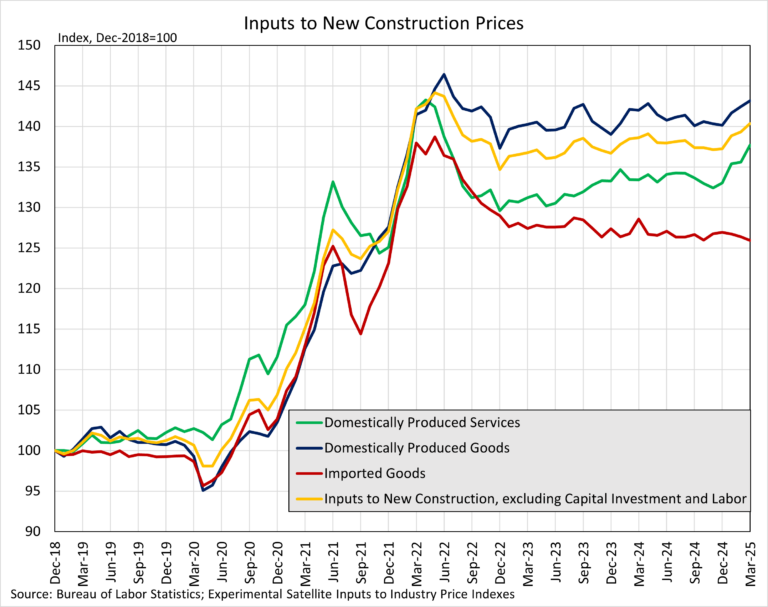
New construction input prices are primarily influenced by domestically produced goods and services, with domestic products accounting for 90% of the weight of the industry index for new construction. Imported goods make up the remaining 10% of the index.

The latest available data, for May 2025, showed that domestically produced goods have experienced faster price growth compared to imported goods used in new construction. On a year-over-year basis, the index for domestic goods increased 1.6%, while prices for imported goods rose 0.1% over the same period. Comparatively, service prices have risen more than good prices over the past year, rising 2.7% year-over-year. Across the three indexes, all inputs remain at higher levels compared to pre-pandemic prices.

Discover more from Eye On Housing

Subscribe to get the latest posts sent to your email.


This article was originally published by a eyeonhousing.org . Read the Original article here. .

Overall consumer credit continued to rise in 2025, but the pace of growth remains slow. Student loan balances also rose year-over-year as borrowers resumed payments following the end of pandemic-era relief. Meanwhile, credit card and auto loan debt both experienced their slowest annual growth rates in years. Despite historically high interest rates, credit card and auto loan rates have eased slightly, providing some relief for consumers facing elevated borrowing costs.

Total outstanding U.S. consumer credit reached $5.05 trillion for the second quarter of 2025, according to the Federal Reserve’s G.19 Consumer Credit Report. This is an increase of 2.32% at a seasonally adjusted annual rate (SAAR) compared to the previous quarter, and a 2.09% increase compared to last year. Both rates have increased from last quarter.

Nonrevolving Credit

Nonrevolving credit, largely driven by student and auto loans (the G.19 report excludes mortgage loans), reached $3.76 trillion (SA) in the second quarter of 2025. This marks a 2.90% increase (SAAR) from the previous quarter, and a 1.94% increase from last year.

Student loan debt stood at $1.81 trillion (NSA) for the second quarter of 2025, marking a 4.16% increase from a year ago. The end of the COVID-19 Emergency Relief—which allowed 0% interest and halted payments until September 1, 2023—led year-over-year growth to decline for four consecutive quarters, from Q3 2023 through Q2 2024 as borrowers resumed payments and took on less new debt. The past four quarters have shown a return to growth, nearly matching pre-pandemic growth rates.

Auto loans reached a level of $1.56 trillion (NSA), showing a year-over-year increase of only 0.31%, marking the slowest growth rate since 2010. The deceleration in growth can be attributed to several factors, including stricter lending standards, elevated interest rates, and overall inflation. Auto loan rates for a 60-month new car stood at 7.67% (NSA) for the second quarter of 2025, a historically elevated level. However, auto rates have slowed modestly, decreasing by 0.53 percentage points compared to a year ago.

Revolving Credit

Revolving credit, primarily made up of credit card debt, rose to $1.30 trillion (SA) in the second quarter of 2025. This represents a 0.66% increase (SAAR) from the previous quarter and a 2.54% increase year-over-year. Both measures reflect a notable slowdown, marking the weakest growth in revolving credit in several years. This deceleration comes as credit card interest rates remain elevated, with the average rate held by commercial banks (NSA) at 21.16%. Although rates have hovered near historic hi­ghs since Q4 2022, the past two quarters have shown modest year-over-year declines, reflecting the impact of rate cuts that began in 2024.

Discover more from Eye On Housing

Subscribe to get the latest posts sent to your email.


This article was originally published by a eyeonhousing.org . Read the Original article here. .


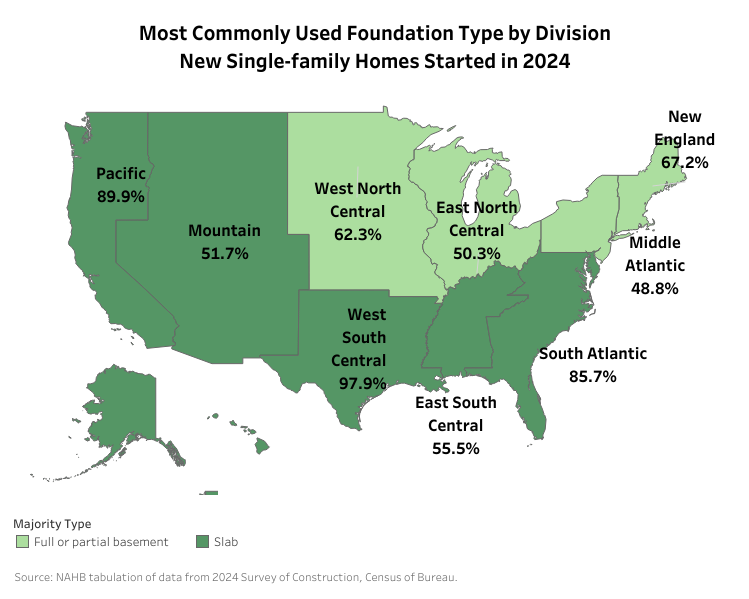
In 2024, 73% of new single-family homes started were built on slab foundations, according to NAHB analysis of the U.S. Census Bureau’s Survey of Construction (SOC). Although this was a modest year-over-year increase of 0.6 percentage points, it continues the upward trend in slab adoption, widening the gap between slabs and other foundation types. In comparison, basements (full or partial) accounted for 17% of new homes, while crawl spaces made up just 9.2%.

Foundation type continues to follow regional climate patterns. In colder northern divisions, where foundations to extend below the frost line, basements are more common. In 2024, the majority of homes in New England (67.2%), West North Central (62.3%), East North Central (50.3%), and the Middle Atlantic (48.8%) were built with full or partial basements. Among these, East North Central (1,119 sq. ft.) and the Middle Atlantic (1,113 sq. ft.) had the largest average finished basement areas, both exceeding the national average of 1,112 sq. ft. West North Central followed with 940 sq. ft., and New England averaged 810 sq. ft.

In contrast, warmer regions favor slab foundations for their affordability and efficiency. Nearly all new single-family homes in West South Central (97.9%), Pacific (89.9%), and South Atlantic (85.7%) divisions were built on slabs in 2024. The cost advantages of slabs have also led to increased adoption in some northern divisions – especially post-pandemic, as rising material costs and supply chain disruptions pushed builders to prioritize cost-effective construction methods.

Crawl space foundations have seen a long-term decline. While East South Central and Pacific divisions have historically led in crawl space usage, both have experienced noticeable decreases, particularly the Pacific, which saw a sharp drop in the past decade. Interestingly, the Mountain division has seen a gradual rebound in crawl space use, now ranking second in crawl space share. Meanwhile, divisions such as East North Central, New England, and West South Central have consistently maintained shares of new homes started below 10%, reflecting persistent regional preferences. Notably, the West North Central division surpassed the 10% threshold in 2024 after several years of incremental growth, although it remains unclear whether this marks a lasting shift or a one-time fluctuation.

Discover more from Eye On Housing

Subscribe to get the latest posts sent to your email.


This article was originally published by a eyeonhousing.org . Read the Original article here. .


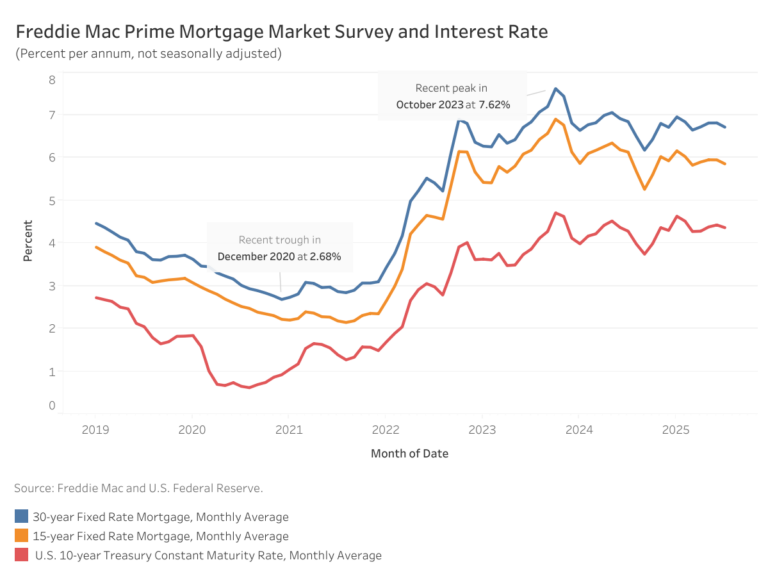
Average mortgage rates dipped in July, according to Freddie Mac. The average 30-year fixed-rate mortgage was 6.72%, 10 basis points (bps) lower than June. Meanwhile, the 15-year rate declined 9 bps to average at 5.86%. Compared to a year ago, the 30-year rate is down 13 basis points (bps), and the 15-year rate is 28 bps lower.

The 10-year Treasury yield, a key benchmark for long-term borrowing, averaged 4.37% in July – a 6 bps decline from the previous month. Yields began the month lower but reversed course and rose steadily as investor expectations solidified that the Federal Reserve would maintain its current policy stance. These expectations were driven by economic data showing an uptick in inflation while the economy and labor market remained solid.

On July 30, the Federal Open Market Committee (FOMC) solidified market expectations by voting to keep the federal funds rate unchanged at 4.25% to 4.50%. However, just days later, the July employment report released by the Bureau of Labor Statistics on Friday, August 1, showed downward revisions to job gains in May and June. In response, yields fell to around 4.2% as investors perceived an increased likelihood of a rate cut at the Fed’s next meeting in September.

Discover more from Eye On Housing

Subscribe to get the latest posts sent to your email.


This article was originally published by a eyeonhousing.org . Read the Original article here. .


Prices for inputs to new residential construction—excluding capital investment, labor, and imports—rose 0.2% in May, following a (revised) decrease of 0.2% in April. These figures are taken from the most recent Producer Price Index (PPI) report published by U.S. Bureau of Labor Statistics. The PPI measures prices that domestic producers receive for their goods and services; this differs from the Consumer Price Index which measures what consumers pay and includes both domestic products as well as imports.

The inputs to the New Residential Construction Price Index grew 1.9% from May of last year. The index can be broken into two components­—the goods component increased 1.6% over the year, with services increasing 2.3%. For comparison, the total final demand index, which measures all goods and services across the economy, increased 2.6% over the year, with final demand with respect to goods up 1.3% and final demand for services up 3.2% over the year.

Input Goods

The goods component has a larger importance to the total residential construction inputs price index, representing around 60%. For the month, the price of input goods to new residential construction was up 0.1% in May.

The input goods to residential construction index can be further broken down into two separate components, one measuring energy inputs with the other measuring remaining goods. The latter of these two components simply represents building materials used in residential construction, which makes up around 93% of the goods index.

Energy input prices were up 0.8% between April and May but were 9.8% lower than one year ago. Building material prices were up 0.1% between April and May while up 2.5% compared to one year ago. Across building material inputs, the commodity with the largest monthly increase in May was parts for construction machinery and equipment, which increased 6.8% after increasing 8.4% in April.

Input Services

Prices for service inputs to residential construction reported an increase of 0.3% in May. On a year-over-year basis, service input prices are up 2.3%. The price index for service inputs to residential construction can be broken out into three separate components: a trade services component, a transportation and warehousing services component, and a services excluding trade, transportation and warehousing component (other services). The most significant component is trade services (around 60%), followed by other services (around 29%), and finally transportation and warehousing services (around 11%). The largest component, trade services, was up 2.9% from a year ago. The other services component was up 1.4% over the year.  Lastly, prices for transportation and warehousing services advanced 1.8% compared to May of last year.

Inputs to New Construction Satellite Data

Within the PPI that BLS publishes, new experimental data was recently published regarding inputs to new construction. The data expands existing inputs to industry indexes by incorporating import prices with prices for domestically produced goods and services. With this additional data, users can track how industry input costs are changing among domestically produced products and imported products. This data focuses on new construction, but the complete dataset includes indices across numerous industries, found here.

New Construction input prices are primarily influenced by domestically produced goods and services, with domestic products accounting for 90% of the weight of the industry index for new construction. Imported goods make up the remaining 10% of the index. The latest available data, for March 2025, showed that domestically produced goods have experienced faster price growth compared to imported goods used in new construction. On a year-over-year basis, the index for domestic goods increased 0.8%, while prices for imported inputs fell 2.1% over the same period. Across all inputs to new construction, services prices have risen more than good inputs over the past year, as domestic services prices rose 2.2%. Across the three indexes, all inputs remain at higher levels compared to pre-pandemic prices.

Discover more from Eye On Housing

Subscribe to get the latest posts sent to your email.


This article was originally published by a eyeonhousing.org . Read the Original article here. .


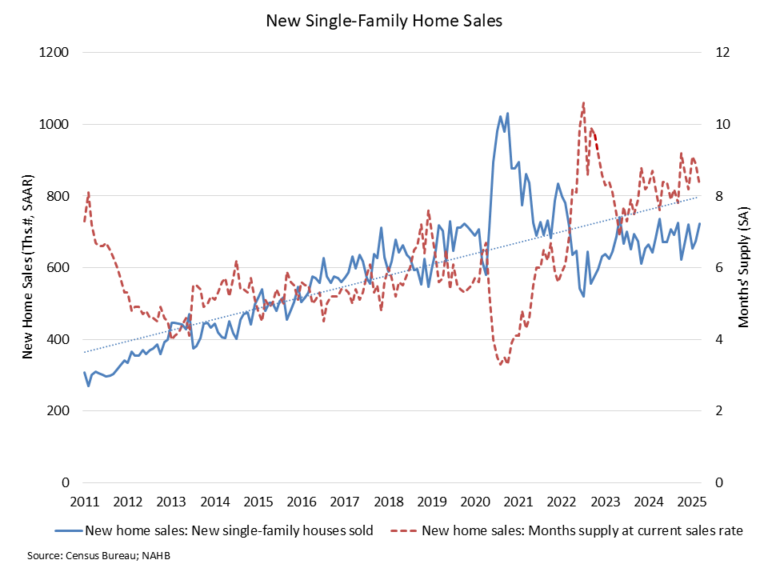
A modest decline in mortgage rates and lean existing inventory helped boost new home sales in March even as builders and consumers contend with uncertain market conditions.

Sales of newly built, single-family homes in March increased 7.4% to a 724,000 seasonally adjusted annual rate from a revised January number, according to newly released data from the U.S. Department of Housing and Urban Development and the U.S. Census Bureau. The pace of new home sales in March was up 6.0% compared to a year earlier.

The March new home sales data shows that demand continues to be present in the market, provided affordability conditions permit a purchase. An increase in economic certainty would be a big boost to future sales conditions. Lower mortgage interest rates helped boost the pace of new home sales in March. In February, the average 30-year fixed rate mortgage was 6.84%, while in March it fell to 6.65%.

A new home sale occurs when a sales contract is signed, or a deposit is accepted. The home can be in any stage of construction: not yet started, under construction or completed. In addition to adjusting for seasonal effects, the March reading of 724,000 units is the number of homes that would sell if this pace continued for the next 12 months.

New single-family home inventory in March continued to rise to a level of 503,000, up 7.9% compared to a year earlier. This represents an 8.3 months’ supply at the current building pace. This level of supply continues to be reasonable given that the resale, single-family months’ supply remains lean at just 3.4. The count of completed, ready-to-occupy homes available for sale increased to 119,000, up 34% from a year ago.

However, the March data also is showing signs that the total amount of inventory in the new construction space has slowed given soft housing conditions at the start of 2025. For example, the count of new homes available for sale that are under construction (263,000 in March) is down 5% year-over-year and 6% lower than the non-seasonally adjusted peak count set in October 2024.

The median new home sale price in March was $403,600, down 7.5% from a year ago. Sales were particularly strong at lower price levels. Compared to March 2024, new homes sales were 33% higher for homes priced below $300,000 and 28% higher for new homes priced between $300,000 and $400,000.

Regionally, on a year-to-date basis, new home sales are up 12.9% in the South, but are down 32% in the Northeast, 18.3% in the Midwest and 6% in the West.

Discover more from Eye On Housing

Subscribe to get the latest posts sent to your email.


This article was originally published by a eyeonhousing.org . Read the Original article here. .

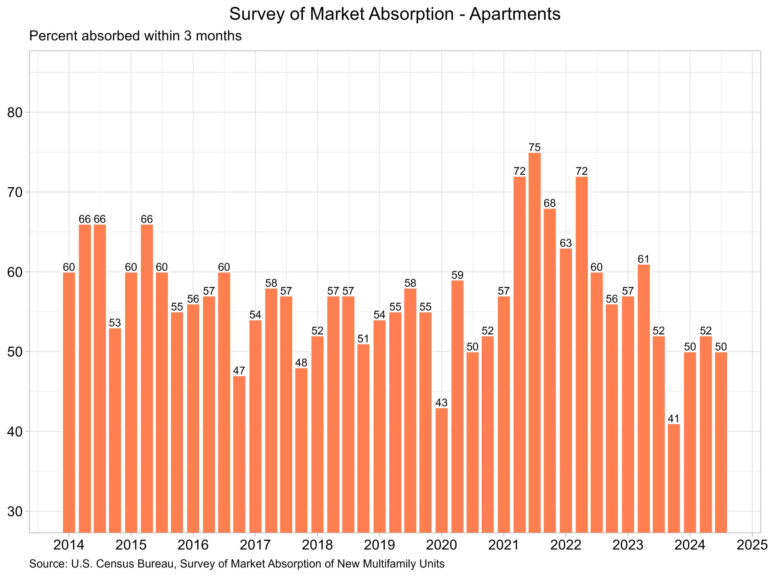
The percentage of new apartment units that were absorbed within three months after completion continued to trend downwards, according to the Census Bureau’s latest release of the Survey of Market Absorption of New Multifamily Units (SOMA). The survey covers new units in multifamily residential buildings with five or more units. The number of new multifamily units completed reached a new peak in the third quarter of 2024, its third straight quarter recording a record high number of completions.

Apartments

The percentage of apartments absorbed within three months has fallen significantly from its peak of 75% in the third quarter of 2021, as shown in the graph above. Currently, the rate stands at 50% which is coupled with an uptick in completions, as the SOMA estimates show a new high of completions at 143,600 units in the third quarter of 2024. This outpaces the level of completions a year ago, which stood at 84,830, by almost 70%. The level of multifamily units reaching completion has only continued to grow since the number of units under construction peaked at over one million in 2023.

Along with the three-month absorption rate and completions, SOMA reports absorption rates within six-months, nine-months, and 12-months of completion. Solely focusing on the 12-month absorption rate, it fell to its lowest level since the start of the pandemic, registering a rate of just 90%. This means that 10% of the 90,630 apartments completed in the fourth quarter of 2023 remain unoccupied. As completions have risen over the past year, the supply of available apartments has increased. Additionally, regional SOMA data points to the Northeast as a possible explanation for a lower 12-month absorption rate, as nearly 23% of the fourth quarter completions in 2023 remain unoccupied. This is well above any other region, with the Midwest at 7%, the South at 9% and the West at 5%.

Condominiums and Cooperative Units

The absorption rate for new condominiums and cooperative units fell to 63% for the quarter, down 1 percentage point from the previous quarter.

Total completions of new condominiums and cooperative units, according to the SOMA, fell over the quarter from 4,452 to 4,008. Quarterly completions of these units peaked in the second quarter of 2018, at 7,996 completions but have steadily fallen since.

Discover more from Eye On Housing

Subscribe to get the latest posts sent to your email.


This article was originally published by a eyeonhousing.org . Read the Original article here. .

Builder sentiment edged higher to begin the year on hopes for an improved economic growth and regulatory environment. At the same time, builders expressed concerns over building material tariffs and costs and a larger government deficit that would put upward pressure on inflation and mortgage rates.

Builder confidence in the market for newly built single-family homes was 47 in January, up one point from December, according to the National Association of Home Builders (NAHB)/Wells Fargo Housing Market Index (HMI).

Builders are facing continued challenges for housing demand in the near-term, with mortgage rates up from near 6.1% in late September to above 6.9% today. Land is expensive and financing for private builders remains costly. However, there is hope that policymakers are taking the impact of regulatory hurdles seriously and will make improvements in 2025.

NAHB is forecasting a slight gain for single-family housing starts in 2025, as the market faces offsetting upside and downside risks from an improving regulatory outlook and ongoing elevated interest rates,. And while ongoing, but slower, easing from the Federal Reserve should help financing for private builders currently squeezed out of some local markets, builders report cancellations are climbing as a direct result of mortgage rates rising back up near 7%.

The latest HMI survey also revealed that 30% of builders cut home prices in January. This share has been stable between 30% and 33% since last July. Meanwhile, the average price reduction was 5% in January, the same rate as in December. The use of sales incentives was 61% in January. This share has remained between 60% and 64% since last June.

Derived from a monthly survey that NAHB has been conducting for more than 35 years, the NAHB/Wells Fargo HMI gauges builder perceptions of current single-family home sales and sales expectations for the next six months as “good,” “fair” or “poor.” The survey also asks builders to rate traffic of prospective buyers as “high to very high,” “average” or “low to very low.” Scores for each component are then used to calculate a seasonally adjusted index where any number over 50 indicates that more builders view conditions as good than poor.

The HMI index gauging current sales conditions rose three points to 51 and the gauge charting traffic of prospective buyers posted a two-point gain to 33. The component measuring sales expectations in the next six months fell six points to 60 because of the elevated interest rate environment. While this serves as a cautionary note, the future sales component is still the highest of the three sub-indices and well above the breakeven level of 50.

Looking at the three-month moving averages for regional HMI scores, the Northeast increased five points to 60, the Midwest moved one point higher to 47, the South posted a one-point gain to 46 and the West fell one point to 40. The HMI tables can be found at nahb.org/hmi.

Discover more from Eye On Housing

Subscribe to get the latest posts sent to your email.


This article was originally published by a eyeonhousing.org . Read the Original article here. .

Mortgage rates climbed in November, driven by market volatility and a surge in Treasury yields following the recent elections. On the day after the election results, the 10-year Treasury yield spiked by 14 basis points (bps), setting the stage for further rate increases throughout the month.

According to Freddie Mac, the average rate for a 30-year fixed-rate mortgage increased 38 basis points from October, reaching 6.81%. Meanwhile, the 15-year fixed-rate mortgage saw an even steeper increase of 43 bps to land at 6.03%.

The 10-year Treasury yield, a key benchmark for mortgage rates, averaged 4.37% in November—38 bps higher than October’s average. This increase reflected heightened market uncertainty and persistent volatility. Looking ahead, the Federal Reserve is set to meet on December 17-18 to evaluate the possibility of another rate cut. Since the federal funds rate influences interest rates, a rate cut could potentially ease long-term mortgage rates, but this decision will hinge on the latest employment and inflation data, and other macroeconomic factors that could have an upward pressure on inflation including larger government deficits and higher tariffs. NAHB forecasts additional declines to the federal funds rate into a range below 4%.

Discover more from Eye On Housing

Subscribe to get the latest posts sent to your email.


This article was originally published by a eyeonhousing.org . Read the Original article here. .

The percentage of new apartment units that were absorbed within three months of completion rose from 50% to 55% in the second quarter of 2024, according to the Census Bureau’s latest release of the Survey of Market Absorption of New Multifamily Units (SOMA). The survey covers new units in multifamily residential buildings with five or more units. Meanwhile, the absorption rate within three months for condominiums and cooperative units fell over the quarter, from 80% to 66%.

Apartments

The percentage of apartments absorbed within three months has fallen significantly from its peak of 75% in the third quarter of 2021, as shown in the graph above. Currently, the rate stands at 55% which is coupled with an uptick in completions, as the SOMA estimates show a new high of completions at 118,600 units in the second quarter of 2024. This is well above the level of completions a year ago, which stood at 83,140. The pace of multifamily units being completed has picked up, as many units under construction over the past year are reaching the market. Since the first quarter of 2022, completions have been above 75,000 for nine consecutive quarters, as seen in the graph below.  The level of completions has also risen for the past three quarters.

Along with the three-month absorption rate and completions, SOMA reports absorption rates within six-months, nine-months, and 12-months of completion. The absorption rates for all time periods follow similar downward trends as the number of apartments completed has ticked upwards over the past two years. For apartments completed in the 1st quarter of 2024, the absorption rate within six months of completion was 75%, down from a peak of 88% in the third quarter of 2021 but up from 69% the previous quarter.

For the nine-month period, the absorption rate of apartments completed in the fourth quarter of 2023 fell to 83% down for the third consecutive quarter. This rate also peaked at 96% in the same quarter as the other periods, the third quarter of 2021.

Finally, apartment units completed in the third quarter of 2023 were 93% absorbed within a year following completion. The trend remains the same for the 12-month period as the other time periods, as it peaked in the third quarter of 2021 at 98%.

Condominiums and Cooperative Units

The absorption rate for new condominiums and cooperative units fell to 66% for the quarter. The previous quarter’s rate was significantly revised, up from 69% to 80%, which helps to explain the dramatic decline.

Total completions of new condominiums and cooperative units, according to the SOMA, rose over the quarter up from 2,829 to 4,366. Quarterly completions of these units peaked in the second quarter of 2018, at 7,996 completions but have steadily fallen since that peak.

Discover more from Eye On Housing

Subscribe to get the latest posts sent to your email.


This article was originally published by a eyeonhousing.org . Read the Original article here. .
Pin It