Tag

Residential

Browsing


Private residential construction spending was up 1.7% in March 2026, following two straight months of declines. The increase was broad-based, with gains in single-family, multifamily construction, and home improvement spending. Moreover, total private residential construction spending was 3.6% higher than a year ago.

According to the latest construction spending data from the U.S. Census, single-family construction spending increased 2.7% in March, consistent with the steady builder confidence reflected in the NAHB/Wells Fargo Housing Market Index (HMI). Despite the monthly gain, single-family construction spending was down 4.2% over a year ago. Meanwhile, multifamily construction spending edged up 0.3% in March. This marks the second monthly increase after two consecutive months of modest declines. Compared to a year earlier, multifamily spending was 0.5% higher. Improvement spending (remodeling) also increased in March, rising 0.9% for the month. Remodeling remained a bright spot on a year-over-year basis, with spending up 14.3% from March 2025.

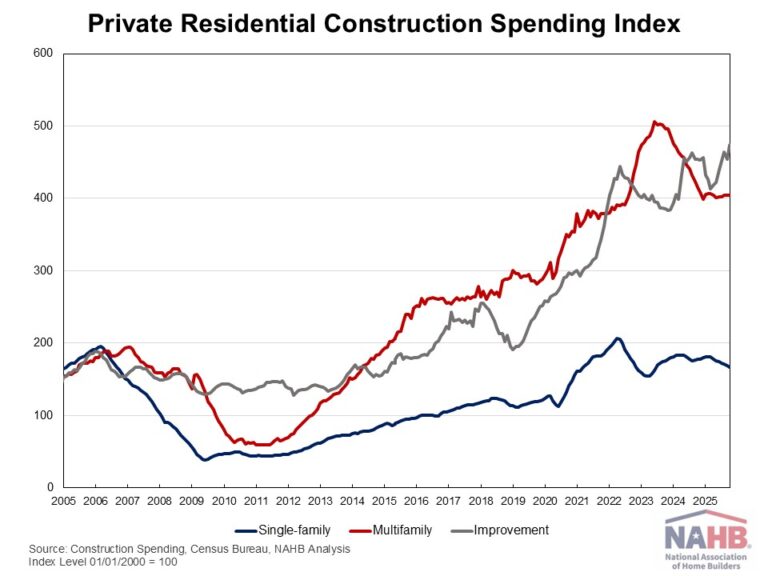
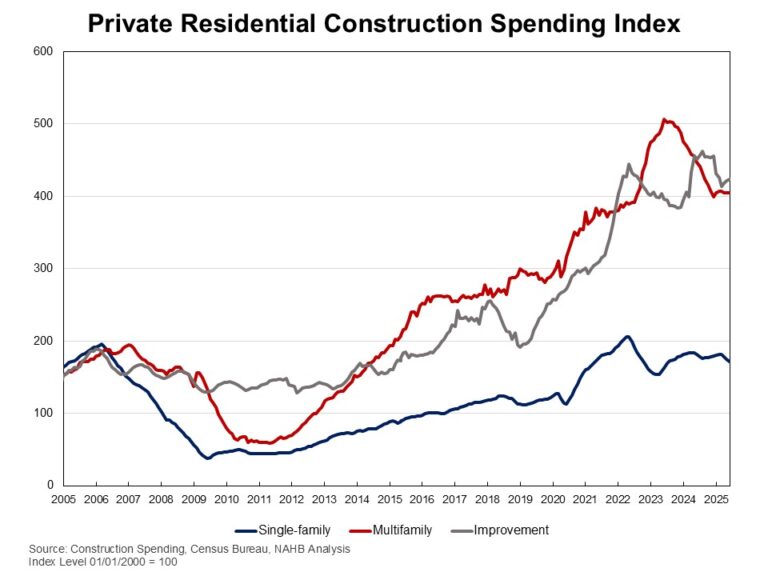
The NAHB construction spending index is shown in the graph below. The index illustrates how spending on single-family construction has slowed since early 2024, reflecting the impacts of elevated interest rates and ongoing uncertainty over building material tariffs. Multifamily construction spending growth has also slowed down after the peak in July 2023, with the index largely plateauing since late 2024. In contrast, improvement spending has been on an upward trend since the beginning of 2025, supported in part by the aging housing stock and sustained demand for renovation.

Spending on private nonresidential construction was down 2.1% over a year ago. The annual private nonresidential spending decrease was driven by a $39 billion drop in manufacturing construction spending.


This article was originally published by a eyeonhousing.org . Read the Original article here. .


Energy input prices increased in March at their fastest pace since June of 2020 as the conflict in Iran shocked critical global supply chains. Building material prices, excluding energy, rose for the eleventh straight month. Price growth for trade services slowed while transportation and warehousing price growth accelerated.  

The Producer Price Index for final demand increased 0.5% in March, after rising 0.5% in February. The index for final demand services was unchanged in March, while the index for final demand goods rose 1.6% over the month.

The price index for inputs to new residential construction rose 1.2% in March and was up 3.8% from last year. The price of goods used in new residential construction was up 1.8% over the month and up 4.3% from last year, while the price of services was up 0.3% over the month and up 3.1% from last year.

Input Goods

The goods component has a larger importance to the inputs to residential construction price index, representing around 60% of the total. On a monthly basis, the price of input goods to new residential construction was up 1.8% in March.

The input goods to residential construction index can be further broken down into two separate components, one measuring energy inputs with the other measuring remaining goods. The latter of these two components simply represents building materials used in residential construction, which makes up around 93% of the goods index.

Energy input prices rose 21.4% in March and were 20.8% higher than one year ago. The monthly increase in March was the largest since prices rose 30.6% in June 2020. Building material prices were up 0.4% in March and up 3.1% compared to one year ago.

Among input goods, the largest year-over-year increase was for No. 2 diesel fuel as prices were 51.2% higher than a year ago. Metal molding and trim continued to show high price increases, as there were up 45.5% from last year. On the opposite end, the largest yearly declines in prices were for particleboard and fiberboard with prices down 15.7%. Notably, asphalt reported a price decline of 12.3% in March. For key inputs, ready-mix concrete prices were 0.5% higher than a year ago while softwood lumber prices were 7.8% lower than a year ago.

Input Services

Prices for service inputs to residential construction reported an increase of 0.3% in March. On a year-over-year basis, service input prices were up 3.1%. The price index for service inputs to residential construction can be broken out into three separate components: a trade services component, a transportation and warehousing services component, and a services excluding trade, transportation, and warehousing component (other services).

The most significant component is trade services (around 60%), followed by other services (around 29%), and finally transportation and warehousing services (around 11%). The largest component, trade services, was up 3.3% from a year ago. The price of transportation and warehousing services rose 6.2%, while prices for other services were up 1.5% over the year.

Expanded Inputs to New Construction Data

Within the PPI that BLS publishes, new experimental data was recently published regarding inputs to new construction. The data expands existing inputs to industry indexes by incorporating import prices with prices for domestically produced goods and services. With this additional data, users can track how industry input costs are changing among domestically produced products and imported products. This data focuses on new construction, but the complete dataset includes indices across numerous industries that can be found here on BLS website.

New construction input prices are primarily influenced by domestically produced goods and services, with domestic products accounting for 90% of the weight of the industry index for new construction. Imported goods make up the remaining 10% of the index.

The latest available data, for January 2026, showed that domestically produced goods continue to show price growth compared to imported goods used in new construction. On a year-over-year basis, the index for domestic goods increased 2.6%, while prices for imported goods have fallen 2.7%.


This article was originally published by a eyeonhousing.org . Read the Original article here. .


Private residential construction spending declined 0.8% in January 2026, following two months of gains. This decline was driven by lower spending across single-family, multifamily construction, and home improvement.  Despite the monthly decline, total residential construction spending remained 2.3% higher than a year ago.

According to the latest construction spending data from the U.S. Census, single-family construction spending edged down by 0.2% in January, consistent with the softer builder confidence reflected in the NAHB/Wells Fargo Housing Market Index (HMI). Compared to a year ago, single-family construction spending was down 5.8%. Meanwhile, multifamily construction spending also decreased mildly, falling 0.7% in January. This marks the second monthly decrease following six consecutive months of modest gains. Compared to a year earlier, multifamily spending was 0.4% higher. Improvement spending (remodeling) declined 1.4% for the month but remained a bright spot on a year-over-year basis, rising 12.5%.

The NAHB construction spending index is shown in the graph below. The index illustrates how   spending on single-family construction has slowed since early 2024, reflecting the impacts of elevated interest rates and ongoing uncertainty over building material tariffs. Multifamily construction spending growth has also slowed down after the peak in July 2023, with the index largely plateauing since late 2024. In contrast, improvement spending has been on an upward trend since the beginning of 2025, supported in part by the aging housing stock and sustained demand for renovation.

Spending on private nonresidential construction was down 3% over a year ago. The annual private nonresidential spending decrease was primarily driven by a $35 billion drop in manufacturing construction spending, followed by a $0.8 billion decrease in commercial construction spending.


This article was originally published by a eyeonhousing.org . Read the Original article here. .


Private residential construction spending was up 1.5% for the last month of 2025. This modest gain was driven primarily by increased spending on home improvements and single-family construction. Despite this increase, total spending remained 1.3% lower than a year ago, reflecting the continued impact of housing affordability challenges facing the sector.

According to the latest construction spending data from the U.S. Census, single-family construction spending was up by 1.6% in December, consistent with the soft builder confidence reflected in the NAHB/Wells Fargo Housing Market Index (HMI). Compared to a year ago, single-family construction spending decreased 3.6%. Meanwhile, multifamily construction spending edged up 0.1% in December, marking a seventh consecutive month of modest gains. Compared to a year earlier, multifamily spending was 2.9% higher. Improvement spending (remodeling) rose 1.8% for the month but stayed flat relative to a year ago.

The NAHB construction spending index is shown in the graph below. The index illustrates how   spending on single-family construction has slowed since early 2024 under the pressure of elevated interest rates and concerns over building material tariffs. Multifamily construction spending growth has also slowed down after the peak in July 2023, with the index largely plateauing since late 2024. In contrast, improvement spending has been on an upward trend since the beginning of 2025.

Spending on private nonresidential construction was down 1.8% over a year ago. The annual private nonresidential spending decrease was primarily driven by a $26 billion drop in manufacturing construction spending, followed by a $2 billion decrease in healthcare construction spending.


This article was originally published by a eyeonhousing.org . Read the Original article here. .


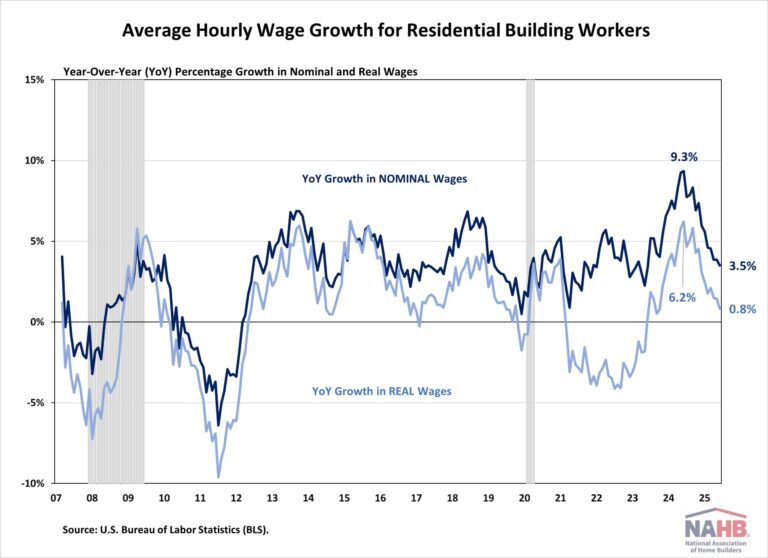
Wage growth for residential building workers moderated notably in 2025, reflecting a broader cooling in housing activity and construction labor demand. According to the latest data from the U.S. Bureau of Labor Statistics (BLS), both nominal and real wages remained modest during the fourth quarter, signaling a shift from the rapid post-pandemic expansion to a slower-growth phase.

In nominal terms, average hourly earnings (AHE) for residential building workers rose to $39.63 in December 2025, up 3.3% from $38.37 a year ago. While this marked a modest acceleration from November’s 2.0% year-over-year gain, wage growth has slowed considerably from the peak of 9.4% recorded in June 2024. Elevated mortgage rates, ongoing affordability challenges, and persistently high construction costs constrained home building activity over the past year. As a result, labor demand eased accordingly. Meanwhile, the number of open, and unfilled construction sector jobs continued to trend downward, consistent with the overall slowdown in housing activity.

Despite the slowdown in wage growth, residential building workers’ wages remain competitive relative to other industries:

9.9% higher than the manufacturing sector ($36.07 per hour)

23.3% higher than the transportation and warehousing sector ($32.14 per hour)

2.6% lower than the mining and logging sector ($40.69 per hour)

Note:

Data used in this post relate to all employees in the residential building industry. This group includes both new single-family housing construction (excluding for-sale builders) and residential remodelers but does not include specialty trade contractors.


This article was originally published by a eyeonhousing.org . Read the Original article here. .


Lending standards for most types of residential mortgages were essentially unchanged but overall demand was weaker in the fourth quarter of 2025, according to the recent release of the Senior Loan Officer Opinion Survey (SLOOS). However, for commercial real estate (CRE) loans, lending standards for multifamily were looser, while standards for construction & development were essentially unchanged. Demand for construction & development loans was stronger, while demand for multifamily loans was essentially unchanged for the quarter. 

After three consecutive 25 basis point cuts to finish 2025, the Federal Reserve decided to maintain its key short-term interest rate (i.e., Federal Funds) unchanged during its first meeting of 2026. Participants on the Federal Open Market Committee (FOMC) continue to assess how to weigh the components of its dual mandate, as inflation continues to be above the stated target of 2% (i.e., the case for higher rates) while the economy is experiencing further deceleration in job growth (i.e., the case for lower rates). Given the current macroeconomic landscape and a change in leadership at the Fed as Jerome Powell’s term as Chair ends in May, NAHB anticipates that any further rate cuts will occur in the latter half of this year.

Residential Mortgages

In the fourth quarter of 2025, three of seven residential mortgage loan categories; GSE-eligible, Qualified Mortgage (QM) non-jumbo non-GSE eligible, and Government, saw a positive net easing index for lending conditions with an additional two (non-QM non-jumbo and QM jumbo) recording a neutral reading (i.e., 0). Subprime and non-QM jumbo loans experienced tighter lending conditions, as evidenced by a negative value, -8.3 and -4.2 respectively.

All seven residential mortgage loan categories reported weaker demand in the fourth quarter of 2025, with the weakest demand coming from subprime loans. This category has experienced weaker demand for 22 consecutive quarters.

Commercial Real Estate (CRE) Loans

For the CRE loan categories, multifamily registered a net easing index of +5.5 for the fourth quarter of 2025, indicating looser credit conditions for the first time since Q1 2022. As a reminder, this was when the Federal Reserve began their aggressive rate hiking path, which saw the Federal Funds rate increase by 525 basis points over a year and a half period. For construction & development loans, the net easing index was -1.8, or essentially unchanged.

The net percentage of banks reporting stronger demand was 8.9% for construction & development loans, with a positive number indicating stronger demand. This is the first time construction & development has been positive since Q4 2021. For multifamily loans, demand was -1.9% in the fourth quarter of 2025, which is essentially unchanged according to the Fed’s classification scheme (i.e., between -5.0% and +5.0%).


This article was originally published by a eyeonhousing.org . Read the Original article here. .


Private residential construction spending was up 1.3% in October, rebounding from a 1.4% decline in September 2025. This modest gain was primarily driven by increased spending on home improvements. Despite this increase, total spending remained 1.3% lower than a year ago, as the housing sector continues to navigate the economic uncertainty stemming from ongoing tariff concerns and elevated mortgage rates.

According to the latest U.S. Census construction spending data, single-family construction spending declined 1.3% in October, consistent with the soft builder confidence reflected in the NAHB/Wells Fargo Housing Market Index (HMI). Compared to a year ago, single-family construction spending decreased by 6.1%. Meanwhile, multifamily construction spending edged down 0.2% in October after four consecutive months of modest gains. Compared to a year earlier, multifamily spending was still down 2.8%. Improvement spending (remodeling) rose 4.5% for the month and was up 4.4% compared to a year ago.

The NAHB construction spending index is shown in the graph below. The index illustrates how   spending on single-family construction has slowed since early 2024 under the pressure of elevated interest rates and concerns over building material tariffs. Multifamily construction spending growth has also slowed down after the peak in July 2023, with the index largely plateauing since late 2024. In contrast, improvement spending has been on an upward trend since the beginning of 2025.

Spending on private nonresidential construction was down 2.6% over a year ago. The annual private nonresidential spending decrease was primarily driven by a $23 billion drop in manufacturing construction spending, followed by a $3.8 billion decrease in commercial construction spending.


This article was originally published by a eyeonhousing.org . Read the Original article here. .


The latest residential housing market report, delayed by the federal government shutdown last fall, indicates that builders have faced significant headwinds in recent months. Elevated mortgage rates earlier in the year have restrained buyer demand and weighed on home building activity, alongside persistently high construction costs.

Overall housing starts declined 4.6 percent in October to a seasonally adjusted annual rate of 1.25 million units, according to the U.S. Department of Housing and Urban Development and the U.S. Census Bureau. This pace reflects the number of housing units builders would begin over the next 12 months if October’s activity were sustained.

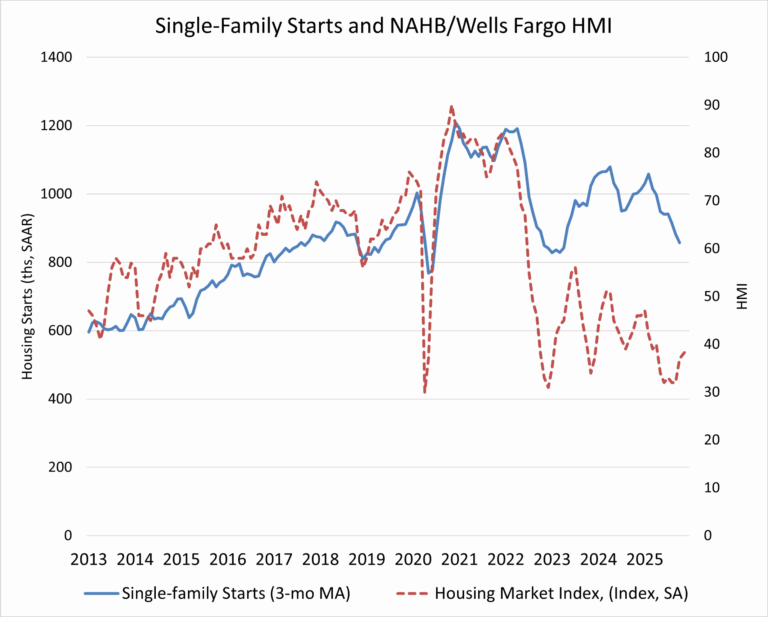
Within the total, single-family starts rose 5.4 percent to a seasonally adjusted annual rate of 874,000 units but remain 7.8 percent lower than a year earlier. On a year-to-date basis, single-family starts are down 7.0 percent. Given recent volatility, the three-month moving average provides a clearer signal, declining to 857,000 units.

In contrast, multifamily starts, which include apartment buildings and condominiums, fell sharply, down 22.0 percent to an annualized pace of 372,000 units. The three-month moving average for multifamily construction has trended lower to 424,000 units, and activity is 7.9 percent below year-ago levels.

Regionally and on a year-to-date basis, combined single-family and multifamily starts increased 9.1 percent in the Midwest and 8.5 percent in the Northeast, while declining 1.9 percent in the West and 4.1 percent in the South.

The total number of housing units under construction stood at 1.3 million in October, down 10.1 percent from a year earlier. Single-family homes under construction fell to 596,000 units, a 7.0 percent year-over-year decline and the lowest level since November 2020. Multifamily units under construction declined to 790,000, down from peaks above 1 million units in December 2023 and 4.0 percent lower than a year ago.

Completions of single-family homes remained relatively strong at an annual rate of about 1 million units, reflecting continued progress in finishing projects already underway and marking a 2.0 percent increase from a year earlier. Multifamily completions, however, dropped sharply, down 41.7 percent year over year to a 377,000-unit pace. On a year-to-date basis, total completions across both sectors are down 9.2 percent.

Overall building permits edged down 0.2 percent in October to a 1.41-million-unit annualized rate. Single-family permits declined 0.5 percent to 876,000 units and are 9.4 percent lower than a year ago, with year-to-date permits down 7.0 percent. Multifamily permits were essentially unchanged at a 536,000-unit pace compared to the previous month and are up 16.3 percent compared to October 2024. Regionally, year-to-date total permits increased 5.9 percent in the Midwest, while declining 3.3 percent in the West, 4.0 percent in the South, and 9.3 percent in the Northeast.


This article was originally published by a eyeonhousing.org . Read the Original article here. .


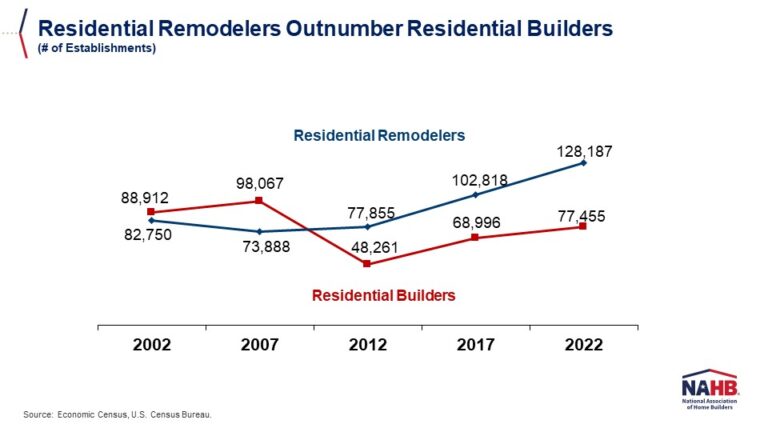
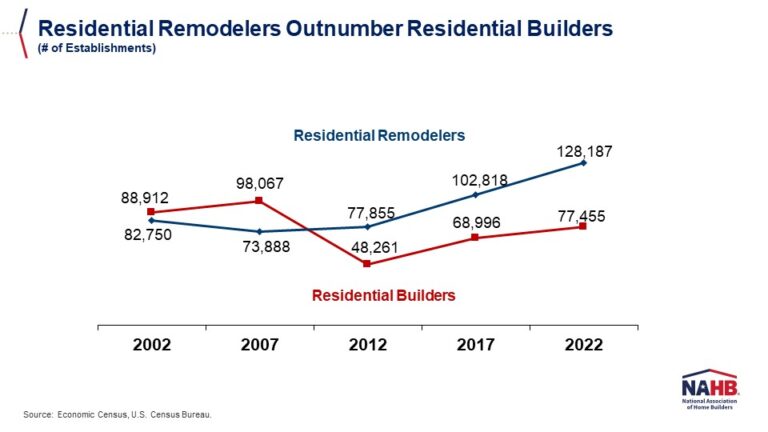
The number of residential remodelers in the U.S. has reached a record high of 128,187 establishments, 65% higher than the number of residential builders (single-family and multifamily), which stands at 77,455.  These official government counts were released by the U.S. Census Bureau as part of its 2022 Economic Census, which tallies American businesses every five years (in years ending in 2 and 7).

Growth in the number of remodelers significantly outpaced that of builders between 2017 and 2022. In that 5-year span, the remodeler count increased by 25% (102,818 to 128,187), while the number of builders grew at half that pace–by 12% (68,996 to 77,455).

A starker dichotomy emerges when comparing 2022 counts to those in 2007, prior to the financial crisis and the ensuing housing recession.  In that 15-year period, the official number of residential remodelers in the U.S. grew by 73% (73,888 to 128,187), while the official number of residential builders contracted by 21% (98,067 to 77,455).

Another way to analyze this data is by creating a combined universe of both builders and remodelers and then calculating each group’s share of the total. In 2022, for example, remodelers represented 62% of the total number of builders and remodelers in the U.S, while builders made up a minority share of 38%.  Remodelers have accounted for at least 60% of this total in the last three Economic Census (2012, 2017, and 2022). 

The last time builders comprised a majority share was in 2007, when they represented 57% of the combined total number of builders and remodelers in the country.


This article was originally published by a eyeonhousing.org . Read the Original article here. .


Private residential construction spending inched up 0.8% in August, continuing steady growth since June 2025. This modest increase was primarily driven by more spending on multifamily construction and home improvements. However, total spending was 2% lower than a year ago, as the housing sector continues to navigate the economic uncertainty stemming from ongoing tariff concerns and elevated mortgage rates. 

According to the latest U.S. Census construction spending data, single-family construction spending slipped 0.4% in August, in line with the soft builder sentiment reflected in the August NAHB/Wells Fargo Housing Market Index (HMI). Compared to a year ago, single-family construction spending decreased by 1.1%. Improvement spending (remodeling) posted a solid 8.2% gain for the month, but it remained 1.3% lower than in August 2024. The remodeling sector continues to show resilience, supported by strong homeowner equity and persistent demand for home improvements. Meanwhile, multifamily construction spending rose 0.2% in August, marking a pause in the downward trend that began in mid-2023. Compared to a year earlier, multifamily spending was down 7.1%.  

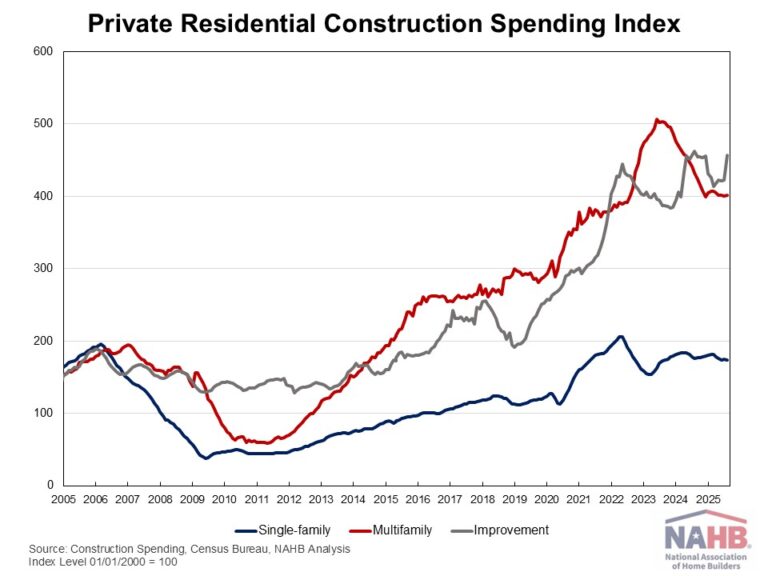
The NAHB construction spending index is shown in the graph below. The index illustrates how   spending on single-family construction has slowed since early 2024 under the pressure of elevated interest rates and concerns over building material tariffs. Multifamily construction spending growth has also slowed down after the peak in July 2023. Improvement spending has also been weakening since the beginning of 2025. 

Spending on private nonresidential construction was down 4% over a year ago. The annual private nonresidential spending decrease was primarily driven by a $20 billion drop in manufacturing construction spending, followed by a $11 billion decrease in commercial construction spending.


This article was originally published by a eyeonhousing.org . Read the Original article here. .

Pin It