Residential remodeling is an important and growing sector of the housing market, particularly as elevated mortgage rates and limited housing inventory encourage many homeowners to improve their existing homes rather than move. Moreover, the aging housing stock and persistent housing inadequacy issue continue to drive growing demands for home improvements.
In 2024, homeowners spent around $670 billion on home remodeling projects. Roughly 20 million households, representing 23% of all owner-occupied households, reported remodeling expenditures during the year. Using data from the Consumer Expenditure Survey (CES), this analysis examines how remodeling expenditures vary across household characteristics, including household type, householder age, generational cohort, and household income. Remodeling expenditures in this analysis include three major categories of home improvement projects: additions, alterations, and replacements.
Household Types
Married-couple households accounted for the majority of remodeling activity in 2024, both in the number of households reporting projects and the highest amount of spending. Around 60% of all households that reported a remodeling project were married couple households, equating to 12 million households spending a combined $458 billion.
More specifically, married couple households with children make up over a third (37.3%) of the total share of remodeling expenditures. Married couples with children ages 6-17 spend the most per remodeling household annually compared to other married couples, averaging $43,330. These households are often in their prime earning years and might improve their homes to meet the needs of their growing families through projects like kitchen and bathroom upgrades, additional bathrooms, or finished basements. This is evident as this group spends more on addition projects than any other household type, with an average expenditure of $159,187.
Married couples without children also make up a significant share of the total remodeling expenditure, representing 36.6%. Nearly 5.9 million married couple households undertook remodeling projects and spent around $208 billion on improvements in 2024.
In contrast, single-parent households made up less than 2% of total remodeling spending and spent less per remodeling household. Male single-parents spent slightly more than female single parents, averaging $25,904 compared to $19,542. Single-consumer households represented a much larger share of total remodeling expenditures at 14%, averaging $24,286 per remodeling household annually. However, only 19% reported remodeling expenditures in 2024, the lowest remodeling participation rate among all household groups.
Other husband-wife households, which likely include multigenerational and more complex household arrangements, made up just 6% of total expenditures. However, among households reporting remodeling projects, they spent an average of $43,347 annually, the highest across all household types. The larger household size and more complex living arrangements in these households may increase the demand for expanded living space to accommodate extended family members. As a result, these households spent an average of $131,173 on addition projects in 2024.
Age Group
Remodeling expenditures change substantially across age groups and generally follow a life-cycle pattern with two notable peaks: Homeowners aged 35-44 and 55-64. These two groups reported the highest remodeling expenditure. Households aged 35-44 spent an average of $42,400 among those who remodeled in 2024, while households aged 55-64 averaged roughly $40,300. The first peak is consistent with family formation, as the median age of first-time home buyers is 38 years old. The second peak among homeowners aged 55-64 may reflect pre-retirement remodeling, including long-term home modernization, or aging-in-place preparations.
Participation rates were also relatively high among homeowners aged 45-54 and 55-64 groups, at around 24%. In contrast, homeowners aged 85 and older reported both the lowest participation rate, at 18%, and the lowest remodeling expenditures overall.
Generational Group
It is also worthwhile to look at how remodeling activities vary across generational cohorts. Among generational groups, Baby Boomers took up the largest share of total remodeling expenditures, spending around $254 billion in 2024, around 38% of all remodeling expenditures. This reflects not only the larger size of the Baby Boomer homeowner household number and their relatively higher remodeling participation rate (24%), but also the greater home equity accumulated by this generation over time, which may increase the financial capacity to do home improvement projects. Gen X households followed Baby Boomer group closely, with more than $207 billion spent on remodeling projects in 2024. Many Gen X homeowners at their peak earning years and have higher homeownership rates, supporting continued investment in long-term home upgrades and improvements.
Among all homeowners who remodel their homes in 2024, Millennials reported the highest average spending at around $36,300, followed by Gen X ($33,700). It was likely supported by rising homeownership and first-time home buying. Millennials also spent relatively more on additions, with average expenditure on additions exceeding $160,000. These patterns largely reflect the needs of growing families, and/or remote work.
By comparison, Gen Z and Silent Generation households reported low remodeling participation rates and smaller expenditures overall, reflecting the earlier and later stages of the homeownership life cycle. Only 21% of Gen Z homeowners and 18% of Silent Generation undertook remodeling projects in 2024. As a result, their shares of total remodeling expenditure remained relatively small, accounting for around 1.8% and 5.1% of the remodeling market, respectively.
Household Income
Remodeling expenditures rise substantially with household income. Around 40% of total remodeling spending came from homeowners earning $200,000 or more. Higher-income households were more likely to remodel and spent substantially more when they did. Nearly 29% of households with $200,000 or more income had home improvement projects in 2024, compared to only 18% among households earning less than $50,000. Among households who reported remodeling projects, households earning $200,000 or more spent nearly $61,000 on average in 2024, which was more than three times the average spending of households with less than $50,000 income.
These findings highlight how remodeling activity varies across household composition, age, generation, and income. Married-couple households, middle-aged homeowners, and higher-income households remain the primary contributors to remodeling demand as homeowners improve and upgrade their existing homes to meet their changing family and lifestyle needs.
Average Remodeling Spending Across All Homeowner Households
It is also important to examine average remodeling expenditures across all homeowner households, not just among those reporting remodeling projects. Measuring expenditures among all homeowner households captures both the prevalence and intensity of remodeling activity, providing a broader view of the market’s overall economic impact. By including households with no remodeling spending, the dashboard below shows how average spending varies across different household characteristics, like household type, age, generation, and income.


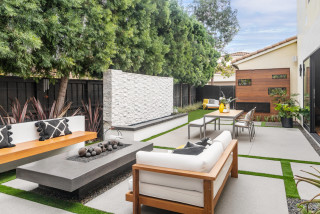


Lounge areas are now a defining feature of outdoor spaces, included in 83% of redesigns in 2026. These areas most commonly feature sofas or lounge chairs (71%), outdoor lighting (66%), coffee or side tables (55%) and fireplaces or fire pits (48%). Entertainment elements such as TVs or sound systems appear in 22% of lounge areas, while 13% include a bar or beverage refrigerator.
Dining areas are also popular, included in 55% of outdoor spaces. Nearly all feature a dining table or seating (90%), and many layer in additional comfort, including sofas or lounge chairs (68%) and coffee or side tables (50%). Lighting is included in 66% of dining spaces, and 49% feature a fireplace or fire pit. Functional additions such as grills (56%) and beverage refrigerators or bars (16%) support outdoor entertaining.
Dedicated reading areas or quiet retreats are present in 53% of renovated outdoor spaces, with comfort leading the design. Most include sofas, sectionals or lounge chairs (74%), along with lighting (66%) and coffee or side tables (55%). Fire features appear in 45% of these spaces, while smaller shares include beverage refrigeration (11%), outdoor showers (5%) or even treehouses (2%).
Nearly half of homeowners (49%) include dedicated gardening areas. These are most often defined by beds or borders (74%) and supported with lighting (64%). Storage or cabinetry is included in 30% of gardening zones, helping keep tools and materials organized.
3 Outdoor Retreats Designed for Comfort and Accessibility