Tag

Remains

Browsing


In the first quarter of 2026, the NAHB/Westlake Royal Remodeling Market Index (RMI) posted a reading of 62, down two points compared to the previous quarter. Despite this decline, the overall reading has been solidly in positive territory since Q1 2020.

Remodeler sentiment remained generally positive in the first quarter, even as many remodelers are still working to manage their customers’ cost expectations. Only a relatively small share report homeowners putting projects on hold due to economic and political uncertainty.

Ongoing positive remodeler sentiment is consistent with NAHB’s outlook, given an aging housing stock and the lock-in effect of elevated mortgage rates keeping owners in the homes longer. In the first quarter, remodelers reported 21% of their projects were associated with home improvements made shortly after a purchase, while only 4% were for homeowners’ projected to ready a home for sale.

The RMI is based on a survey that asks remodelers to rate various aspects of the residential remodeling market “good”, “fair” or “poor.” Responses from each question are converted to an index that lies on a scale from 0 to 100. An index number above 50 indicates a higher proportion of respondents view conditions as good rather than poor.

Current Conditions

The Remodeling Market Index (RMI) is an average of two major component indices: the Current Conditions Index and the Future Indicators Index. 

The Current Conditions Index is an average of three components: the current market for large remodeling projects ($50,000 or more), moderately-sized projects ($20,000 to $49,999), and small projects (under $20,000). In the first quarter of 2026, the Current Conditions Index averaged 70, edging down one point from the previous quarter. All three components remained well above 50 in positive territory. The component measuring small remodeling projects was the only one to experience a quarterly gain, inching up one point to 74. Both the moderate and large remodeling projects components were down two points to 69 and 67, respectively.

Future Indicators

The Future Indicators Index is an average of two components: the current rate at which leads and inquiries are coming in, and the current backlog of remodeling projects. 

In the first quarter of 2026, the Future Indicators Index averaged 54, down two points from the previous quarter. Both components decreased quarter-over-quarter but are above the break-even point of 50. The component measuring the current rate at which leads and inquiries are coming in edged down one point to 53, while the component measuring backlog of remodeling jobs dropped three points to 58.

For the full set of RMI tables, including regional indices and a complete history for each RMI component, please visit NAHB’s RMI web page.


This article was originally published by a eyeonhousing.org . Read the Original article here. .

Residential demolition activity in 2025 declined 0.1% year-over-year but remained above pre-pandemic levels. According to NAHB analysis of data from Construction Monitor, permits pulled for residential demolition have been increasing since 2018, with the exception of 2020, when building-related activities broadly stalled. Demolition activity rebounded sharply in 2021 and 2022 but has since plateaued. Even with the recent stall, demolition permits in 2025 were still 34.2% higher than in 2018, underscoring the extent to which activity remains elevated relative to pre-pandemic norms.

While the data do not differentiate between partial or full demolitions, teardowns are often an indicator of redevelopment and neighborhood reinvestment, and thus, signals future construction. Previous NAHB survey analysis indicated that teardown-related construction projects made up approximately 7% of single-family starts in 2024.

At the state level, demolition activity is highly concentrated, with California, Texas, and Florida—the three most populous states—usually leading the nation in demolition permits. However, from 2023 through 2025, New Jersey ranked third in total demolition permits, surpassing Texas. New Jersey’s elevated demolition activity reflects the age of its housing stock. Approximately 73% of homes in the state were built before 1980, out of which 18% were built before 1939, leaving many properties functionally obsolete or in need of replacement. In response, several municipalities have pursued targeted redevelopment and blight reduction initiatives. For example, Trenton, the capital city, launched one of its largest blight reduction projects in 2023, aimed at revitalizing distressed neighborhoods and expanding the supply of quality housing.

In 2025, New Jersey accounted for approximately 10.4% of all residential demolition permits nationwide. Florida recorded the largest share at 14.6%, followed by California at 13.3%. Texas remained a significant contributor at 7.2%, while New York ranked fifth with about 4.1% of total activity. Collectively, the top five states accounted for nearly half of all residential demolition permits issued in 2025, highlighting the high degree of geographic concentration at the state level.

At a smaller geographic scale, the year-to-year variability is substantially higher. To account for this volatility, examining cumulative demolition permitting since 2018 provides insight into where demolition activity has been persistently concentrated over the current cycle. On this basis, Los Angeles County, CA accounted for the largest share of cumulative demolition permits (4.8%), followed by Harris County, TX (3.1%), Cuyahoga County, OH (2.6%), King County, WA (2.0%), and Miami-Dade County, FL (1.8%). Together, these five counties accounted for nearly 15% of all demolition activity nationwide over the period.


This article was originally published by a eyeonhousing.org . Read the Original article here. .

Residential building material price growth accelerated in February after slowing a month prior, according to the latest Producer Price Index release from the Bureau of Labor Statistics. Since the BLS collects pricing data during the week of the 13th, these figures were finalized before the onset of the conflict in Iran.

The Producer Price Index for final demand increased 0.7% in February, after rising 0.5% in January. The index for final demand services rose 0.5% in February, while the index for final demand goods rose 1.1% over the month. The monthly increase in the index for final demand goods was the largest since it rose 1.6% back in August of 2023.

The price index for inputs to new residential construction rose 0.7% in February and was up 3.4% from last year. The price of goods used in new residential construction was up 1.1% over the month and 3.0% from last year, while the price of services was up 0.1% over the month and up 4.2% from last year.

Input Goods

The goods component has a larger importance to the inputs to residential construction price index, representing around 60%. On a monthly basis, the price of input goods to new residential construction was up 1.1% in February. The last time this index increased over 1.0% on a monthly basis was January of 2025.

The input goods to residential construction index can be further broken down into two separate components, one measuring energy inputs with the other measuring remaining goods. The latter of these two components simply represents building materials used in residential construction, which makes up around 93% of the goods index.

Energy input prices rose 9.3% in February but were 3.5% lower than one year ago. Building material prices were up 0.6% in February and up 3.5% compared to one year ago.

The largest year-over-year price increases continue to show in metal products with the largest being for metal molding and trim, as prices are now up 61.7% from a year ago. Metal windows price growth has continued to accelerate with prices up 20.2% from last year. Across all metals and metal products, prices are up 16.6% from last year. Yearly price declines were prevalent among energy products, due to the timing of the survey. For building materials, particleboard and fiberboard prices were down 17.4%, while softwood veneer and plywood prices were down 4.0%.

Input Services

Prices for service inputs to residential construction reported an increase of 0.1% in February. On a year-over-year basis, service input prices were up 4.2%. The price index for service inputs to residential construction can be broken out into three separate components: a trade services component, a transportation and warehousing services component, and a services excluding trade, transportation, and warehousing component (other services).

The most significant component is trade services (around 60%), followed by other services (around 29%), and finally transportation and warehousing services (around 11%). The largest component, trade services, was up 5.8% from a year ago. The transportation and warehousing services rose 3.0%, while prices for other services were up 1.3% over the year.

Expanded Inputs to New Construction Data

Within the PPI that BLS publishes, new experimental data was recently published regarding inputs to new construction. The data expands existing inputs to industry indexes by incorporating import prices with prices for domestically produced goods and services. With this additional data, users can track how industry input costs are changing among domestically produced products and imported products. This data focuses on new construction, but the complete dataset includes indices across numerous industries that can be found here on BLS website.

New construction input prices are primarily influenced by domestically produced goods and services, with domestic products accounting for 90% of the weight of the industry index for new construction. Imported goods make up the remaining 10% of the index.

The latest available data, for December 2025, showed that domestically produced goods continue to show price growth compared to imported goods used in new construction. On a year-over-year basis, the index for domestic goods increased 3.0%, while prices for imported goods have fallen 3.2%.


This article was originally published by a eyeonhousing.org . Read the Original article here. .


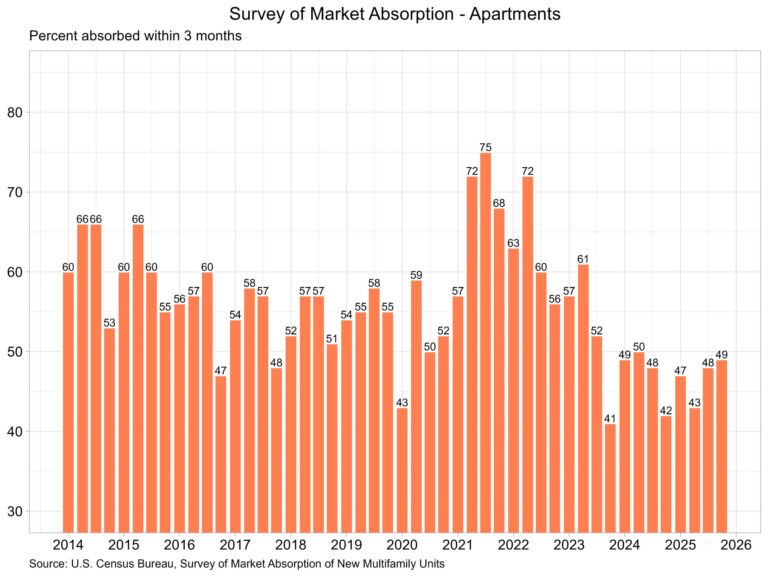
The percentage of new apartment units that were absorbed within three months after completion was unchanged for new units completed in the second quarter, according to the Census Bureau’s latest release of the Survey of Market Absorption of New Multifamily Units (SOMA). The survey covers new units in multifamily residential buildings with five or more units. The number of new multifamily units completed rose marginally in the second quarter and remained above 90,000 units for the seventh consecutive quarter.

Apartments

The percentage of apartments absorbed within three months has remained below 50% for four straight quarters. The SOMA data has never featured more than two consecutive quarters with under 50% absorption rates. Currently, the rate stands at 47%, meaning that 47% of the 93,680 units completed in the second quarter were rented within three months of completion. The median asking rent in the second quarter was $1,860, up 5.3% from $1,766 last year. The SOMA data has also displayed two quarters of median rent declines, as the asking rent has fallen from $1,941 for completions in the fourth quarter of 2024.

Along with the three-month absorption rate and completions, SOMA also reports absorption rates at six, nine, and twelve months after completion. For apartments completed six months ago (93,400 units), 70% have been absorbed into the market. Of the 125,100 apartments completed nine months ago, 85% have been absorbed. For those completed twelve months ago (142,700 units), 91% were absorbed into the multifamily market.

Condominiums and Cooperative Units

The three-month absorption rate for new condominiums and cooperative units rose to 69%. Total completions of new condominiums and cooperative units, according to SOMA, doubled in the second quarter from 2,551 to 5,167.


This article was originally published by a eyeonhousing.org . Read the Original article here. .

At the conclusion of its July meeting, the Federal Reserve’s monetary policy committee once again held the federal funds rate constant at a top rate of 4.5%. However, two members of the committee dissented from the decision (Fed Board Governors Waller and Bowman), the largest number of dissenting votes since 1993.

Moreover, some economic data – including a slowing housing market – are pointing to a need to resume normalizing the federal funds rate from its current, restrictive stance. In particular, Chair Powell noted in his press conference that the “housing market remains weak” and policy is “modestly restrictive.” NAHB is forecasting two rate reductions before the end of the year, including one at the next Fed meeting in September. President Trump has made it clear that he believes the central bank needs to cut again. All that said, except for the presence of dissenting votes in today’s decision, the Fed’s statement did not appear to be more dovish than those of prior months, which is indicative that the Fed remains data dependent.

While the Fed pointed to moderating growth, including a soft first quarter, “elevated uncertainty” about the outlook continues to be cited by the central bank. It is the case that evolving tariff policy, and trade negotiations in general, represent an uncertainty risk (although some, like Governor Waller, argue that tariff effects will represent a one-time effect on prices, not a source of ongoing inflation).

However, the combination of a quick move for cuts at the end of 2024 and the subsequent long, ongoing pause in 2025 is itself a source of uncertainty, particularly for businesses in sectors like residential construction whose financing costs are tied to short-term lending rates controlled by the Federal Reserve. The continued decline for service sector inflation points to moderating overall inflation, which when combined with softening job openings data and growing specifics about trade policy, provides justification for a resumption of continued monetary policy easing.

While a reduction in the federal funds rate would help the supply-side of the housing market via builder financing costs, long-term rates like mortgage interest rates are determined by investors and the bond market, not the Fed. So, while the economy would benefit from a resumption of monetary policy easing, impactful reductions for long-term interest rates depends on declines for inflation expectations, improvement of the government’s deficit outlook, and gains for productivity for the economy.

Discover more from Eye On Housing

Subscribe to get the latest posts sent to your email.


This article was originally published by a eyeonhousing.org . Read the Original article here. .
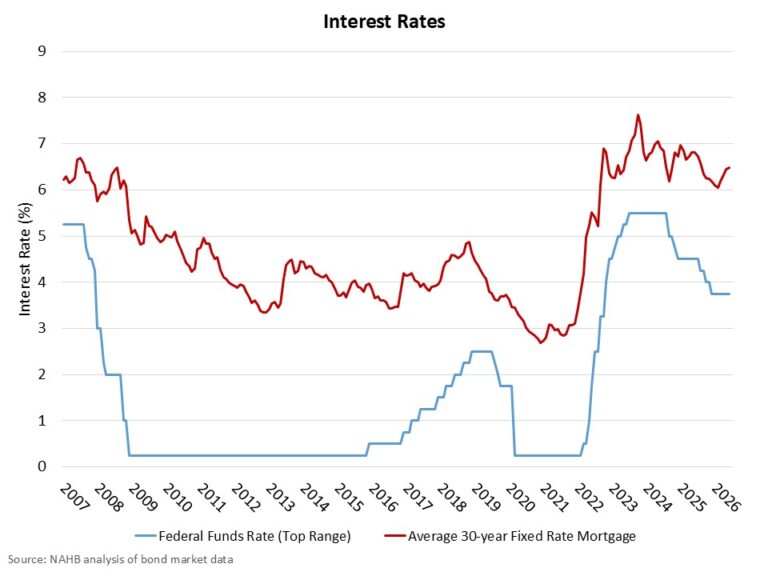

The Federal Reserve remained on pause with respect to rate cuts at the conclusion of its May meeting, maintaining the federal funds rate in the 4.25% to 4.5% range. Characterizing current market conditions, the central bank noted that the “unemployment rate has stabilized at a low level in recent months, and labor market conditions remain solid.” However, the Fed noted that “inflation remains somewhat elevated.”

Today’s statement acknowledged the weak first quarter GDP report via a reference to “swings in net exports have affected data” but otherwise the economy continues to expand at a “solid pace.” The Fed also reiterated its commitment to maintain maximum employment and bring inflation back to its 2% target rate.

With respect to monetary policy, the Fed noted that uncertainty for the U.S. economy has increased. Mindful of its dual mandate (price stability and maximum employment), the Fed noted that the “risks of higher unemployment and higher inflation have risen.” This statement reflects the complex situation the Fed currently faces, with risks to both sides of its policy mandate increasing.

While todays statement does not explicitly reference tariff policy, the debate over tariffs is an obvious candidate for the source of these rising risks that would harm the labor market and raise prices. Indeed, Chair Powell referenced industry reports of tariff risks in his press conference. Many economists, who as a profession dislike tariffs, would argue that the Fed would likely move further on normalizing monetary policy and reducing rates, if not for the risks of future tariff policy.

In the meantime, as Chair Powell noted, otherwise solid economic conditions leave the Fed with moderately restrictive policy and “in a good place to wait and see” with respect to future policy.

Today’s statement noted that the Federal Open Market Committee “will carefully assess incoming data, the evolving outlook, and the balance of risks.” In particular, the Fed will review “readings on labor market conditions, inflation pressures and inflation expectations, and financial and international developments.”

While the list of data sources the Fed is watching seems like everything but the kitchen sink, the Fed should be sure to watch sinks, windows, lighting fixtures, and other building material pricing and availability to gauge future economic and inflation conditions. Shelter inflation remains a leading source of ongoing elevated inflation. And shelter inflation can only be reduced by building more attainable housing.

Discover more from Eye On Housing

Subscribe to get the latest posts sent to your email.


This article was originally published by a eyeonhousing.org . Read the Original article here. .


In a widely anticipated move, the Federal Reserve remained on pause with respect to rate cuts at the conclusion of its March meeting, maintaining the federal funds rate in the 4.25% to 4.5% range. While the central bank acknowledged that the economy remains solid, it emphasized a data- and policy-dependent approach to future monetary policy decisions due to increased uncertainty. According to Chair Powell, the Fed “is not in any hurry” to enact policy change and is well positioned to wait to make future interest rate moves.

However, in a small dovish step, the Fed slowed the pace of its balance sheet reduction, but only for Treasuries. The Treasury security runoff will be reduced from $25 billion a month to $5 billion. The mortgage-backed security run-off process will remain at a $35 billion a monthly rate. Chair Powell stated that the change was not a signal of broader economic issues and was just a technical adjustment to the long-run goal of balance sheet reduction.

Although the Fed did not directly address ongoing trade policy debates (and particularly trade and tariff details expected on April 2) and their economic implications, it reaffirmed that future monetary policy assessments would consider “a wide range of information, including readings on labor market conditions, inflation pressures, and inflation expectations, and financial and international developments.”

With respect to prices, the Fed’s March statement noted that “inflation remains somewhat elevated.” For example, the CPI is at a 2.8% year-over-year growth rate. Shelter inflation, while improving as noted by Chair Powell, continues to run at an elevated 4.2% annual growth rate, significantly above the CPI. These costs are driven by challenges such as financing costs, regulatory burdens, rising insurance costs, and the structural housing deficit.

The March Fed statement highlighted the central bank’s dual mandate, noting its ongoing assessment of the “balance of risks.”  Crucially, the Fed reiterated its “strong commitment to support maximum employment and returning inflation to its 2 percent objective.”

The Fed also published its updated Summary of Economic Projections (SEP). The central bank reduced its GDP outlook for 2025 from 2.1% growth to just 1.7% (measured as percentage change from the fourth quarter of the prior year to the fourth quarter of the year indicated). Policy uncertainly likely played a role for this adjustment.

The Fed made only marginal changes to its forecast for unemployment, pointing to a 4.3% jobless rate for the fourth quarter of 2025. The Fed did lift its inflation outlook, increasing its forecast for Core PCE inflation from 2.5% for the year to 2.8%. Forecasters, including NAHB, have lifted inflation estimates for 2025 due to tariffs, although tariffs may only produce a one-off shift in the price level rather than a permanent increase for the inflation rate. Nonetheless, Chair Powell noted that tariffs have already affected inflation forecasts for 2025. The Fed’s SEP also indicated that the Fed may cut twice this year, placing the federal funds rate below 4% during the fourth quarter of 2025. However, those FOMC members who saw less than two rate cuts this year were more likely to forecast no rate cuts at all for 2025.

Looking over the long run, the SEP projections suggest that the terminal rate for the federal funds rate will be 3%, implying six total twenty-five basis point cuts in the future as rates normalize. This is lower than our forecast, which suggests a higher long-run inflation risk path and a terminal rate near 3.5%. A lower federal funds rate means lower AD&C loan rates for builders, which can help with housing supply and hold back shelter inflation.

Discover more from Eye On Housing

Subscribe to get the latest posts sent to your email.


This article was originally published by a eyeonhousing.org . Read the Original article here. .


Housing’s share of the economy remained unchanged at 16.2% in the fourth quarter of 2024, according to the advance estimate of GDP produced by the Bureau of Economic Analysis. For the year, housing’s share of the economy was 16.2%, up from 16.0% in 2023 and down from 16.5% in 2022.

The more cyclical home building and remodeling component – residential fixed investment (RFI) – was 4.0% of GDP, level with the previous quarter. The second component – housing services – was 12.2% of GDP, also level with the previous quarter. The graph below stacks the nominal shares for housing services and RFI, resulting in housing’s total share of the economy.

Housing service growth is much less volatile when compared to RFI due to the cyclical nature of RFI. Historically, RFI has averaged roughly 5% of GDP while housing services have averaged between 12% and 13%, for a combined 17% to 18% of GDP. These shares tend to vary over the business cycle. However, the housing share of GDP lagged during the post-Great Recession period due to underbuilding, particularly for the single-family sector.

In the fourth quarter, RFI added 21 basis points from the headline GDP growth rate in the fourth quarter of 2024, a welcomed result as RFI previously had two consecutive quarters of negative contributions to GDP. The Federal Reserve, while keeping unchanged this month, lowered the federal funds rate by 100 basis points in September and December of 2024. This likely improved financing conditions for many builders, leading to RFI’s growth in the fourth quarter. A notable observation from the fourth quarter release was nonresidential fixed investment (similar to RFI, but for nonresidential structures) negatively contributed 31 basis points to GDP growth, the first negative effect on the economy for nonresidential fixed investment in over three years.

Housing services added 17 basis points (bps) to GDP growth.  Among household expenditures for services, housing services contributions were the fourth-highest contributor to headline GDP growth behind health care (46 bps), other services (31 bps) and financial services and insurance (18 bps).

Overall GDP increased at a 2.3% annual rate, down from a 3.1% increase in the third quarter of 2024, and down from a 3.0% increase in the second quarter of 2024. Headline GDP growth in 2024 was 2.8%, down slightly from 2.9% in 2023 but up from 2.5% in 2022.

Housing-related activities contribute to GDP in two basic ways:

The first is through residential fixed investment (RFI). RFI is effectively the measure of home building, multifamily development, and remodeling contributions to GDP. RFI consists of two specific types of investment, the first is residential structures. This investment includes construction of new single-family and multifamily structures, residential remodeling, production of manufactured homes, brokers’ fees and some types of equipment that are built into the structure. RFI’s second component, residential equipment, includes investment such as furniture or household appliances that are purchased by landlords for rental to tenants.

For the fourth quarter, RFI was 4.0% of the economy, recording a $1.200 trillion seasonally adjusted annual pace. RFI grew 5.3% at an annual rate in the fourth quarter after falling 4.4% in the third. Among the two types of RFI, real investment in residential structures rose 5.3% while for residential equipment it rose 4.9%. Investment in residential structures stood at a seasonally adjusted annual pace of $1.178 trillion, making its share of residential investment far greater than that of residential equipment, which was at seasonally adjusted annual pace of $21.5 billion.

The second impact of housing on GDP is the measure of housing services. Similar to the RFI, housing services consumption can be broken out into two components. The first component, housing, includes gross rents paid by renters, owners’ imputed rent (an estimate of how much it would cost to rent owner-occupied units), rental value of farm dwellings, and group housing. The inclusion of owners’ imputed rent is necessary from a national income accounting approach, because without this measure, increases in homeownership would result in declines in GDP. The second component, household utilities, is composed of consumption expenditures on water supply, sanitation, electricity, and gas.

For the fourth quarter, housing services represented 12.2% of the economy or $3.625 trillion on a seasonally adjusted annual basis. Housing services grew 1.4% at an annual rate in the fourth quarter. Real person consumption expenditures for housing also grew 1.4%, while household utilities expenditures grew 1.6%. At the seasonally adjusted annual pace, housing expenditures was $3.166 trillion and household utility expenditures stood at $458.9 billion in seasonally adjusted annual rates.

Discover more from Eye On Housing

Subscribe to get the latest posts sent to your email.


This article was originally published by a eyeonhousing.org . Read the Original article here. .

Inflation picked up to 2.7% in November, while matching expectations, the last mile to the Fed’s 2% target proves to be the most challenging. Shelter costs continued to be the main driver of inflation, contributing nearly 40% of the monthly increase. However, the year-over-year change in the shelter index remained below 5% for a third straight month and posted its lowest annual gain since February 2022, suggesting moderation in housing inflation.

While the Fed’s interest rate cuts could help ease some pressure on the housing market, its ability to address rising housing costs is limited, as these increases are driven by a lack of affordable supply and increasing development costs. In fact, tight monetary policy hurts housing supply because it increases the cost of AD&C financing. This can be seen on the graph below, as shelter costs continue to rise at an elevated pace despite Fed policy tightening. Additional housing supply is the primary solution to tame housing inflation.

Furthermore, the election result has put inflation back in the spotlight and added some downside risks to the economic outlook. Proposed tax cuts and tariffs could increase inflationary pressures, suggesting a more gradual easing cycle with a slightly higher terminal federal funds rate. Given the housing market’s sensitivity to interest rates, this could extend affordability crisis and constrain housing supply as builders continue to grapple with lingering supply chain challenges.

During the past twelve months, on a non-seasonally adjusted basis, the Consumer Price Index (CPI) rose by 2.7% in November, according to the Bureau of Labor Statistics’ report. This followed a 2.6% year-over-year increase in October. Excluding the volatile food and energy components, the “core” CPI increased by 3.3% over the past twelve months, the same increase as in the previous two months. The component index of food rose by 2.4%, while the energy component index fell by 3.2%.

On a monthly basis, the CPI rose by 0.3% in November on a seasonally adjusted basis, after a 0.2% increase in October. The “core” CPI increased by 0.3% in November, the same increase as in the past three months.

The price index for a broad set of energy sources rose by 0.2% in November, with declines in electricity (-0.4%) offset by increases in gasoline (+0.6%), natural gas (+1.0%) and fuel oil (+0.6%). Meanwhile, the food index rose 0.4%, after a 0.2% increase in October. The index for food away from home increased by 0.3% and the index for food at home rose by 0.5%.

The index for shelter (+0.3%) was the largest contributor to the monthly increase in all items index, accounting for nearly 40% of the total increase. Other top contributors that rose in November include indexes for used cars and trucks (+2.0%), household furnishings and operations (+0.6%), medical care (+0.3%) and new vehicles (+0.6%). Meanwhile, the index for communication (-1.0%) was among the few major indexes that decreased over the month.

The index for shelter makes up more than 40% of the “core” CPI, rose by 0.3% in November after a 0.4% in October. Both indexes for owners’ equivalent rent (OER) and rent of primary residence (RPR) increased by 0.2% over the month. For the rent index, it was the smallest monthly increase since April 2021 and July 2021. Despite the moderation, shelter costs remained the largest contributors to headline inflation. 

NAHB constructs a “real” rent index to indicate whether inflation in rents is faster or slower than overall inflation. It provides insight into the supply and demand conditions for rental housing. When inflation in rents is rising faster than overall inflation, the real rent index rises and vice versa. The real rent index is calculated by dividing the price index for rent by the core CPI (to exclude the volatile food and energy components).

In November, the Real Rent Index fell by 0.1%, marking its first negative reading since December 2021. Over the first eleven months of 2024, the monthly growth rate of the Real Rent Index averaged 0.1%, slower than the average of 0.2% in 2023.

Discover more from Eye On Housing

Subscribe to get the latest posts sent to your email.


This article was originally published by a eyeonhousing.org . Read the Original article here. .


According to NAHB analysis of quarterly Census data, the count of multifamily, for-rent housing starts declined significantly during the second quarter of 2024. For the quarter, 88,000 multifamily residences started construction. Of this total, 83,000 were built-for-rent. This marks a notable 37% decline from the second quarter of 2023 for the multifamily built-for-rent category.

The market share of rental units of multifamily construction starts was flat at a still elevated 94% for the second quarter as the small condo market remained held back due to higher interest rates. In contrast, the historical low share of 47% was set during the third quarter of 2005, during the condo building boom. An average share of 80% was registered during the 1980-2002 period.

For the second quarter, there were just 5,000 multifamily condo unit construction starts.

An elevated rental share of multifamily construction is holding typical apartment size below levels seen during the pre-Great Recession period. According to second quarter 2024 data, the average square footage of multifamily construction starts was relatively unchanged at 1,034 square feet. The median declined to 955 square feet. These estimates are near multidecade lows.

Discover more from Eye On Housing

Subscribe to get the latest posts sent to your email.


This article was originally published by a eyeonhousing.org . Read the Original article here. .

Pin It