Tag

Remain

Browsing


The long-term shift toward building single-family detached homes on smaller lots appears to have stabilized. According to the latest Survey of Construction (SOC), the share of new homes built on smaller lots remained near record highs in 2025, following more than a decade of steadily shrinking lot sizes. While the median lot size edged up slightly in 2025, the increase was modest and did not alter the broader trend toward more compact development.

The share of smaller lots remained high in 2025, with close to two-thirds of new single-family detached homes sold occupying lots under 9,000 square feet (1/5 of an acre or less). Moreover, 38% of lots were under 7,000 square feet (or less than 1/6 of an acre). These shares are just slightly below the record highs established over the last two years.

In contrast, when the Census Bureau started tracking these series in 1999, less than half (46%) of new for-sale single-family detached homes occupied lots under 9,000 square feet. Our earlier analysis traced how new single-family detached homes have steadily shifted toward smaller lots. That analysis revealed that the trend accelerated over the last 15 years, reflecting persistent lot shortages and builders’ efforts to improve affordability.

The newly released data show that the median lot size of a new single-family detached home sold in 2025 increased slightly to 8,543 square feet, up from 8,506 square feet in 2024. Although this represents a small year-over-year increase, the typical lot remains under 1/5 of an acre and well below historical levels. It is only modestly above the record-low median of 8,177 square feet recorded in 2019. The data suggest that, after years of steady declines, lot sizes have largely leveled off while remaining historically small, under one-fifth of an acre.

While the nation’s production of spec homes shifts towards smaller lots, regional differences in lot sizes persist. Looking at single-family detached spec homes started in 2025, the median lot size in New England is double the national median.  

New England is known for strict local zoning regulations that often require very low density. Therefore, it is not surprising that single-family detached spec homes started in New England are built on some of the largest lots in the nation, with half of the lots exceeding 0.4 acres. The East South Central division is second on the list, with the median lot occupying 0.3 acres.  

At the other end of the spectrum, the Pacific division, where densities are high and developed land is scarce, has the smallest lots, with half of the lots being under 0.13 acres. The bordering Mountain division also reports typical lots smaller (0.15 acres) than the national median.  

In the South, the West South Central division stands out for starting half of single-family detached spec homes on lots under 0.15 acres. This is half the size of typical lots in the neighboring East South Central division.  

The analysis above is limited to single-family detached speculatively built homes. Custom homes built on an owner’s land with either the owner or a builder acting as the general contractor do not involve the work of a professional land developer subdividing a property. Therefore, in the case of custom homes, lots refer to an owner’s land area rather than lots in a conventional sense. Nevertheless, the SOC reports lot sizes for custom homes and shows that they tend to have larger lots. The median lot size for custom single-family detached homes started in 2025 is one acre.  

For regional analysis, the median lot size is chosen over the average because extreme outliers heavily influence averages. In addition, the Census Bureau often masks extreme lot sizes and values on the public use SOC dataset, making it difficult to calculate averages precisely, but medians (as the midpoint of a frequency distribution) remain unaffected by these procedures.


This article was originally published by a eyeonhousing.org . Read the Original article here. .
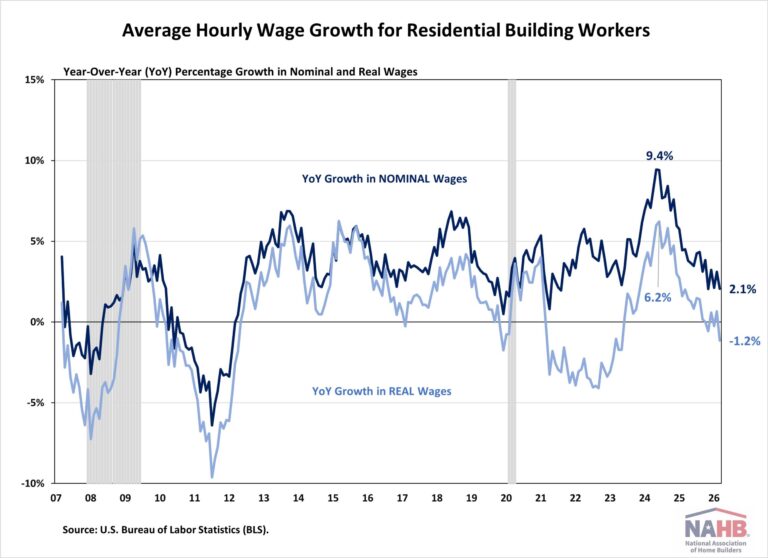

Wage growth for residential building workers remained subdued during the first quarter of 2026, reflecting continued softness in housing construction activity and easing labor demand. According to the latest data from the U.S. Bureau of Labor Statistics, both nominal and inflation-adjusted wage gains moderated further, marking a clear transition from the rapid post-pandemic expansion toward a slower labor market.

In nominal terms, average hourly earnings (AHE) for residential building workers increased 2.1% year-over-year in March 2026, down notably from the 9.4% peak reached in mid-2024 and continuing the broader cooling trend observed throughout 2025.

After accounting for inflation, real wages declined 1.2% year-over-year in March 2026, indicating that wage gains have not fully kept pace with broader price increases. Real wage growth strengthened temporarily during parts of 2024, reaching a peak of 6.2%, but has since softened alongside the slowdown in residential construction activity.

Meanwhile, the number of open, and unfilled construction sector jobs has continued to trend downward, consistent with weaker housing demand and slower construction hiring.

Despite the slowdown in wage growth, residential building workers’ wages remain competitive relative to other industries:

8.4% higher than the manufacturing sector ($36.54 per hour)

22.4% higher than the transportation and warehousing sector ($32.34 per hour)

3.6% lower than the mining and logging sector ($41.10 per hour)

Note:

Data used in this post relates to all employees in the residential building industry. This group includes both new single-family housing construction (excluding for-sale builders) and residential remodelers but does not include specialty trade contractors.


This article was originally published by a eyeonhousing.org . Read the Original article here. .
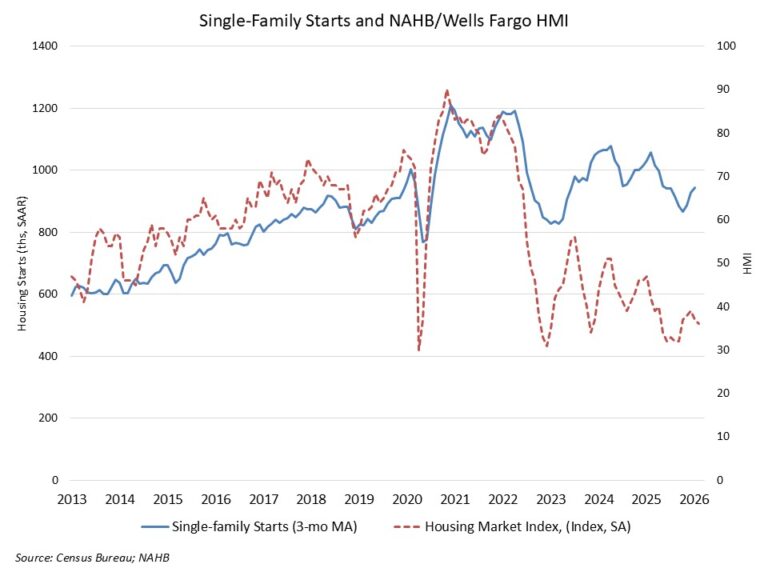

Elevated construction costs and constrained affordability conditions led to a reduction in single-family housing starts in January.

However, led by solid multifamily production, overall housing starts increased 7.2% in January to a seasonally adjusted annual rate of 1.49 million units, according to a report from the U.S. Department of Housing and Urban Development and the U.S. Census Bureau.

The January reading of 1.49 million starts is the number of housing units builders would begin if development kept this pace for the next 12 months.

Within this overall number, single-family starts decreased 2.8% to a 935,000 seasonally adjusted annual rate. Weather effects also likely depressed single-family construction in the Northeast, where single-family starts were down 33% from December 2025 and down more than 6% compared to January 2025 readings.

The multifamily sector, which includes apartment buildings and condos, increased 30% to an annualized 552,000 pace. However, this data may be revised lower in future revisions. Furthermore, prior NAHB analysis of the geography of permit data has shown recent gains for apartment construction occurring in lower density areas, such as exurbs, secondary cities and small towns.

On a regional basis compared to the previous month, combined single-family and multifamily starts were 47.4% higher in the Northeast, 10.8% lower in the Midwest, 11.4% higher in the South and 7.5% lower in the West.

Overall permits decreased 5.4% to a 1.38 million unit annualized rate in January. Single-family permits decreased 0.9% to an 873,000-unit rate, which is the weakest reading since August of last year. This is an indicator of relatively flat construction starts conditions for 2026 amid the ongoing affordability crisis. Multifamily permits decreased 12% to an annualized 503,000 pace.

Looking at regional permit data compared to the previous month, permits were 9.6% lower in the Northeast, 9% higher in the Midwest, 3.5% lower in the South and 15.7% in the West.

The number of single-family homes under construction fell back to 582,000 in January, down 8.8% year over year as the single-family home building market has slowed. Despite recent gains for apartment construction, the number of apartments under construction has fallen back to 686,000 units, a 10% decline from January 2025.

The multiyear trend of a smaller number of units under construction is consistent with builders pulling back construction given higher post-covid construction costs and affordability constraints.


This article was originally published by a eyeonhousing.org . Read the Original article here. .
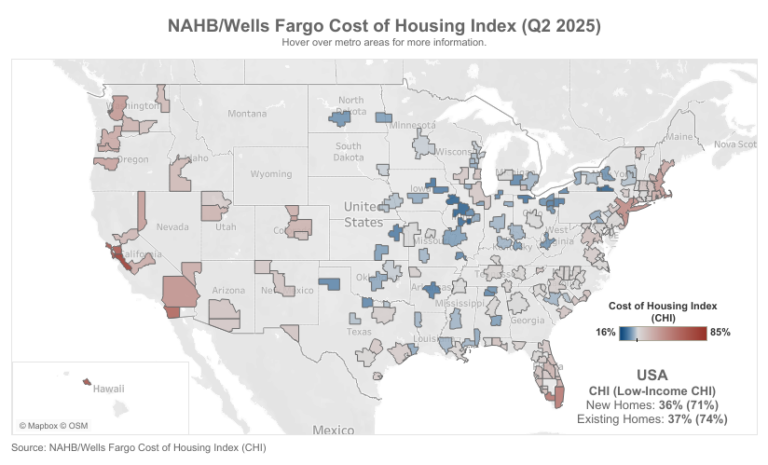

While new homes remain largely unaffordable, builder efforts to improve housing affordability paid dividends in the second quarter of 2025, according to the latest data from the National Association of Home Builders (NAHB)/Wells Fargo Cost of Housing Index (CHI). The CHI results from the second quarter of 2025 show that a family earning the nation’s median income of $104,200 needed 36% of its income to cover the mortgage payment on a median-priced new home. Low-income families, defined as those earning only 50% of median income, would have to spend 71% of their earnings to pay for the same new home.

The figures are somewhat higher for the purchase of existing homes in the U.S., showing that it took more income to buy an existing home. A typical family would have to pay 37% of their income for a median-priced existing home while a low-income family would need to pay 74% of their earnings to make the same mortgage payment.

The second quarter of 2025 marked the largest historical gap where existing home prices exceeded those of new homes. Different dynamics in the two sectors are responsible for the price divergence. On one hand, builders are offering incentives for smaller homes on smaller lots, with streamlined options and features, and thus shifting their production toward less expensive homes.  Many existing homeowners, meanwhile, are locked-in their homes by low mortgage rates, limiting resale inventory, and causing existing home prices to increase.

The percentage of a family’s income needed to purchase a new home was unchanged at 36% from the first to the second quarter, while the low-income CHI fell from 72% to 71% over the same period. Median new home prices edged down 1%, from $416,900 in Q1 2025 to $410,800 in Q2 2025, while the average 30-year mortgage rate slipped from 6.91% to 6.88%.

Affordability of existing homes, on the other hand, edged lower for both median- and low-income families between the first and second quarters. Median existing home prices rose 7% during this period, from $402,300 to $429,400. The share of income needed to pay for an existing home rose from 35% to 37% for a typical family and from 70% to 74% for a low-income family during this period.

CHI is also available for 175 metropolitan areas, calculating the percentage of a family’s income needed to make the mortgage payment on an existing home based on the local median home price and median income in those markets.

In 10 out of 175 markets in the second quarter, the typical family is severely cost-burdened (must pay more than 50% of their income on a median-priced existing home). In 85 other markets, such families are cost-burdened (need to pay between 31% and 50%). There are 80 markets where the CHI is 30% of earnings or lower.

The Top 5 Severely Cost-Burdened Markets

San Jose-Sunnyvale-Santa Clara, Calif., was the most severely cost-burdened market on the CHI, where 93% of a typical family’s income is needed to make a mortgage payment on an existing home. This was followed by:

Urban Honolulu, Hawaii (73%)

San Francisco-Oakland-Fremont, Calif. (72%)

San Diego-Chula Vista-Carlsbad, Calif. (67%)

Naples-Marco Island, Fla. (60%)

Miami-Fort Lauderdale-Palm Springs, Fla. (60%)

Low-income families would have to pay between 119% and 186% of their income in all six of the above markets to cover a mortgage.

The Top 5 Least Cost-Burdened Markets

By contrast, Decatur, Ill., was the least cost-burdened markets on the CHI, where typical families needed to spend just 17% of their income to pay for a mortgage on an existing home. Rounding out the least burdened markets are:

Elmira, N.Y. (18%)

Peoria, Ill. (19%)

Davenport-Moline-Rock Island, Iowa-Ill. (19%)

Binghamton, N.Y. (19%)

Low-income families in these markets would have to pay between 33% and 38% of their income to cover the mortgage payment for a median-priced existing home.

Visit nahb.org/chi for tables and details.

Discover more from Eye On Housing

Subscribe to get the latest posts sent to your email.


This article was originally published by a eyeonhousing.org . Read the Original article here. .


Only 56% of professional remodelers undertake projects designed to allow homeowners to Age-in-Place (AIP), according to results from NAHB’s Q1 2025 Remodeling Market Index (RMI) survey.  This is the lowest percentage recorded since NAHB began periodically asking AIP questions on its RMI survey in 2004.  Economic uncertainty and high interest rates over the past year are the most likely explanations for this slight pullback in projects.  Additionally, stock market volatility has dampened any potential wealth effects, especially since over 75% of all corporate equities and mutual fund holdings are held by those 55 or older.

The National Institute of Aging defines AIP as “staying in your own home as you get older.”  This concept is becoming more relevant as the overall median age of the population continues to increase.  Given the age of the existing housing stock, the need to update homes for AIP is a major demand-driver for the remodeling sector.

Age Groups

When asked about the age groups of homeowners who request AIP work, 73% of remodelers indicated that homeowners are 65 years or older, followed by 55 to 64 years at 61%.  These two age groups have consistently been above 60% since the Q4 2010 survey.

Familiarity with Aging-in-Place

Ninety-six percent of remodelers indicated that most or some of their consumers are familiar with the AIP concept.  That share has been at least 90% since the Q4 2018 survey.

Type of Aging-in-Place Projects

Grab bars remain the most common AIP project, with 87% of remodelers reporting this job in the last year, followed by curb-less shower (78%), installing higher toilets (71%), and widening doorways (52%).  While their relative ranking has changed, these four have consistently been the AIP project types most often cited by remodelers.

Frequency of Aging-in-Place Requests

Seventy-three percent of remodelers indicated that requests for AIP features have significantly or somewhat increased over the past 5 years.  This figure has not changed much since the inception of the series in 2004, ranging from 72% to 77%.

Reasons for Aging-in-Place Work

As for the reason why customers are undertaking AIP projects, 91% of remodelers stated that customers are planning ahead for future needs, followed by living with older parents (48%) and acute age-related disabilities (43%). 

Who is Requesting Aging-in-Place Work?

Sixty-five percent of remodelers indicated that a majority of their AIP work was determined by the client, whereas the other 35% said it was mostly suggested by the contractor.  The ‘determined by client’ option has consistently been above 50 percent.

Receptive to Aging-in-Place Modifications

When asked how receptive potential clients are to incorporating suggested AIP modifications, 48% indicated that their customers were very receptive and 51% were somewhat receptive, with only 2% stated that customers were not at all receptive to these modifications.  The combined share of potential clients being receptive (‘very receptive’ + ‘somewhat receptive’) has consistently been above 95%.

Discover more from Eye On Housing

Subscribe to get the latest posts sent to your email.


This article was originally published by a eyeonhousing.org . Read the Original article here. .

Pin It