Tag

Rebound

Browsing


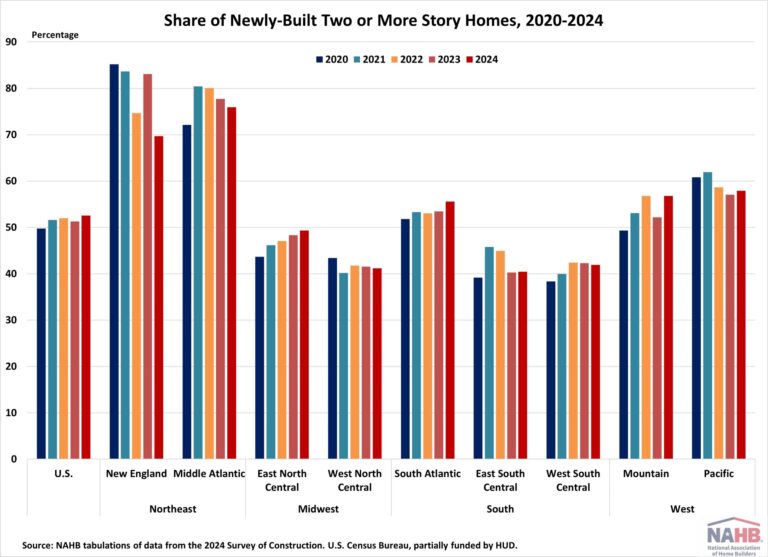
Over half of new single-family homes built in 2024 were two or more stories, according the recent release of the Census Bureau’s Survey of Construction (SOC). After declining in 2023, the share of homes started with two or more stories increased again in 2024, continuing the upward trend in place since 2020.

Nationwide, the share of new homes with two or more stories rose from 51.3% in 2023 to 52.5% in 2024, while the share of new homes with one story fell from 48.7% to 47.5%. Nationally, there were more multi-story homes built in 2024, however, this share varied significantly across the nation.

New homes started in the Midwest and South generally showed a stronger preference for single-story homes. In the Midwest (West North Central and East North Central), 58.8% and 50.7% of new homes started were one story, while in the South (East South Central and West South Central), the shares were 59.5% and 58.1%. However, the South Atlantic division was an exception, with one story homes falling to 44.4%, the lowest since 2019.

Although single story homes are more common in the Midwest and South, their shares declined in 2024 across the East North Central (Midwest), South Atlantic (South) and East South Central (South). This suggests a slow upward trend in two or more story homes across the South after COVID.

Following the national trend, five of the nine divisions saw a greater share of newly-built two or more story homes. The highest two or more story shares of new homes were concentrated in the Northeast and West, with Middle Atlantic and New England at 75.9% and 69.7%, while the Pacific and Mountain reached 57.9% and 56.8%, respectively. However, both Northeast divisions declined from 2023 levels, with New England dropping to its lowest two or more story share since NAHB started tracking in 2017. Meanwhile, new homes started with two or more stories in the Mountain and Pacific divisions both experienced increases in their two or more stories shares.

Discover more from Eye On Housing

Subscribe to get the latest posts sent to your email.


This article was originally published by a eyeonhousing.org . Read the Original article here. .

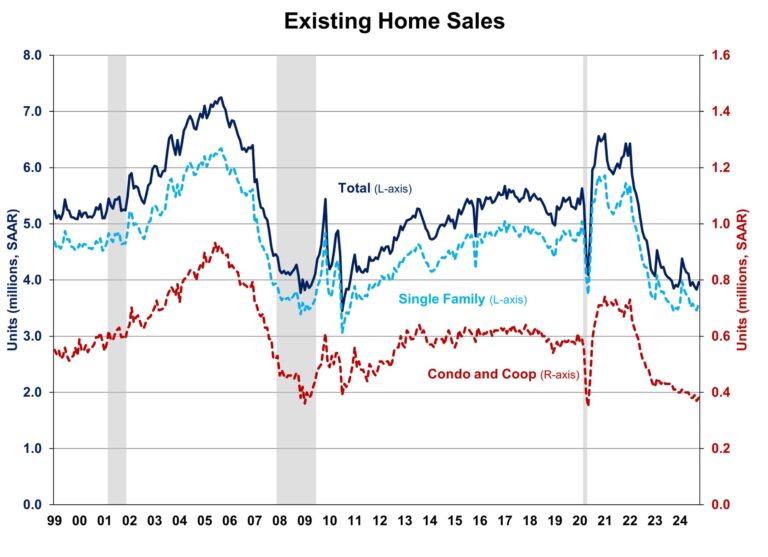
Existing home sales in October rebounded from a 14-year low and posted the first annual increase in more than three years, as buyers took advantage when mortgage rates briefly reached a 2-year low in late September, according to the National Association of Realtors (NAR). While elevated home prices persist due to the lock-in effect, we expect sales activity to increase as mortgage rates moderate with additional Fed easing. Improving inventory should help slow home price growth and enhance affordability.

Homeowners with lower mortgage rates have opted to stay put, avoiding trading existing mortgages for new ones with higher rates. This trend is driving home prices higher and holding back inventory. With the Federal Reserve beginning its easing cycle at the September meeting, mortgage rates are expected to gradually decrease, leading to increased demand and unlocking lock-in inventory in the coming quarters. Total existing home sales, including single-family homes, townhomes, condominiums, and co-ops, rose 3.4% to a seasonally adjusted annual rate of 3.96 million in October. On a year-over-year basis, sales were 2.9% higher than a year ago, ending a 38-month streak of year-over-year declines since July 2021.

The first-time buyer share rose to 27% in October, up from 26% in September but down from 28% in October 2023.

The existing home inventory level rose from 1.36 million in September to 1.37 million units in October and is up 19.1% from a year ago. At the current sales rate, September unsold inventory sits at a 4.2-months supply, down from 4.3-months last month but up 3.6-months a year ago. This inventory level remains low compared to balanced market conditions (4.5 to 6 months’ supply) and illustrates the long-run need for more home construction.

Homes stayed on the market for an average of 29 days in October, up from 28 days in September and 23 days in October 2023.

The October all-cash sales share was 27% of transactions, down from 30% in September and 29% a year ago. All-cash buyers are less affected by changes in interest rates.

The October median sales price of all existing homes was $407,200, up 4.0% from last year. This marked the 16th consecutive month of year-over-year increases. The median condominium/co-op price in October was up 1.6% from a year ago at $360,300. This rate of price growth will slow as inventory increases.

Geographically, all four regions saw an increase in existing home sales in October, ranging from 1.3% in the West to 6.7% in the Midwest. On a year-over-year basis, sales rose 1.1%, 2.3%, and 8.5% in the Midwest, South and West. Sales in the Northeast stayed unchanged.

The Pending Home Sales Index (PHSI) is a forward-looking indicator based on signed contracts. The PHSI rose from 70.6 to 75.8 in September due to improved inventory and lower mortgage rates in late summer. On a year-over-year basis, pending sales were 2.6% higher than a year ago per National Association of Realtors data.

Discover more from Eye On Housing

Subscribe to get the latest posts sent to your email.


This article was originally published by a eyeonhousing.org . Read the Original article here. .


A score higher than 50 indicates that more firms reported an increase in their business expectations than reported a decrease.

Construction Firms

1. Business activity outlook increased. The Expected Business Activity Indicator, related to project inquiries and new committed projects, increased by 10 points, to 62, for the fourth quarter of 2024, from 52 for the third quarter of 2024. This means more construction firms anticipate quarter-over-quarter growth than anticipate a decline.

Expectations for project inquiries increased by 7 points, to 59 (from 52 for Q3), and expectations for new committed projects increased by 12 points, to 64 (from 52 for Q3).

Both build-only and design-build firms are more optimistic for Q4 than they were for the previous quarter. The expected activity indicator for build-only firms increased 9 points, to 62 (from 53 for Q3), and for design-build firms it increased 10 points, to 61 (from 51 for Q3).

The indicator is based on survey questions about whether businesses expect the number of project inquiries and new projects to increase, decrease or remain unchanged in the coming three months compared with the previous three months.


This article was originally published by a www.houzz.com . Read the Original article here. .


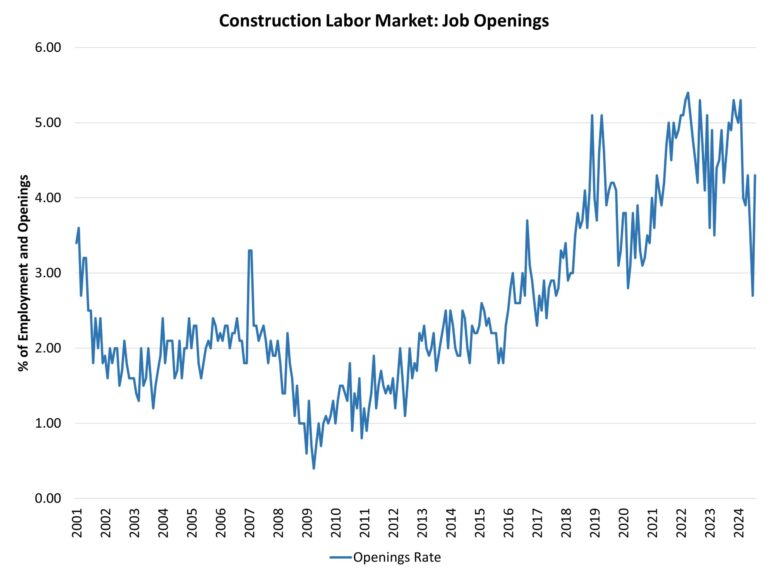
After a period of slowing associated with declines for some elements of residential construction, the count of open construction sector jobs bounced back in the August data, per the Bureau of Labor Statistics’ Job Openings and Labor Turnover Survey (JOLTS). However, construction job openings remain slightly lower compared to a year ago.

In August, after revisions, the number of open jobs for the overall economy increased slightly from 7.71 million to 8.04 million. This is notably smaller than the 9.36 million estimate reported a year ago, but the monthly gain is a sign of a somewhat resilient labor market. Previous NAHB analysis indicated that this number had to fall below 8 million on a sustained basis for the Federal Reserve to feel more comfortable about labor market conditions and their potential impacts on inflation. With estimates now remaining near 8 million for national job openings, the Fed has begun a credit easing cycle.

The number of open construction sector jobs rebounded from a revised, soft reading of 232,000 in July to 370,000 in August. Elements of the construction sector slowed in prior months as tight Fed policy persisted. However, with the August rebound for open construction sector jobs, the number of job openings is roughly flat compared to the year-prior estimate of 386,000 in August 2023.

The construction job openings rate also increased, rising to 4.3% in August after several months of weaker readings.

The layoff rate in construction increased to 2.0% in August after a 1.9% rate in July. The quits rate in construction decreased slightly to 2.1% in August from 2.2% in July.

Discover more from Eye On Housing

Subscribe to get the latest posts sent to your email.


This article was originally published by a eyeonhousing.org . Read the Original article here. .
Pin It