
Tag

Push

Browsing


Mortgage rates increased in August as Treasury yields remained elevated amid persistent inflation concerns. According to Freddie Mac, the 30-year fixed-rate mortgage averaged 6.67% in August, up 13 basis points (bps) over July. Since the conflict in the Middle East began, the 30-year mortgage rate has jumped by more than 60 bps. The average 15-year rate averaged 5.98% in July, up 7 bps from July and 55 bps from the end of February. Mortgage rates are now roughly on par with their levels a year ago, with the 30-year rate 6 bps higher and the 15-year rate 24 bps higher.

The 10-year Treasury yield, a key benchmark for long-term borrowing, rose 10 bps to an average of 4.68% in August, Yields rose in the later part of the month amid a broader selloff in global government bonds. Long-term government bond yields across several major economics climbed to multi-year highs in August, with the 30-year US Treasury yield reaching its highest level since 2007 and long-term yields in Japan and parts of Europe reaching levels not seen in decades. The global selloff reflected growing investor concerns about persistent inflation, rising government debt and heavy sovereign borrowing. Higher oil prices from the ongoing Iran conflict also added to inflation concerns.

Domestically, Treasury yields faced additional upward pressure following the Federal Reserve’s (Fed) annual Jackson Hole symposium. Federal Reserve Chair Kevin Warsh emphasized that inflation remained above the Fed’s 2% target, and that restoring price stability remained the Fed’s primary focus. His remarks reinforced market expectations that monetary policy could tighten later in the year.


This article was originally published by a eyeonhousing.org . Read the Original article here. .
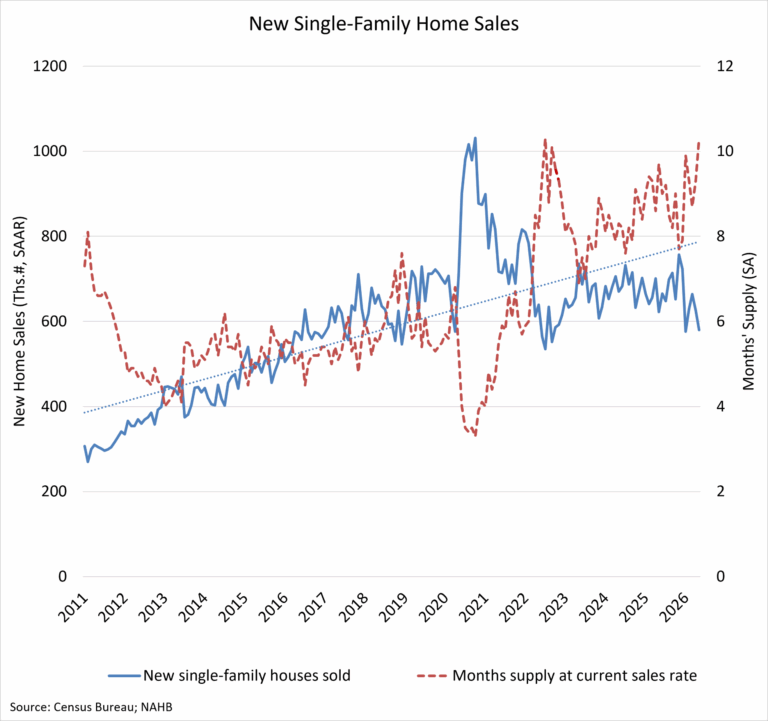

Elevated mortgage rates, rising inflation and economic uncertainty kept many buyers out of the market in May as consumers and builders continue to deal with challenging affordability conditions. While monthly sales activity softened, builders continue to operate in a market characterized by cautious buyers and persistent financing constraints.

Sales of newly built single-family homes fell 7.3% month-over-month in May to a seasonally adjusted annual rate of 580,000 units, according to the U.S. Department of Housing and Urban Development and the U.S. Census Bureau. This represented a 6.8% decline compared to a year earlier. A new home sale is recorded when a contract is signed, or a deposit is accepted, regardless of the stage of construction. The seasonally adjusted annual rate reflects the pace of sales that would occur over a 12-month period if current conditions persist.

New single-family home inventory totaled 496,000 units in May, up 2.3% from the prior month but down 1.4% from a year earlier. At the current sales pace, the months’ supply of new homes stood at an elevated 10.3 months, above the 9.7 months recorded one year ago. A five to six-months inventory level is generally considered to indicate a balanced market.      

Combined new and existing home inventory has edged higher in recent months, with the total months’ supply reaching 5.2 months. Inventory conditions in the existing home market have gradually improved in recent months. Moderating prices across both markets have helped support buyer demand amid ongoing affordability concerns.

At the end of May, there were 115,000 completed, ready-to-occupy homes available for sale on a non-seasonally adjusted basis, unchanged from a year earlier. Completed homes accounted for one-quarter of total inventory, while homes under construction made up 53%. The remaining 24% of homes sold in May had not yet started construction at the time the sales contract was signed.

Home prices remained relatively stable despite the slowdown in sales activity. The median new home sale price was $424,900, up 2.0% from April and essentially unchanged from a year ago. Homes priced between $300,000 and $499,999 accounted for half of all new home sales, while only 15% of sales were priced below $300,000, underscoring ongoing affordability challenges for entry-level buyers. The remaining 35% of the homes were priced above $500,000.

Regional performance was mixed in May. The Midwest posted the strongest monthly gain in sales, rising 16.2% from April, while the Northeast recorded a modest 3.0% increase. In contrast, sales declined in both the South and West, with the West experiencing the sharpest drop, falling 26.9% from the previous month.

Compared with May 2025, the Northeast was the only region to record a year-over-year gain, with sales increasing 17.2%. Sales declined 3.7% in the Midwest, 5.4% in the South, and 17.0% in the West.

On a year-to-date basis, regional trends were similarly uneven. New home sales increased 4.2% in the Midwest and 1.9% in the Northeast compared with the same period last year. Meanwhile, sales were down 8.2% in the South and 11.4% in the West, indicating that housing market weakness remains concentrated in the nation’s largest home building regions.


This article was originally published by a eyeonhousing.org . Read the Original article here. .

Pin It