Tag

Profit

Browsing


The Q3 2026 U.S. Houzz Pro Industry Barometer survey of nearly 1,000 residential construction, architecture and design firms reveals a wave of renewed confidence heading into the third quarter of 2026. Construction firms expect business activity to rise over the next quarter due to an uptick in project inquiries, despite a slight dip in recent months. And the design sector enters the quarter with significant momentum, fueled by gains in both inquiries and new committed projects.

Their optimism comes with a reality check, however. To protect against higher costs, labor shortages and cautious homeowners, businesses are focusing on three key areas: managing immediate overhead spikes, being choosier about the jobs they take, and changing where and how they look for work. Here’s a closer look at how construction and design professionals are navigating the current landscape.


This article was originally published by a www.houzz.com . Read the Original article here. .


Profitability for residential remodelers reached its highest level in more than two decades in 2024. Industry-wide profit benchmarks are important because they allow companies to evaluate their financial performance in context with the industry. Doing so can guide resource allocation, budgeting, and target setting for costs and expense lines, leading to a more successful business strategy. This post summarizes the results from NAHB’s most recent edition of the Remodelers’ Cost of Doing Business Study.

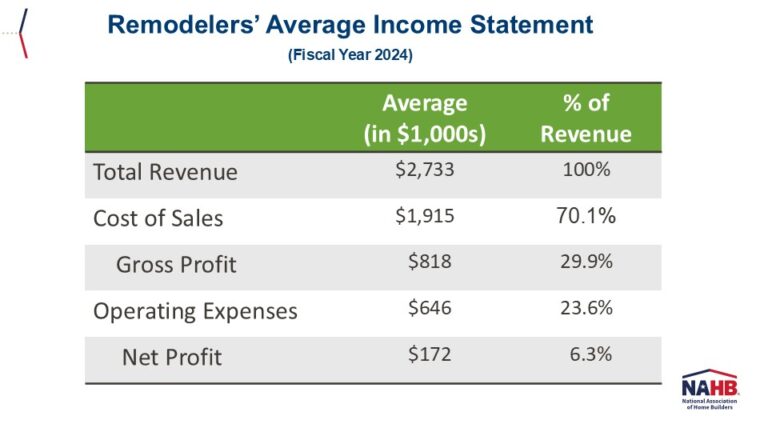
On average, residential remodelers reported $2.7 million in total revenue for fiscal year 2024. Of that, about $1.9 million (70.1%) was spent on cost of sales (i.e., labor, materials, contractors), which translates into an average gross profit margin of 29.9%. Operating expenses (i.e., indirect construction costs, finance, S&M, G&A, and owner’s compensation) cost remodelers an average of $646,000 (23.6% of revenue), leaving them with an average net profit margin of 6.3%. 

Remodelers’ 29.9% average gross profit margin in 2024 was a solid five percentage points higher than in 2021, when the metric sank to a record low of 24.9%. The improvement was due in large part to a significant reduction in trade contractor costs, which dropped from 36% of revenue in 2021 to 30% in 2024. The average gross margin in 2024 (29.9%) marked a return to gross profitability levels at par with 2018 (30.1%).

Successfully reducing their costs of sales improved remodelers’ bottom line. In 2024, their average net profit margin (6.3%) was higher than in 2021 (4.7%) and 2018 (5.2%). It was also the highest net margin reported by remodelers since 1996 (6.8%).

The Cost of Doing Business Study also tracks residential remodelers’ balance sheets. On average, they reported $668,000 in total assets on their 2024 balance sheets. Of that, $331,000 (50%) was financed by liabilities (either short- or long-term) and the other $337,000 (50%) by equity builders held in their companies.

Historical data show remodelers’ balance sheets expanded significantly in 2024, with average total assets ($668,000) up 34% compared to 2021 ($497,000). But perhaps more important than fluctuations in the nominal size of their balance sheets, the data clearly point to remodelers deleveraging their businesses in the last decade. In 2015, 68% of remodelers’ assets were financed through debt. By 2021, that share was down to 49%, where it remained essentially unchanged in 2024 (50%). Logically, the latter means remodelers are using more of their own capital to run their companies, as illustrated by their equity share rising from 33% in 2015 to 50% in 2024.

More specific data about remodelers’ various cost of sales lines (e.g., the share of revenue spent on materials), operating expenses (e.g., how much owners were paid as compensation), or types of assets (e.g., cash) are available in the official publication of the 2026 Remodelers’ Cost of Doing Business Study.


This article was originally published by a eyeonhousing.org . Read the Original article here. .


Profitability for single-family home builders reached the highest levels in more than a decade in 2023.  Industrywide profit benchmarks are important because they allow companies to compare their financial performance against the entire industry.  Doing so can guide resource allocation, budgeting, and target setting for costs and expense lines.  More broadly, understanding industry benchmarks can lead to an improved business strategy and to higher financial results. 

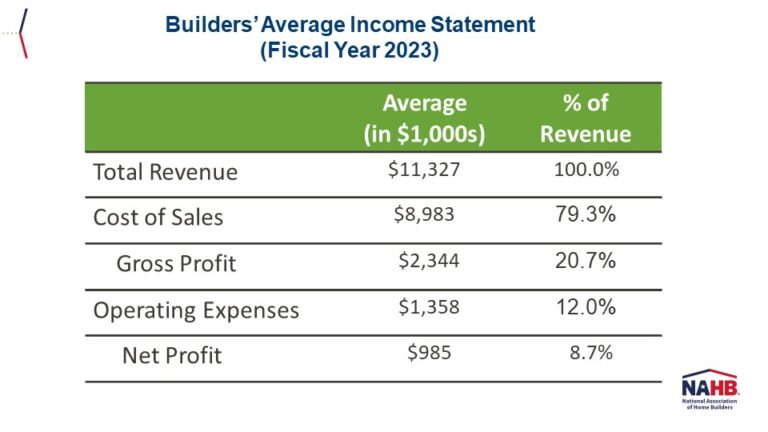
On average, builders reported $11.3 million in total revenue for fiscal year 2023.  Of that, about $9.0 million (79.3%) was spent on cost of sales (i.e., land, direct and indirect construction costs), which translates into an average gross profit margin of 20.7%.  Operating expenses (i.e., finance, S&M, G&A, and owner’s compensation) cost builders an average of $1.4 million (12.0% of revenue), leaving them with an average net profit margin of 8.7%.  This post summarizes the results from NAHB’s most recent edition of the Builders’ Cost of Doing Business Study.

Based on historical survey data (performed every three years), the 20.7% average gross profit margin in 2023 was the highest registered since 2006 (20.8%).  As a point of reference, builders’ gross margin sank to a record low of 14.4% in 2008 (i.e., during the housing recession), but bounced back steadily through 2017 (19.0%).  The onset of COVID-19 in 2020 increased costs, causing builders’ average gross margin to drop (18.2%) for the first time since 2008.

The 8.7% average net profit margin for fiscal year 2023 is the highest in this survey’s recent history, exceeding the 7.7% reported in 2006.  However, increased use of financial incentives, such as mortgage rate buydowns, and cuts in home prices are likely to have caused this margin to shrink in 2024.

The Cost of Doing Business Study also tracks builders’ balance sheets.  On average, builders reported $7.2 million in total assets on their 2023 balance sheets.  Of that, $4.5 million (62%) was financed by liabilities (either short- or long-term) and the other $2.7 million (38%) by equity builders held in their companies.

Historical data show the average $7.2 million in total assets in 2023 was 23% lower than in 2020 ($9.4 million), and builders’ lowest asset level since 2010 ($6.2 million).  But perhaps more important than fluctuations in the size of their balance sheets, the data reveal a long-term decline in builders’ reliance on debt to finance their operations: in 2006, 74% of their assets were backed up by debt; by 2020, the share was down 10 points to 64%; and by 2023, it dropped to a record low of 62%. Logically, the latter means builders are using more of their own capital to run their companies, as illustrated by their equity share rising from 26% of assets in 2006 to 38% in 2023.

The NAHB Economics team will conduct a Cost of Doing Business Study for residential remodelers in the spring of 2025. If that is your firm’s primary activity, please consider participating in this confidential survey. We simply can’t produce benchmarks without your input.  To participate, please complete this form. A summary of the most recent profitability benchmarks for residential remodelers is available in this blog post.

Discover more from Eye On Housing

Subscribe to get the latest posts sent to your email.


This article was originally published by a eyeonhousing.org . Read the Original article here. .

Pin It
