Tag

Private

Browsing


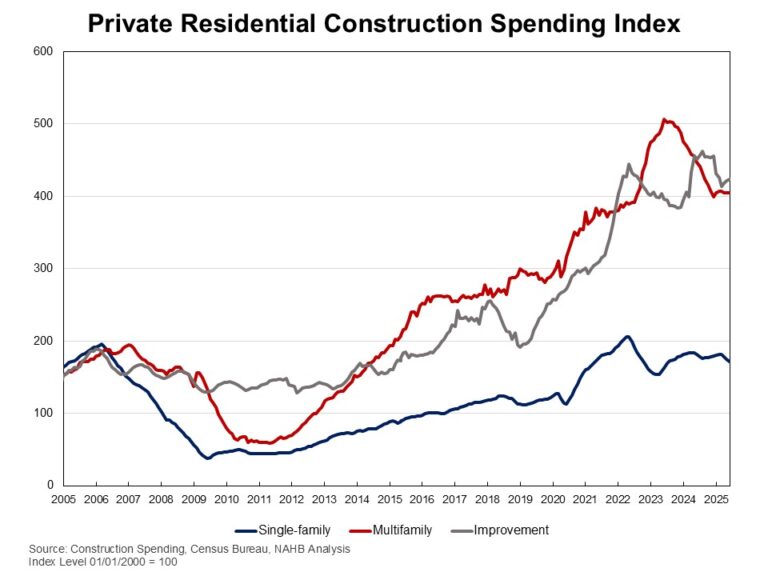
Private residential construction spending fell by 0.7% in June, marking the sixth straight month of decreases. This decline was primarily driven by reduced spending on single-family construction. Compared to a year ago, total spending was down 6.2%, as the housing sector continues to navigate the economic uncertainty stemming from ongoing tariff concerns and elevated mortgage rates. 

According to the latest U.S. Census Construction Spending data, single-family construction spending declined by 1.8% in June. This decrease aligns with the weak single-family starts in June and the third lowest reading of NAHB/Wells Fargo Housing Market Index (HMI) since 2012. Compared to a year ago, single-family construction spending decreased by 5.3%. Meanwhile, multifamily construction spending stayed flat for the month but continued to follow the downward trend that began in mid-2023. Compared to June 2024, multifamily spending was down 9.5%. Improvement spending (remodeling) was up 0.5% in June but was 6.1% lower on a year-over-year basis.  

The NAHB construction spending index is shown in the graph below. The index illustrates how   spending on single-family construction has slowed since early 2024 under the pressure of elevated interest rates and concerns over building material tariffs. Multifamily construction spending growth has also slowed down after the peak in July 2023. Additionally, improvement spending has been weakening since the beginning of 2025.


Meanwhile, spending on private nonresidential construction was down 4% over a year ago. The annual private nonresidential spending decrease was primarily driven by a $14.7 billion drop in the manufacturing category, followed by a $13.7 billion decrease in commercial construction spending.

Discover more from Eye On Housing

Subscribe to get the latest posts sent to your email.


This article was originally published by a eyeonhousing.org . Read the Original article here. .

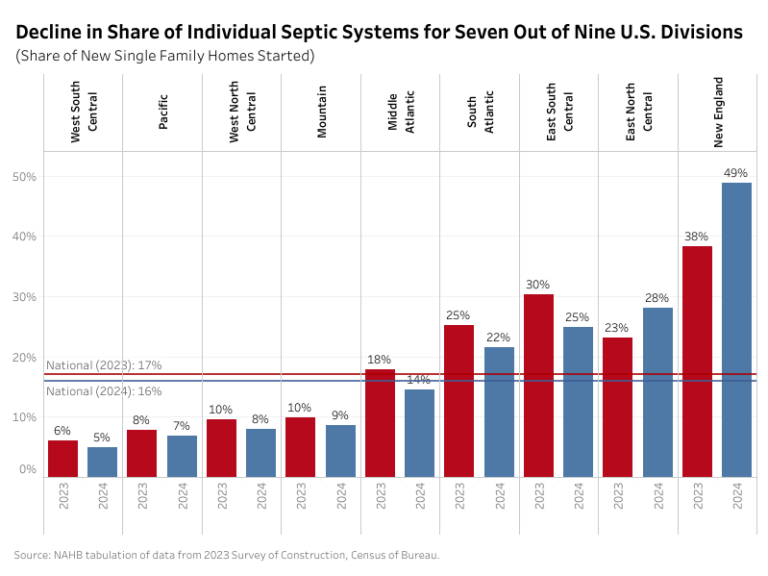
The share of new single-family homes built with individual septic systems declined slightly in 2024 compared to the previous year, while the share of homes served by private wells remained steady. According to NAHB’s analysis of the Census Bureau’s Survey of Construction (SOC), approximately 16% relied on individual septic systems, and 9% of new single-family homes started in 2024 were served by private wells.

Nationally, the majority of new homes were connected to public water systems – including community or shared supplies/wells – while 9% were built with private wells. This national share held steady from the previous year, though regional differences were notable. In New England, where median lot sizes are more than three times the national average, 37% of new single-family homes relied on private wells, making it the division with the highest rate in the nation. The East North Central division followed with 27%, while the Middle Atlantic stood at 13%. The South Atlantic region also exceeded the national average, with 11% of new homes using private wells. In stark contrast, private wells were uncommon in the East South Central and West South Central divisions, each accounting for just 1% of new homes started.

For sewage disposal, 84% of new single-family homes in 2024 were connected to public sewer systems, which include community or shared sewage/septic systems. The remaining 16% utilized individual septic systems, down slightly from 17% in the previous year. As with water sources, the usage of septic systems varied significantly by region.

New England led the nation with 49% of new homes using individual septic systems. The East North Central (28%), East South Central (25%), and South Atlantic (22%) divisions also reported shares above the national average. In contrast, lower usage was recorded in the Mountain (9%) and West North Central (8%) divisions, while the Pacific and West South Central divisions had the smallest shares, at 7% and 5%, respectively.

Compared to 2023, seven of the nine Census divisions experienced a decline in the use of individual septic systems with five of the divisions falling below the national average. New England and East North Central were the exceptions, recording increases of 11- and 5-percentage points, respectively, bringing their shares to 49% and 28% in 2024. However, these gains are not anomalies. In New England, the share had dipped to 38% in 2023, down from 46% in 2022. Similarly, East North Central’s share decreased from 27% in 2022 to 23% in 2023.    

Zooming out, the share of new homes built with individual septic systems has generally been on a decline across most regions since 2010. This trend has been slightly more pronounced in the three divisions (New England, East South Central and East North Central) with historically higher usage. The South Atlantic division stands out as an exception. While its share ranged from 13% to 17% in the early 2010s, it has steadily increased in recent years, and now exceeds 20%.

Discover more from Eye On Housing

Subscribe to get the latest posts sent to your email.


This article was originally published by a eyeonhousing.org . Read the Original article here. .

Private residential construction spending fell by 0.5% in May, marking the fifth straight month of decreases. This drop was primarily driven by reduced spending on single-family construction. Compared to a year ago, total spending was down 6.7%, as the housing sector continues to navigate the economic uncertainty stemming from ongoing tariff concerns and elevated mortgage rates.

According to the latest U.S. Census Construction Spending data, single-family construction spending declined by 1.8% in May. This decrease aligns with the third lowest reading of NAHB/Wells Fargo Housing Market Index (HMI) since 2012. Compared to a year ago, single-family construction spending decreased by 4.5%. Meanwhile, multifamily construction spending stayed flat for the month but continued to follow the downward trend that began in mid-2023. Compared to May 2024, multifamily spending was down 10.9%. Improvement spending (remodeling) was up 0.9% in May but was 7.8% lower on a year-over-year basis.

The NAHB construction spending index is shown in the graph below. The index illustrates how   spending on single-family construction has slowed since early 2024 under the pressure of elevated interest rates and concerns over building material tariffs. Multifamily construction spending growth has also slowed down after the peak in July 2023. Improvement spending has also been weakening since the beginning of 2025.

Spending on private nonresidential construction was down 3.9% over a year ago. The annual private nonresidential spending decrease was primarily driven by a $15 billion drop in commercial construction spending, followed by a $9.0 billion decrease in the manufacturing category.

Discover more from Eye On Housing

Subscribe to get the latest posts sent to your email.


This article was originally published by a eyeonhousing.org . Read the Original article here. .


Private residential construction spending fell by 0.9% in April, marking the third consecutive monthly decline. This decrease was primarily driven by reduced spending in single-family construction and home improvements. Compared to a year ago, total spending was down 4.8%, as the housing sector continues to navigate the economic uncertainty stemming from ongoing tariff concerns and elevated mortgage rates.

According to the latest U.S. Census Construction Spending data, single-family construction spending declined by 1.1% in April. This decrease aligns with the weakness in the April single-family starts and NAHB/Wells Fargo Housing Market Index (HMI). The April data ends seven months of growth in single-family construction spending, making it 2.2% lower than a year ago. Meanwhile improvement spending was down 0.8% in April and was 5.5% lower on a year-over-year basis. Multifamily construction spending edged down 0.1% in April, staying in the downward trend that began in December 2023. Compared to April 2024, multifamily spending was down 11.3%.

The NAHB construction spending index is shown in the graph below. The index illustrates how   spending on single-family construction has slowed since early 2024 under the pressure of elevated interest rates and concerns over building material tariffs. Multifamily construction spending growth has also slowed down after the peak in July 2023. Improvement spending has also been weakening since the beginning of 2025.

Spending on private nonresidential construction was up 1% over a year ago. The annual private nonresidential spending increase was mainly due to higher spending for the class of power ($7.9 billion), followed by the office category ($3.3 billion).

Discover more from Eye On Housing

Subscribe to get the latest posts sent to your email.


This article was originally published by a eyeonhousing.org . Read the Original article here. .


Private residential construction spending declined by 0.4% in March, largely driven by a decrease in home improvement spending. This decline followed five consecutive months of growth. Despite the monthly drop, spending remained 2.8% higher than a year ago, showing the resilience of the housing market.

According to the latest U.S Census Construction Spending data, improvement spending declined by 1.2% in March, aligned with the weakness in the Remodeling Market Sentiment of the first quarter of 2025. Still, spending on improvements was 13.4% higher than in March of 2024. Meanwhile, spending on single-family construction edged up by 0.1% in March, continuing its growth after a five-month decline from April to August 2024. However, single-family construction spending remained 0.8% lower than a year ago. Multifamily construction spending stayed unchanged in March, staying in the downward trends that began in December 2023. Compared to March 2024, it was down 12.1%.

The NAHB construction spending index is shown in the graph below. The index illustrates how   spending on single-family construction has slowed since early 2024 under the pressure of elevated interest rates and concerns over building material tariffs. Multifamily construction spending growth has also slowed down after the peak in July 2023. Meanwhile, improvement spending has increased its pace since late 2023.

Spending on private nonresidential construction was up 1.6% over a year ago. The annual private nonresidential spending increase was mainly due to higher spending for the class of power ($8.7 billion), followed by the manufacturing category ($8.1 billion).

Discover more from Eye On Housing

Subscribe to get the latest posts sent to your email.


This article was originally published by a eyeonhousing.org . Read the Original article here. .


Private residential construction spending increased by 1.3% in February, rebounding from a 1.2% dip in January. The growth was largely driven by higher spending on single-family construction and residential improvements. On a year-over-year basis, the February report showed a 1.6% gain, indicating a modest growth in private residential construction spending during market uncertainties. 

The monthly increase in total private construction spending was primarily driven by gains in spending on single-family construction and residential improvements. Single-family construction spending was up 1% for the month, continuing to grow after a five-month decline from April to August 2024. This growth is consistent with strong single-family housing starts in February. However, single-family construction spending remained 0.1% lower than a year ago. Meanwhile, improvement spending rose by 2% in February and was 8.9% higher compared to the same period last year. In contrast, multifamily construction spending stayed flat in February, extending the downward trend that began in December 2023. Compared to a year ago, multifamily construction spending was down 11.6%. 

The NAHB construction spending index is shown in the graph below. The index illustrates how   spending on single-family construction has slowed since early 2024 under the pressure of elevated interest rates and concerns over building material tariffs. Multifamily construction spending growth has also slowed down after the peak in July 2023. Meanwhile, improvement spending has increased its pace since late 2023.  

Spending on private nonresidential construction was up 2.5% over a year ago. The annual private nonresidential spending increase was mainly due to higher spending for the class of manufacturing ($10.5 billion), followed by the power category ($6.4 billion). 

Discover more from Eye On Housing

Subscribe to get the latest posts sent to your email.


This article was originally published by a eyeonhousing.org . Read the Original article here. .
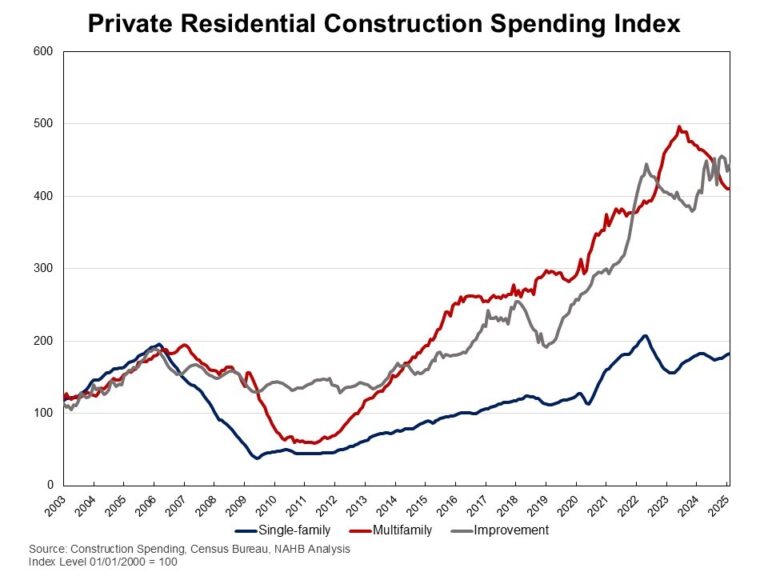

Private residential construction spending declined by 0.4% in January, largely driven by a decrease in multifamily construction and home improvement spending. This decline followed three consecutive months of growth, indicating a downward shift in the monthly data.  Despite the monthly drop, spending remains 3.1% higher than a year ago, showing the resilience of the housing market.

  According to the latest U.S Census Construction Spending data, multifamily construction spending fell by 0.7% for the month, extending the downward trends that began in December 2023. This decline aligns with the weakness in the Multifamily Production Index (MPI) and a lower number of multifamily homes under construction. Improvement spending declined by 1.5% in January but was 14.3% higher compared to the same period last year. Meanwhile, spending on single-family construction rose by 0.6% in January, continuing its growth after a  five-month decline from April to August. This growth also aligns with steady builder confidence seen in the Housing Market Index. However, single-family construction remained 0.9% lower than a year ago.

The NAHB construction spending index is shown in the graph below. The index illustrates how   spending on single-family construction has slowed since early 2024 under the pressure of elevated interest rates and concerns over building material tariffs. Multifamily construction spending growth has also slowed down after the peak in July 2023. Meanwhile, improvement spending has increased its pace since late 2023.

Spending on private nonresidential construction was up 1.8% over a year ago. The annual private nonresidential spending increase was mainly due to higher spending for the class of manufacturing ($12.4 billion), followed by the power category ($5.5 billion).

Discover more from Eye On Housing

Subscribe to get the latest posts sent to your email.


This article was originally published by a eyeonhousing.org . Read the Original article here. .


Private residential construction spending increased by 1.5% in December 2024, according to the latest U.S. Census Construction Spending data. It was the third consecutive monthly increase since September 2024.  On a year-over-year basis, the December report showed a 6% increase.

The monthly increase in total private construction spending was primarily driven by higher spending on single-family construction and residential improvements. Single-family construction spending was up 1% for the month. This marks a continuation of growth after a five-month decline from April to August, aligning with steady builder confidence seen in the Housing Market Index. However, single-family construction remained 0.8% lower than a year ago. Improvement spending rose by 2.6% in December and was 21.9% higher compared to the same period last year. In contrast, multifamily construction spending edged down 0.3% in December, following an 8.4% increase in October and a 0.8% up in November. Compared to a year ago, multifamily construction spending was still 10.5% lower.

The NAHB construction spending index is shown in the graph below. The index illustrates how   spending on single-family construction has slowed since early 2024 under the pressure of elevated interest rates. Multifamily construction spending growth has also slowed down after the peak in July 2023. Meanwhile, improvement spending has increased its pace since late 2023.

Spending on private nonresidential construction was up 2.3% over a year ago. The annual private nonresidential spending increase was mainly due to higher spending for the class of manufacturing ($23.6 billion), followed by the power category ($4.5 billion).

Discover more from Eye On Housing

Subscribe to get the latest posts sent to your email.


This article was originally published by a eyeonhousing.org . Read the Original article here. .


Private residential construction spending edged up by 0.1% in November 2024, according to the latest U.S. Census Construction Spending data. Year-over-year, the November report showed a 3.1% increase.

The monthly increase in total private construction spending was primarily driven by higher spending on single-family construction and residential improvements. Single-family construction spending inched up by 0.3% for the month. This marks a continuation of growth after a five-month decline from April to August, aligning with steady builder confidence seen in the Housing Market Index. However, single-family construction remained 0.7% lower than a year ago. Improvement spending rose by 0.4% in November and was 13.4% higher compared to the same period last year. In contrast, multifamily construction spending declined by 1.3% in November, following a 0.3% increase in October. Compared to a year ago, multifamily construction spending was still 9.5% lower.

The NAHB construction spending index is shown in the graph below. The index illustrates how   spending on single-family construction has slowed since early 2024 under the pressure of elevated interest rates. Multifamily construction spending growth has also slowed down after the peak in July 2023. Meanwhile, improvement spending has increased its pace since late 2023.

Spending on private nonresidential construction was up 1.7% over a year ago. The annual private nonresidential spending increase was mainly due to higher spending for the class of manufacturing ($23.4 billion), followed by the power category ($6.1 billion).

Discover more from Eye On Housing

Subscribe to get the latest posts sent to your email.


This article was originally published by a eyeonhousing.org . Read the Original article here. .


Private residential construction spending increased by 1.5% in October, according to the latest U.S. Census Construction Spending data. Year-over-year, the October report showed a 6.4% increase.

The monthly increase in total private construction spending was primarily driven by higher spending on residential improvements. Improvement spending surged by 2.7% in October and was 18.5% higher compared to the same period last year.

Spending on single-family construction inched up by 0.8% for the month. This marks a continuation of growth after a five-month decline from April to August, aligning with the rising builder confidence. Compared to a year ago, spending on single-family construction was 1.3% higher.

Meanwhile, multifamily construction spending ended its streak of ten consecutive monthly declines, edging up by 0.2% in October. Despite this slightly monthly gain, multifamily construction spending remained 6.8% lower compared to a year ago.

The NAHB construction spending index is shown in the graph below. The index illustrates how   spending on single-family construction has slowed since early 2024 under the pressure of elevated interest rates. Multifamily construction spending growth has also slowed down after the peak in July 2023. Meanwhile, improvement spending has increased its pace since late 2023.

Spending on private nonresidential construction was up 3.5% over a year ago. The annual private nonresidential spending increase was mainly due to higher spending for the class of manufacturing ($32.9 billion), followed by the power category ($6.4 billion).

Discover more from Eye On Housing

Subscribe to get the latest posts sent to your email.


This article was originally published by a eyeonhousing.org . Read the Original article here. .

Pin It