Tag

policy research

Browsing


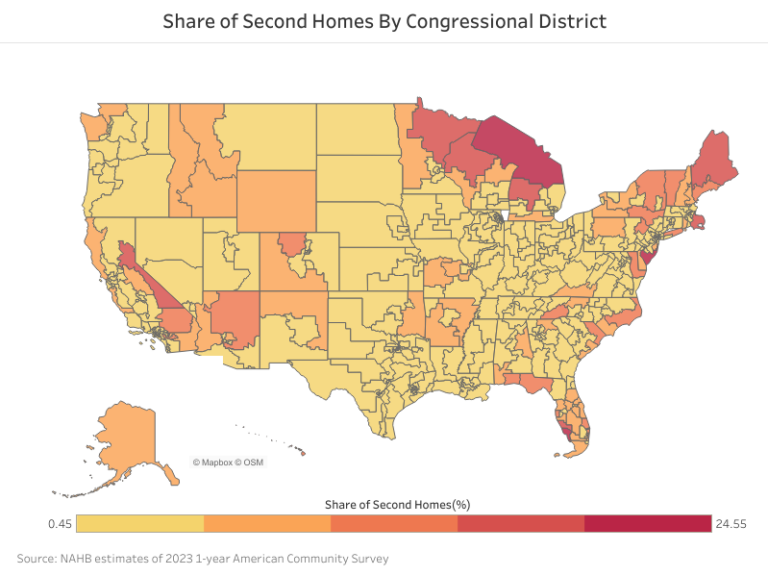
In 2023, the total number of second homes was 5.7 million, accounting for 4% of the total housing stock, according to NAHB estimates of the 2023 American Community Survey. Second homes have been in a steady decline over the past few years, from 7.15 million in 2020, to 6.5 million in 2022, dropping to 5.7 million in 2023.

The distribution of second homes across the U.S. reveals important geographic patterns, particularly when examined at the congressional district level. This analysis focuses on the number and the location of second homes qualified for or defined by the home mortgage interest deduction using the Census Bureau’s 2023 American community Survey (ACS). It does not account for homes held primarily for investment or business purposes.

Half of the nation’s second homes are concentrated in a small number of congressional districts, primarily in these states: Florida, California, New York, Texas, Michigan, North Caroline, Pennsylvania, and Arizona. Florida alone accounted for 15.8% of all second homes, with 16 out of its 28 congressional districts having more than 25,000 second homes each. Florida’s 19th Congressional District had the largest stock of second homes, with 123,853 units. In contrast, Wyoming’s At Large Congressional District had the smallest stock, with 17,623 second homes.

Analysis of congressional district data shows that second homes are not just concentrated in conventional coastal and resort areas. Second homes make up a significant portion of the housing stock in various districts across the country. Michigan’s 1st Congressional District had the highest share of second homes, with 24.5% of its housing stock qualified as second homes. Wisconsin’s 7th Congressional District had 82,755 second homes, almost 20% of its total housing stocks.

While some congressional districts have a higher percentage of second homes, many other congressional districts also show a notable prevalence of second homes. In 2023, 32 congressional districts in 17 states had at least 10% of housing units that were second homes. Of these congressional districts, 8 congressional districts were in Florida, 4 in New York, 3 in California, and 2 in Maine, Michigan, North Carolina, and 1 congressional district each in Arizona, Colorado, Hawaii, Maryland, Massachusetts, Minnesota, New Jersey, Pennsylvania, South Carolina, Vermont, Wisconsin.

NAHB estimates are based on the definition used for home mortgage interest deduction: a second home is a non-rental property that is not classified as taxpayer’s principal residence. Examples could be: (1) a home that used to be a primary residence due to a move or a period of simultaneous ownership of two homes due to a move; (2) a home under construction for which the eventual homeowner acts as the builder and obtains a construction loan (Treasury regulations permit up to 24 months of interest deductibility for such construction loans); or (3) a non-rental seasonal or vacation residence. However, homes under construction are not included in this analysis because the ACS does not collect data on units under construction.

Discover more from Eye On Housing

Subscribe to get the latest posts sent to your email.


This article was originally published by a eyeonhousing.org . Read the Original article here. .


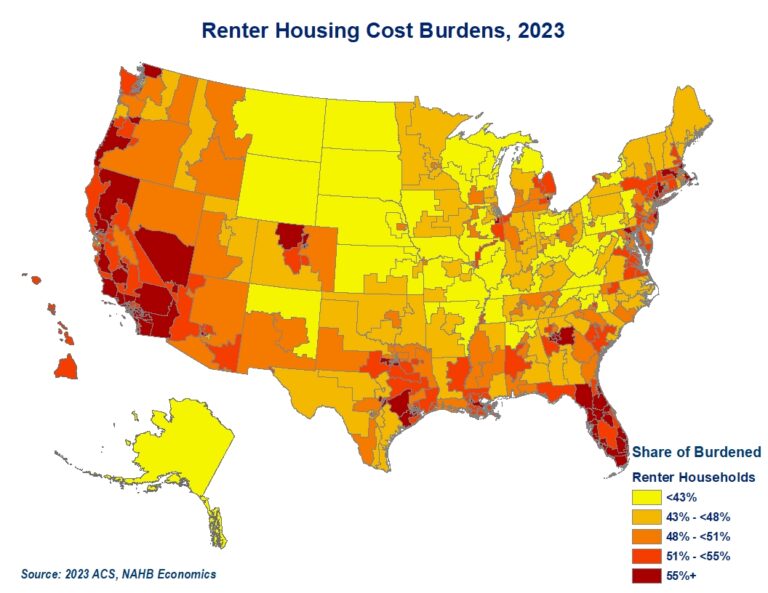
While the lack of affordable housing dominates the headlines across the nation, congressional districts with higher shares of renter households are disproportionately affected by the current affordability crisis. Geographically, the districts with the largest housing cost burdens are heavily concentrated in California, Florida, and the coastal Northeast.

Buoyed by significant home equity gains and locked in by below-market mortgages rates, current home owners are in a more advantageous financial position to weather the growing affordability crisis. At the same time, renters are facing the worst affordability on record. According to the latest 2023 American Community Survey (ACS), more than half of all renter households, or 23 million, spend 30 percent or more of their income on housing, and therefore are considered burdened by housing costs. Among home owners, the share of households that are cost burdened is less than a quarter (24%). Nevertheless, this amounts to 20.6 million owner households who experience housing cost burdens. As a result, congressional districts where housing markets are dominated by renters are more likely to register higher overall shares of households with cost burdens.

In a typical congressional district, about a third of all households, renters and owners combined, experience housing cost burdens. In contrast, in the ten congressional districts with the highest burden rates, more than half of all households spend 30% or more of their income on housing.

The highest burden rates are found in five districts each in California and New York and two in Florida (see the chart above). In New York’s 15th and 13th, 55% and 52% of households, respectively, are burdened with housing costs. The vast majority of these households are renters, as reflected by the low homeownership rates in these districts, 16% and 13%, respectively. Similarly, the remaining top 10 districts with the highest shares of burdened households have homeownership rates well below the national average of 65%. On the list, only Florida’s 20th and 24th have homeownership rates that exceed 50%. Since congressional districts are drawn to represent roughly the same number of people, higher shares typically translate into larger counts of cost burdened households. To capture any remaining differences, the size of the bubbles in the chart correlates with the overall number of burdened households.

On the rental side, nine out of eleven worst burdened districts are in Florida. Close to two thirds of renters in Florida’s 26th, 20th, 25th and 19th are burdened with housing costs. The renter burden rates are similarly high in Florida’s 28th, 21st, 24th, 13th, and 23rd, where the shares of housing cost burdened renters are between 63% and 64%. Only California’s 27th and 29th register slightly higher burden shares exceeding 64%. At the other end of the spectrum is Wisconsin’s 7th, where just a third of renter households experience housing cost burdens.

Florida, New York, and California stand out for simultaneously having congressional districts with the highest shares of cost burdened renters and owners. The heaviest owner burden rates dozen consists of five congressional districts in New York and California each and two in Florida. In New York’s 9th and 8th districts, 43% and 42% of home owners, respectively, spend 30% of more of their income on housing. While high property taxes contribute heavily to owners’ burden in New York and California, fast rising insurance premiums strain home owners’ budgets in Florida.

The list of congressional districts with the lowest ownership burden rates include Alabama’s 5th, West Virginia’s 1st and 2nd, North Dakota’s at-Large, South Carolina’s 4th, Indiana’s 4th, 5th, and 6th, Arkansas 3rd, Tennessee’s 2nd, Missouri’s 3rd and 6th. Less than 17% of home owners in these districts spend 30% of their income or more on housing.

Additional housing data for your congressional district are provided by the US Census Bureau here.

Discover more from Eye On Housing

Subscribe to get the latest posts sent to your email.


This article was originally published by a eyeonhousing.org . Read the Original article here. .


Nationally, nearly 140 million people in the United States routinely commuted to work, according to NAHB analysis of the 2023 American Community Survey data. Among these people, approximately 23.8 million people spent more than 90 minutes each day going to and from their place of employment, and nearly 12.5 million commuters traveled at least 120 minutes daily.

According to the Nobel Prize winner Daniel Kahneman’s research (2004), “commuting to work” was one of the least enjoyable activities and was most frequently associated with negative feelings during the day. While much research has revealed that longer commute times are associated with lower happiness and well-being, research by political scientists Benjamin Newman, Joshua Johnson, and Patrick Lown found that commuting significantly decreases political participation. People with long commute times are less involved in politics.

As the presidential election approaches, it is worth noting the variation in commute times across congressional districts. By analyzing the data from the American Community Survey (ACS) 1-year estimates, we summarize trends in the mean travel time among U.S. workers between 2010 and 2023 and also provide a deeper understanding of geographic patterns and the variation in commute times across congressional districts. In this article, “mean travel time to work” is calculated by dividing the total one-way commute time by the number of workers who commute. It indicates the average time workers spend traveling from home to work daily.

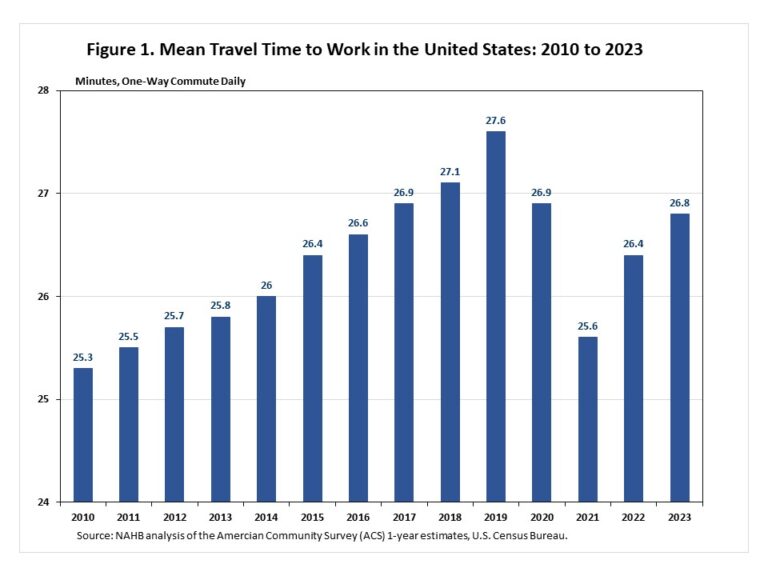
From 2010 to 2019, the mean travel time to work in the United States increased every year. In 2021, the COVID-19 pandemic led to a significant increase in remote work, meanwhile, the mean travel time to work decreased dramatically. Since then, the mean travel time to work increased by 1.2 minutes to 26.8 minutes in 2023 but remained below its historic high of 27.6 minutes in 2019.

Commute times vary across congressional districts and show geographical patterns. The map above illustrates the variation in the mean travel time to work in 2023 by five categories from light teal to dark blue (data is not available for Texas’s 27th congressional district). The lightest teal represents these congressional districts where people spend 17.2 – 19.9 minutes traveling to work daily, while the dark blue marks these congressional districts where people spend 35 minutes or more traveling to work daily, on average.

Noticeably, most people in the Mountain and West North Central Divisions have smaller travel times than those in the coastal states. In the least mean travel time category (between 17.2 and 19.9 minutes), there are 12 congressional districts in total. These include two congressional districts in both Nebraska and Iowa, one in Kansas, Texas, Montana, and Oregon, and four at-large congressional districts in South Dakota, North Dakota, Wyoming, and Alaska. Nebraska’s 3rd congressional district, one of the largest non-at-large districts in the United States, had the least mean travel time to work among all 436 congressional districts. People from Nebraska’s 3rd district spent only 17.2 minutes traveling to work on average and 80% of them drove alone to work. It was followed by Kansas’s 1st congressional district and Texas’s 19th congressional district.

Within the top mean travel time category, people spend 35 minutes or more traveling to work daily. It includes 12 congressional districts in New York, three in California, two in Maryland, and one in both Virginia and New Jersey.

It is no surprise that New York had the longest commute time in the United States. The mean travel time to work was 32.8 minutes daily, on average. Out of 26 congressional districts in New York, 18 of them had higher mean travel time to work than the national average of 26.8 minutes. The top eight congressional districts with the highest mean travel time to work were all in New York.

A larger share of people who worked outside their county of residence partially explains longer commute times in congressional districts where people spent 35 minutes or more traveling to work daily. For example, New York’s 5th congressional district, with the highest mean travel time to work of 45.5 minutes, reported that 45.3% of people worked outside their county of residence. Meanwhile, congressional districts in the least mean travel time category reported a significantly smaller share of people who worked outside their county of residence. Only 18% of people in Nebraska’s 3rd congressional district worked outside their county of residence. The majority of people in these districts worked in their county of residence.

Housing is a key issue for long commute times as it affects the distance between home and work. The results from NAHB’s HBGI showed that since the beginning of the COVID-19 pandemic housing demand has shifted from higher-density core areas to low-density markets, where homes are larger and more affordable. Additionally, a published study (2022) found that lack of affordable housing increased commute times as people moved to lower-cost housing in the outer reaches of major metro areas. To reduce commute times, the authors suggest creating and preserving dedicated affordable housing units, changing zoning to allow for more housing development, relaxing housing regulations to facilitate higher-density development, increasing government housing subsidies, and adopting tenant protections.

Additional data for your congressional district are provided by the US Census Bureau here.

Discover more from Eye On Housing

Subscribe to get the latest posts sent to your email.


This article was originally published by a eyeonhousing.org . Read the Original article here. .


Homeownership is an important voter issue for the upcoming election with both presidential candidates putting forth housing policies to tackle the housing affordability crisis. In a recent NAHB post, the national homeownership rate sat at 65%, but there are large disparities in homeownership when broken down by race. For Black/African American households, the homeownership rate was 45%. Hispanic/Latino households fared slightly better at 51%, while all other minority households had a homeownership rate of 55%.

According to the 2023 American Community Survey (ACS), the district with the highest homeownership rate for Black/African American households was Maryland’s 5th District at 80%, although the overall homeownership rate for this district was slightly higher at 82%. In this district, 43% of the households were Black/African American. On the opposite spectrum, California’s 34th District had the lowest Black/African American homeownership rate in the nation at just 5%. This district also had one of the lowest overall homeownership rates in the country at 22%. The table below highlights the top five districts where Black/African American homeownership is the highest.

Congressional DistrictBlack/African American Homeownership RateOverall Homeownership RateShare of PopulationMaryland, District 580%82%43%New York, District 475%81%16%California, District 4172%75%5%Virginia, District 1072%79%8%Florida, District 2171%79%11%Source: 2023 American Community Survey and NAHB calculations.

The top 3 districts with the highest homeownership of Hispanics/Latino households were in the Midwest. Michigan’s 1st District held the highest homeownership rate for the Hispanics/Latino households (78%), although they constituted for 2% of the district’s population. The overall homeownership rate for the district was slightly higher (80%), however, in Texas’ 23rd District, Hispanics/Latino’s homeownership rate was slightly higher than the overall district rate at 75% compared to 74%. In this district, Hispanics/Latinos formed a significant portion of the population, accounting for nearly 60%.

Congressional DistrictHispanic/Latino Homeownership RateOverall Homeownership RateShare of PopulationMichigan, District 178%80%2%Minnesota, District 676%81%3%Illinois, District 1676%80%5%Arizona, District 975%77%22%Texas, District 2375%74%58%Source: 2023 American Community Survey and NAHB calculations.

For all other minority households, Minnesota’s 6th District stood out with the highest homeownership rate at 85%. This rate also exceeded the overall homeownership rate for this district of 81%. In fact, the top 10 congressional districts with the highest homeownership rate for this group exceeded the district-wide homeownership rates. Tennessee’s 8th District, which has the second-highest minority homeownership rate at 83%, surpassed the overall district rate by 11 percentage points.

Congressional DistrictAll Other Race Homeownership RateOverall Homeownership RateShare of PopulationMinnesota, District 685%81%4%Tennessee, District 883%72%2%Virginia, District 1083%79%19%Texas, District 2281%76%20%Illinois, District 1481%76%12%Source: 2023 American Community Survey and NAHB calculations.

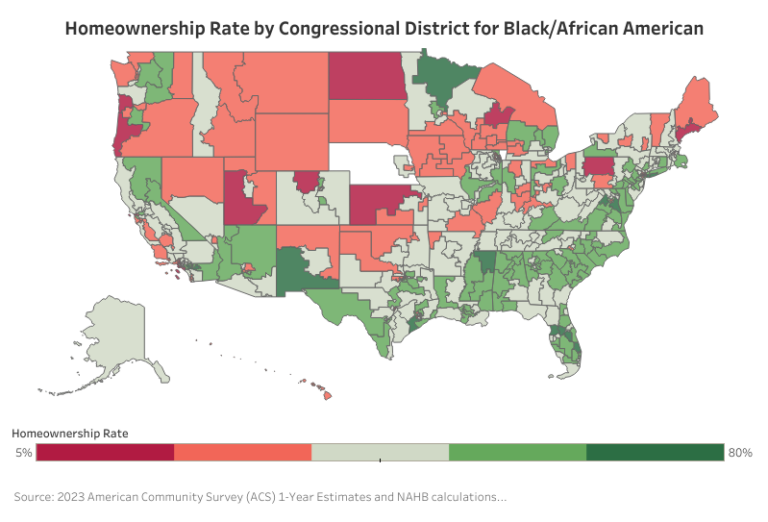
There were also significant geographical variations of homeownership rates between each racial group with Black/African American households experiencing the largest variations across the country. Black/African American homeownership was concentrated in southern states while notably lower in the Midwest, Mountain West, and parts of the Northeast. In contrast, Hispanic/Latino homeownership tended to be higher in Southwest districts, while other minority groups maintained stronger rates nationwide.

Overall, a consistent geographical pattern of homeownership across minority households can be found. For example, North Dakota and neighboring districts stood out with much lower minority homeownership. On the other hand, Southern states, where median sale prices per square foot for single-family detached homes were below the national average of $150, generally exhibited higher rates of minority homeownership.

Additional housing data for your congressional district are provided by the US Census Bureau here.

Footnote(s):

Discover more from Eye On Housing

Subscribe to get the latest posts sent to your email.


This article was originally published by a eyeonhousing.org . Read the Original article here. .


Nearly 1.3 million tax returns filed for tax year 2023 utilized the Residential Clean Energy Credit (25D tax credit), according to the latest IRS clean energy tax credit statistics. Through May 23rd of the 2024 tax filing season for 2023 returns, almost 138 million tax returns had been filed with the IRS, which indicates that 0.9% of returns filed utilized the 25D credit. Both 25C (Energy Efficient Home Improvement Credit) and 25D are claimed on Form 5695, as both are residential energy tax credits. A previous blog discussed the 25C credit, while this one focuses on the 25D credit. The two credits main difference is that 25C relates to improvements that make homes more energy efficient, while 25D is focused on investments associated with renewable energy in the home. The 25D credit is an annual credit that taxpayers may claim for investing in renewable energy for their residence, such as solar, wind, geothermal, fuel cells or battery storage technology.

The 25D tax credit allows home owners to claim qualifying residential clean energy expenditures made to their primary or secondary residence. Renters can also claim the credit for certain residential clean energy expenditures made to their residence while landlords cannot. Additionally, 25D can be applied to newly constructed homes as well as existing homes. The 25D credit amount is based on 30% of the clean energy expenditure and, unlike 25C, has no credit limit with one exception— the credit for fuel cell property expenditures is 30% up to $500 for each half kilowatt of capacity for the qualified fuel cell property. The 30% credit amount will fall to 26% in 2033 and 22% in 2034. Taxpayers can also include installation costs in the calculation of their credit amount.  While the credit is non-refundable, taxpayers can carryforward the credit to reduce their tax liability in future years. Clean energy property must meet certain standards to qualify for the credit. For example, geothermal heat pumps must meet Energy Star requirements at the time of purchase.

Cost of Energy Property and Usage

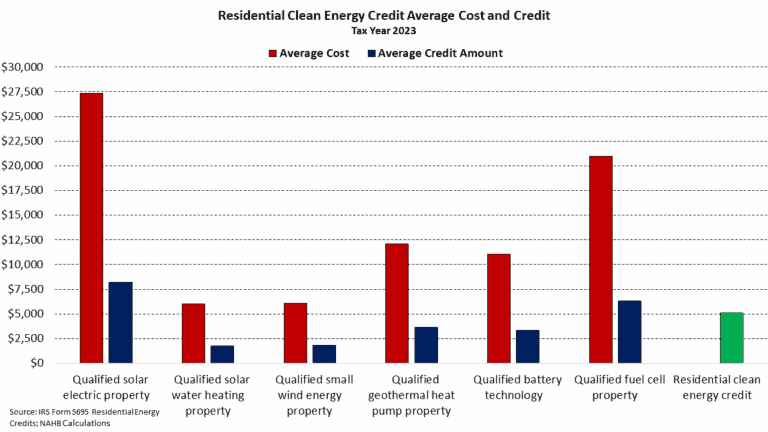
The recent IRS data indicates that the most expensive clean energy investment claimed in tax year 2023 was the purchase and installation of qualified solar electric property at an average cost of $27,355. Shown below are the average cost and average credit (30% of cost) across each investment, while the average credit amount across all returns that claimed 25D is shown in green at $5,084. While not shown below, the average credit claimed in 2023 that was carryforward from a previous year was $7,019 and the average credit carryforward to next year was $7,464. Both carryforward credits were higher than the average credit amount claimed in 2023.

Solar electric property was also by far the most frequently claimed investment at 752,300 returns. The next highest claimed investment was qualified solar water heating property, with 139,130 returns. No other improvement appeared on over 100,000 returns. The qualified improvement that was least claimed on tax returns was fuel cell property, with only 35,850 returns. Fuel cell property is the only expenditure subject to a cap.

Income and Geographic Differences

The Residential Clean Energy Credit is not subject to income limitations, meaning any taxpayer regardless of income can claim the credit on their tax return. The income level that most frequently claimed the credit was between $500,000 and $1,000,000 at 1.99%. Given the average cost of each improvement, it comes as little surprise that lower incomes claim the credit less frequently.

Geographically, the highest claim rate of the 25D tax credit was in Nevada, with 2.0% of returns claiming the credit. Florida had the second highest claim rate at 1.8%. The lowest claim rate was in North Dakota, at just 0.2%. Of note, higher usage rates of the 25D tax credit are found in states in the southwest, with Nevada (2.0%), Arizona (1.6%), Texas (1.6%), California (1.6%), and New Mexico (1.5%) all ranking in the top ten. This may be due to their significantly higher exposure to the sun, leading to higher potential benefits from installing solar electric property.

New Hampshire had the highest average credit amount at $7,581. This was $500 more than the second highest state which was Hawaii at $7,055. The lowest average credit amount was in Mississippi, at $2,248.

Discover more from Eye On Housing

Subscribe to get the latest posts sent to your email.


This article was originally published by a eyeonhousing.org . Read the Original article here. .


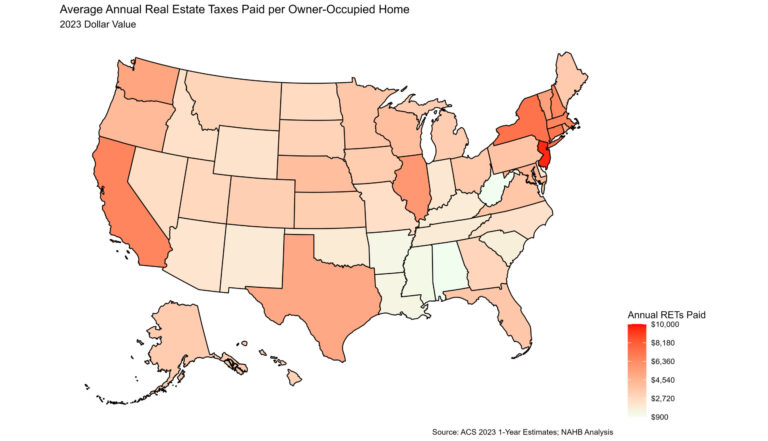
Nationally, across the 86 million owner-occupied homes in the U.S., the average annual real estate taxes paid in 2023 was $4,112, according to NAHB analysis of the 2023 American Community Survey. Homeowners in New Jersey continued to pay the highest real estate taxes, paying an average of $9,572, 30.6% higher than the second highest, New York, at $7,329 . On the other end of the distribution, homeowners in Alabama paid the lowest average amount of real estate taxes at $978. The map below shows the geographic variation of average annual real estate taxes (RETs) paid.

Compared to 2022, every state saw increases in the average amount of real estate taxes paid. The largest percentage increase was in Hawaii, up 21.1% from $2,541 to $3,078.  The smallest increase was in New Hampshire, up 1.1% from $6,385 to $6,453.

Average Effective Property Tax Rates

While average annual real estate taxes paid is important, it provides an incomplete picture. Property values vary across states, which explains some, if not most, of the variation across the nation in average annual real estate taxes. To control for property values and create a more informative state-by-state analysis, NAHB calculates the average effective property tax rate by dividing aggregate real estate taxes paid by aggregate value of owner-occupied housing within each state. For example, the aggregate real estate taxes paid across the U.S. was $352.3 billion with an aggregate value of owner-occupied real estate totaling $38.8 trillion in 2023. Using these two amounts, the average effective property tax rate nationally was $9.09 ($352.3 billion/$38.8 trillion) per $1,000 in home value. This effective rate can be expressed as a percentage of home value or as a dollar amount taxed per $1,000 of a home’s value. The map below displays the effective rate by state below.  

Illinois, a change from New Jersey in 2022 , had the highest effective property tax rate at $18.25 per $1,000 of home value. Consistent with 2022, Hawaii had the lowest effective property tax rate at $3.18 per $1,000 of home value. Additionally, Hawaii had the largest increase over the year, up 18.8% from $2.68 in 2022. Twenty states saw their effective property tax rates fall between 2022 and 2023, with the largest decrease occurring in West Virginia where it fell 6.0%, from $5.06 to $4.75 per $1,000.

Intrastate Variation: Examples from New York

While property taxes clearly vary by state, there also exists variation within states themselves. The latest county level data available comes from 2022 5-year ACS estimates. Analyzing these data , New York showed the highest degree of variation of average property taxes paid and effective real estate tax rates across the counties of any state. Home owners in Westchester County on average paid $14,156 in real estate taxes in 2022, the highest of any county in New York. The lowest amount was in Hamilton County, where home owners paid on average $2,827 in real estate taxes.

For effective property tax rates, New York continues to tell the story of intrastate variation. As shown above, Westchester County paid the higher average annual real estate taxes in 2022, but looking at effective property tax rate, which accounts for home value, Westchester’s effective property tax rate is near the middle at $18.34.  Home owners in Monroe County seem to get the short end of the stick, paying at a rate of $26.27 per $1,000 of home value, the highest in New York. The lowest effective property tax rate was in Kings County, paying a mere $5.30 per $1,000 of home value in taxes.

Discover more from Eye On Housing

Subscribe to get the latest posts sent to your email.


This article was originally published by a eyeonhousing.org . Read the Original article here. .


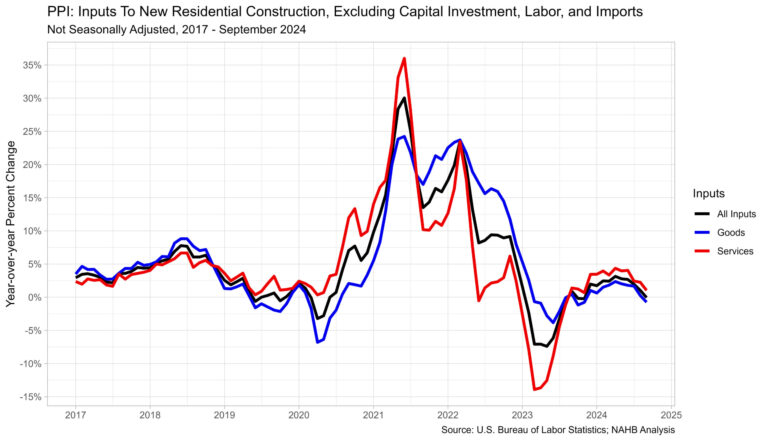
Prices for inputs to new residential construction—excluding capital investment, labor, and imports—decreased 0.6% in September according to the most recent Producer Price Index (PPI) report published by the U.S. Bureau of Labor Statistics. Compared to a year ago, this index was down 0.1% in September after an increase of 1.0% in August.

The inputs to new residential construction price index can be broken into two components­—one for goods and another for services. The goods component decreased 0.7% over the year, while services increased 1.0%. For comparison, the total final demand index increased 1.8% over the year in September, with final demand goods down 1.1% and final demand services up 3.1% over the year.

Input Goods

The goods component has a larger importance to the total residential construction inputs price index, around 60%. The price of input goods to residential construction was down 0.7% in September from August. The input goods to residential construction index can be further broken down into two separate components, one measuring energy inputs with the other measuring goods less energy inputs. The latter of these two components simply represents building materials used in residential construction, which makes up around 93% of the goods index.

Prices for inputs to residential construction, goods less energy, were up 1.5% in September compared to a year ago. This year-over-year growth has continued to slow since April when it was at 2.5% and remains well below growth in September of 2022 when it was at 14.3%. The year-over-year growth in September 2023 was 1.0%, making this year’s growth slightly higher. The index for inputs to residential construction for energy fell 23.5% in September, the largest yearly decrease since 26.1% in July 2023.

The graph below focuses on the data since the start of 2023 for residential goods inputs. Energy prices have retreated over the past year, with only two periods of growth in 2024.

Input Services

Prices of inputs to residential construction, services, fell 0.5% in September from August. The price index for service inputs to residential construction can be broken out into three separate components: the trade services component, the transportation and warehousing services component, and the services less trade, transportation and warehousing component. The most vital component is trade services (around 60%), followed by services less trade, transportation and warehousing (around 29%), and finally transportation and warehousing services (around 11%). The largest component, trade services, compared to last year was up 0.4% in September after increasing 2.1% in August.

Discover more from Eye On Housing

Subscribe to get the latest posts sent to your email.


This article was originally published by a eyeonhousing.org . Read the Original article here. .


Approximately 2.3 million tax returns filed for tax year 2023 utilized the Energy Efficient Home Improvement credit (25C tax credit), according to the latest IRS clean energy tax credit statistics. Through May 23rd of the 2024 tax filing season for 2023 returns, almost 138 million tax returns had been filed with the IRS, which indicates that 1.7% of returns filed utilized the 25C credit. There are various types of improvements that can be claimed under the 25C credit; each improvement varies in its cost and credit amount. Additionally, claim rates of the 25C tax credit varies across taxpayers’ incomes as well as geographies. This post examines these data.

The 25C tax credit allows homeowners to claim qualifying energy efficiency improvements to their primary or secondary residence. Renters can also claim the credit for certain energy efficient appliance and product expenditures. The 25C credit amount is based on 30% of the improvement’s cost and is subject to the improvement’s specific credit limit. For improvements such as electric or natural gas heat pumps, heat pump water heaters, or biomass stoves/boilers, the credit limit per year is $2,000. All other home improvements, such as efficient AC units, insulation/air sealing or home energy audits are limited to a combined credit limit of $1,200, with individual limitations for each item. The total annual credit amount that can be claimed is $3,200 per year. The table below from the Department of Energy shows the available tax credit amounts for tax years 2023 through 2032.

Cost of Improvement and Usage

The credit can cover both the purchase and installation costs for heat pumps, energy efficient AC units, furnaces/ boilers, water heaters, biomass stoves/ boilers, and electric panel/circuit board upgrades. For building envelope components (insulation, doors, windows, skylights), only the purchase can be covered.

The recent IRS data indicates that the most expensive improvement claimed in tax year 2023 was the purchase and installation of electric or natural gas heat pumps at an average cost of $11,213. The costliest item that did not cover installation costs was exterior windows and skylights at $9,143.

Shown below in orange are the average costs for each 25C improvement item in the IRS data. In blue is the credit amount of each improvement, based on its average cost and applicable credit limits. For almost all items, 30% of the improvement’s cost far surpass the credit limit amounts. The only exceptions are heat pump water heaters and biomass stoves/broilers that on average do not exceed the credit limit.

For example, the average cost of installation and purchase of a biomass stove/broiler was $5,221. Taking 30% of this cost, we find a credit amount of $1,566, which is below the credit limit of $2,000 for this improvement. Compared with the costliest improvement, electric or natural gas heat pumps, 30% of the average cost is $3,364. This is above the credit limit, making the largest possible credit amount $2,000 for electric or natural gas heat pumps installation and purchase. The average credit amount, shown below in purple, was $882, well below the maximum possible credit limit of $3,200, shown in light purple.

Of the 2.3 million taxpayers that claimed the 25C credit, the most frequent improvement was the purchase of insulation or air sealing materials or system with 699,440 returns (29.9%). This improvement is the only item to the combined cap of $1,200 that also has an individual limit of $1,200. Improvements that have a combined limit of $1,200 are in the green shaded box below. The least claimed improvement was home energy audits, which also had the lowest credit limit of $150.

Income and Geographic Differences

The highest claim rate of the 25C credit by income was for taxpayers in the $200,000-$500,000 income range, with 4.83% of returns claiming a 25C tax credit. The lowest was for incomes between $1-$10,000, as 0.02% of returns claimed the credit.

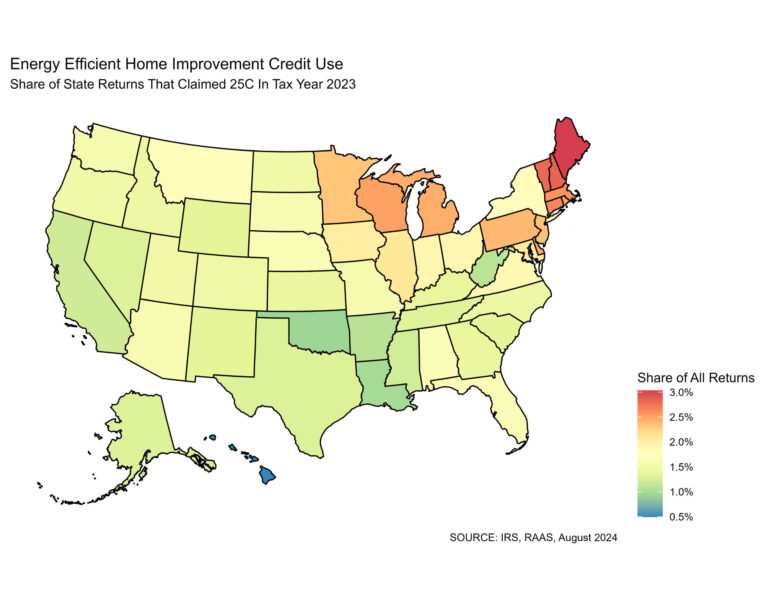
Geographically, the highest claim rate of the 25C tax credit was in Maine, with 3.03% of tax returns in the state claiming 25C. The lowest rate was in Hawaii, where only 0.50% of returns claimed the credit. Usage was significantly higher in the Midwest and Northeast, as the top 10 usage rates were all located in these regions.

While Maine has the highest claim rate, Washington had the highest average credit amount at $1,191. The lowest average credit amount was in Iowa, at $743. Of particular note, Michigan and Wisconsin had low average credit amounts but were among the top ten in terms of claim rates. In Michigan, the average credit amount was $747, ranking 49th (includes DC), while the claim rate was 9th at 2.45%. In Wisconsin, the average credit amount was $761, ranking 48th, and the claim rate was 6th, at 2.51%. The reasoning for this trend could be due to the type of improvements by region but there is no IRS data published yet to clarify this hypothesis.

Additionally, usage rates could be relatively lower in the Southern portion of the U.S. because the costliest items, such as heat pumps, are not as critical as regional weather is warmer. Since this credit cannot be applied to new construction, it should also be noted that most new homes are being built with central AC, making it less likely to be claimed as a 25C improvement. Also, most homes in the North are built without heat pumps which allows for more opportunity for the cost to be claimed under 25C if such improvement is made. Nationally, the claim rate was 1.7% with an average credit amount of $882.

Discover more from Eye On Housing

Subscribe to get the latest posts sent to your email.


This article was originally published by a eyeonhousing.org . Read the Original article here. .


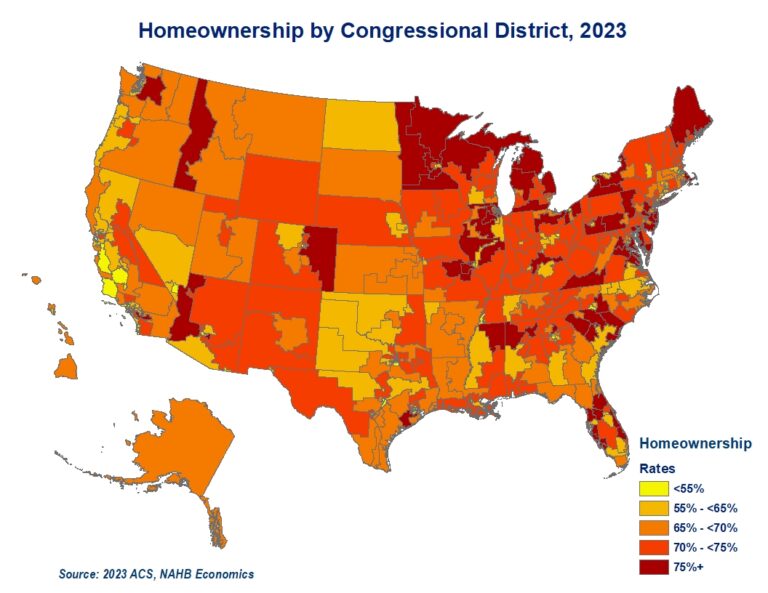
With housing being a key issue for the 2024 election cycle, it is worth analyzing distinct characteristics as well as similarities that housing markets in congressional districts share. The differences start with a substantial variation in homeownership rates across congressional districts.

While the 2023 American Community Survey (ACS) reports that close to two thirds of US households (65.2%) are home owners, there are forty congressional districts where renter households represent the majority. In twelve of these districts, renters account for more than two thirds of households. This list includes eight urban high-density congressional districts in New York, three districts in California and New Jersey’s 8th congressional district. The pattern of urban congressional districts registering lower home ownership rates repeats across the country.

At the other end of the spectrum, there are seven congressional districts with home owners representing over 80% of households. These include three districts in Michigan, two in New York, and one in both Maryland, and Minnesota.

New York stands out with simultaneous congressional districts with the lowest and second highest homeownership rates. Close to 84% of households in New York’s 1st district located in eastern Long Island are home owners. The only other congressional district that registers a higher homeownership rate is Michigan’s 9th congressional district located in the Thumb at 85%.   In contrast, in New York’s urban 13th and 15th districts, home owners comprise a minority of less than 16% and 13%, respectively.

California is another example of substantial variation of homeownership rates across congressional districts within a state. In California’s 41st district in Riverside County, 3 out of 4 households are home owners. At the same time, in California’s 34th district in the city of Los Angeles, only 22% of households live in a home they own. 

Population density, racial and ethnical makeup, as well as varying cost of ownership, all contribute to substantial variation in homeownership rates across the US congressional districts.

Additional housing data for your congressional district are provided by the US Census Bureau here.

Discover more from Eye On Housing

Subscribe to get the latest posts sent to your email.


This article was originally published by a eyeonhousing.org . Read the Original article here. .


Housing affordability continues to worsen due to a persistent supply shortage and higher interest rates. While the rising building material costs and higher rates on construction loans are often blamed for the lack of housing supply, government regulations also play a significant role in increasing costs. For instance, rent control policies are introduced with the aim of limiting rent growth to keep housing affordable. However, a recent NAHB analysis shows that, rent control policies had some unintended and undesirable consequences including reduced housing supply, higher rents in uncontrolled units, lower quality in the controlled units and reduced residential mobility.

Similarly, the rise of short-term rental (STR) is commonly seen as another factor reducing housing supply and worsening affordability as owners choose to convert long-term rentals into short-term rentals, and profitability of STRs attracts investors to purchase properties for this purpose. As a result, regulations on short-term rentals have been widely discussed as a tool to intervene in the housing market. A recent working paper title ‘The Effects of Short-Term Rental Regulation: Insights from Chicago[1]’ provides a detailed analysis of the impacts of these regulations in Chicago, the first city in the United States to regulate short-term rentals.

Chicago enacted STR regulations in June 2016 with the aim of addressing concerns related to public safety and affordable housing while allowing STRs to continue operating. The regulation requires hosts to obtain the proper licenses and registrations before listing their property. In March 2017, Chicago started requiring Airbnb to share data to enhance its enforcement capability.

With this background, the paper aimed to examine the impact of STR regulations in Chicago from three perspectives: the number of listings, the economic impact in terms of revenue, and the effect on crime rates. The paper found that the number of short-term rental listings in Chicago decreased by 16.4% compared to before the legislation, but the impact was significant only after March 2017, when data-power enforcement began. This decline in listings potentially benefited the hotel business and led to a drop in Airbnb revenue and tax revenues for the local government, even though beforehand, the local government raised the lodging tax rate on STRs. Although STRs are usually connected to negative externalities, this paper suggested that the regulations had little impact on reducing the number of common crimes. Only areas near buildings that prohibited STRs saw a significant decline in burglaries.

Key Findings:

Effect on Listing Availability

By comparing Chicago with Atlanta, Boston and Los Angeles between January 2016 to May 2018, the number of STR listings did not significantly decrease until the data-powered enforcement was introduced in March 2017. This led to a 16.4% decline in active listings in Chicago. Both professional and full-time individual hosts saw a roughly 10% decline in the probability of being active. However, professional hosts reacted more slowly but were more flexible, as they were able to switch between long-term and short-term rentals to maintain operations.

As the STR regulation required hosts to register and comply with rules such as providing insurance and meeting safety standards, the paper found that registration in Chicago increased from 53.2% in December 2020 to 74.4% in 2023. However, the progress was slow due to a loophole that allowed pending listings to operate until June 2021.

In Chicago, local restrictions can be stricter than citywide regulations. For example, the Prohibited Buildings Listing (PBL), which strictly bans STRs in buildings  effectively reduced STR  listings, particularly for full-time individual hosts. The chance of being active decreased by 55% for full-time individual hosts and 45% for professional hosts. Additionally, the Restricted Residential Zone (RRZ), which allows areas to ban new STRs if at least 25% of voters agree, further reduced listings by blocking new entries and pushing some existing out.

2. Economic Impact of STR ordinance

Despite the decline in the number of active listings due to the implementation of regulations, the economic performance of remaining listings did not see a significant change. For listings managed by professional and full-time individual hosts, prices, revenue per listing and the number of reservation days remained almost unchanged. This suggested that the remaining listings did not suffer financial loss.

However, the overall decline in listing numbers led to a decrease in Airbnb’s Gross Book Value (GBV) as well as local government tax revenue. The decline was more noticeable in areas with a higher density of hotels, where listings managed by professional and full-time individual hosts saw their GBV drop by 38.1% and 30.6% respectively. This suggested hotel businesses could benefit from the regulations.

Though the lodging tax (for STRS) was increased from 4% to 6% in 2018, the local government’s tax revenue from STRs still declined by 3.6% due to the decrease in number of active listings.

3. Impact on Local Crime

One of the most common concerns about STRs is the negative externalities on local residents, particularly an increase in local crime and potentially lowering property values. However, when comparing Chicago with Atlanta and Los Angeles, crime rates (theft, burglary, assault and robbery) in Chicago remained almost the same after the implementation of regulations. Within Chicago, the PBL restrictions did not have significant impact on the overall number of these common crime incidents, except for burglary. In areas with PBL restrictions, the number of burglary cases decreased by 12.4%.

Conclusion

Based on the findings, the paper concludes that data-driven enforcement significantly helped the government to effectively implement regulations. Although these regulations reduced the number of listings and resulted in a smaller amount of revenue, the city did not see a significant decline in citywide crime rates.

As the short-term rentals often compete with traditional hotels, the regulations appear to have limited effects on improving housing affordability. A similar outcome was observed in New York City, where stricter regulations introduced in 2023 led to an 83% decrease in listings, while the vacancy rate remained unchanged[2]. Meanwhile, rents in New York City increased by 3.4% and the average hotel price rose 7.4%. This is in line with NAHB’s analysis that regulations could have unintended negative consequences, potentially driving up housing costs without improving affordability.

[1] Ginger Zhe Jin, Liad Wagman, and Mengyi Zhong, The Effects of Short-Term Rental Regulation: Insights from Chicago, November 2023,

[2] How Not to Make Housing Affordable—New York Rent, The Wall Street Journal, September 8, 2024.

Discover more from Eye On Housing

Subscribe to get the latest posts sent to your email.


This article was originally published by a eyeonhousing.org . Read the Original article here. .

Pin It