Tag

policy research

Browsing


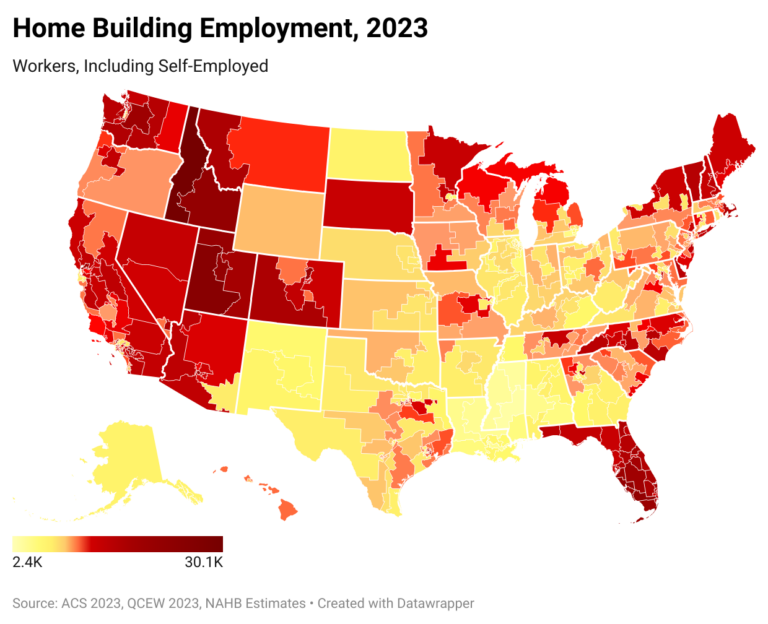
As the number of housing units under construction peaked in 2023, the industry set another record employing close to 11.4 million people, including self-employed workers. NAHB estimates that out of this total, 4.7 million people worked in residential construction, accounting for 2.9% of the U.S. employed civilian labor force. Home building in the Mountain Division, as well as in Vermont and Florida, stand out as generating a significantly higher share of local jobs, with residential construction generating more than 5% of all jobs in Idaho and Montana. NAHB’s analysis also identifies congressional districts where home building accounts for particularly high employment levels and share of local jobs.

Not surprisingly, the most populous state—California—also has the most residential construction workers. Over 640,000 California residents worked in home building in 2023, accounting for 3.4% of the state employed labor force.

Fast-growing Florida comes in second with 468,000 residential construction workers. The state stands out for registering one of the fastest growing populations since the start of the pandemic, which undoubtedly boosted housing and construction workforce demand. Florida’s large stock of vacation and seasonal housing further boosts demand for residential construction workers. As a result, in Florida, residential construction workers account for a relatively high 4.4% of the employed labor. Even though this share is well above the national average (2.9%), it is significantly lower than in 2006, when Florida registered the highest share among all 50 states and the District of Columbia, at 6.5%.

Similar to Florida, fast-growing states with a high prevalence of seasonal, vacation homes top the list of states with the highest share of residential construction workers in 2023. Three states in the Mountain Division – Idaho, Montana, and Utah – take the top spots on the list with 5.5%, 5.1% and 4.9% of the employed labor force working in home building. Vermont is next on the list with a share of 4.6%.  

As of 2023, the average congressional district has about 10,800 residents working in residential construction, but that number is often significantly higher. In Idaho’s 1st Congressional District, over 30,000 residents are in home building and Utah’s 2nd Congressional District has over 25,000 residents working in home building. 

Eight other congressional districts have over 20,000 residents working in residential construction – Florida’s 26th, Utah’s 4th, Idaho’s 2nd, Florida’s 17th, Arizona’s 3rd, Utah’s 1st, Florida’s 28th, and California’s 29th. 

By design, Congressional districts are drawn to represent roughly the same number of people. So generally, large numbers of residential construction (RC) workers translate into high shares of RC workers in their district employed labor forces.  Idaho’s 1st tops this list as well, registering the highest share of residential construction workers in the employed labor force, 6.4%. Florida’s 17th is a close second with 6.3% of the district labor force employed in home building. Next on the list are two Mountain division districts – Montana’s 1st and Utah’s 2nd – with shares of 5.8%, followed by two Florida’s districts – 19th (5.7%) and 26th (5.6%). California’s 29th (5.4%) and 39th (5.3%) also register shares far exceeding the national average of 2.9%.   

At the other end of the spectrum there are several districts that contain parts of large urban areas: the District of Columbia, the 12th of New York, located in New York City, Pennsylvania’s 3rd that includes areas of the city of Philadelphia, Georgia’s 5th that includes most of Atlanta, and among others, Illinois’s 7th and 9th, covering parts of Chicago. Most residents in these urban districts tend to work in professional, scientific, and technical services. The District of Columbia stands out for having the lowest number of RC workers, with just 1,400 residing in the district. At the same time, it has a disproportionally large share of public administration workers. The 12th District of New York and the 7th District of Illinois are home to a very large group of finance and insurance workers. Meanwhile, in Pennsylvania’s 2nd, more than a third of residents work in health care and educational services. 

The NAHB residential construction employment estimates include self-employed workers. Counting self-employed is particularly important in the home building industry since they traditionally make up a larger share of the labor force than in the U.S. total workforce.  

The new NAHB home building employment estimates only include workers directly employed by the industry and do not count jobs created in related industries– such as design and architecture, furniture making, building materials, landscaping, etc.  As a result, the estimates underestimate the overall impact of home building on local employment. 

Discover more from Eye On Housing

Subscribe to get the latest posts sent to your email.


This article was originally published by a eyeonhousing.org . Read the Original article here. .

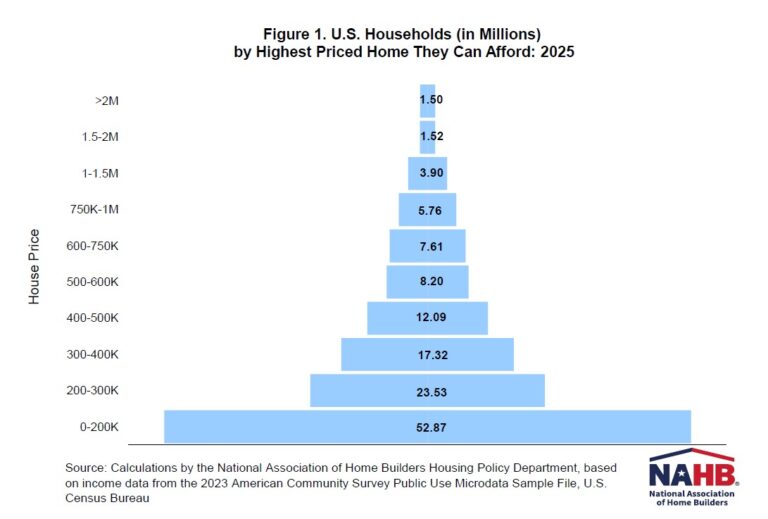
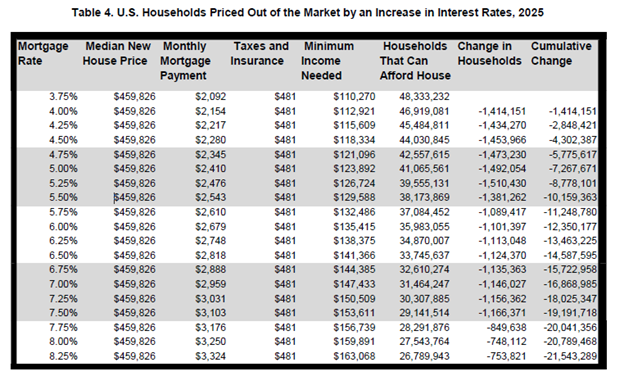
Housing affordability remains a critical issue, with 74.9% of U.S. households unable to afford a median-priced new home in 2025, according to NAHB’s latest analysis. With a median price of $459,826 and a 30-year mortgage rate of 6.5%, this translates to around 100.6 million households priced out of the market, even before accounting for further increases in home prices or interest rates. A $1,000 increase in the median price of new homes would price an additional 115,593 households out of the market.

The 2024 priced-out estimates for all states and the District of Columbia and over 300 metropolitan statistical areas are shown in the interactive map below. It highlights the growing housing affordability challenges across the United States. In 23 states and the District of Columbia, over 80% of households are priced out of the median-priced new home market. This indicates a significant disconnect between rising home prices and household incomes.

Maine stands out as the state with the highest share of households (91.2%) unable to afford the state’s median new home price of $682,223. High-cost states such as Connecticut and Rhode Island follow closely, with 88.3% and 87.8% of households, respectively, struggling to afford new homes. Even in states with relatively lower median new home prices, affordability remains a major concern. For example, in Mississippi, where the median home price is $275,333, 70.2% of households still find these new homes out of reach. Meanwhile, Delaware, the state with better affordability in the analysis, has a median new home price of $373,666. However, around 58.2% of households in Delaware still struggle to afford a new home. Even modest price increases, such as an additional $1,000, could push thousands more households from affording these median priced new homes. For instance, in Texas, such an increase could price out over 11,000 households.

It also shows the 2025 priced-out estimates for over 300 metropolitan statistical areas. The analysis estimates how many households in each metro area earn enough income to qualify for mortgages on median-priced new homes. In high-cost areas like the San Jose-Sunnyvale-Santa Clara, CA metro area, where new homes largely target high-income Silicon Valley residents, only 10% of all households meet the minimum income threshold of $437,963 required to qualify for a loan on a median priced new home. In contrast, in more affordable metro areas like Sierra Vista-Douglas, AZ, where the median new home price is $150,893, nearly two-thirds of households can afford a median priced new home. While higher home prices generally result in higher monthly mortgage payments and higher income thresholds, the relationship between home prices and affordability is not always linear. Factors like property taxes and insurance payments can also significantly impact monthly housing costs, adding complexity to affordability calculations.

The affordability of new homes together with the population size of a metro area, significantly influence the priced-out impact of a $1,000 increase in new home prices. In metro areas where new homes are already unaffordable to most households, the effect of such an increase tends to be small. For instance, in the San Jose-Sunnyvale-Santa Clara, CA metro area, an additional $1,000 increase to the home price affects only 259 households, as only 10% of all households could afford such expensive new homes in the first place. Here, the additional price increase only affects a narrow share of high-income households at the upper end of the income distribution, where affordability is already stretched.

In contrast, metro areas, where new homes are more broadly affordable, experience a larger priced-out effect. A $1,000 increase in the median new home price affects a larger share of households in the “thicker part” of the income distribution. For example, in the Dallas-Fort Worth-Arlington, TX metro area, a $1,000 increase in new home price would disqualify 2,882 households from affording a median-priced new home. This is the largest priced-out effect among all metro areas, driven by the combination of relatively moderate home prices and a substantial population base.

More details, including priced-out estimates for every state and over 300 metropolitan areas, and a description of the underlying methodology, are available in the full study.

Discover more from Eye On Housing

Subscribe to get the latest posts sent to your email.


This article was originally published by a eyeonhousing.org . Read the Original article here. .

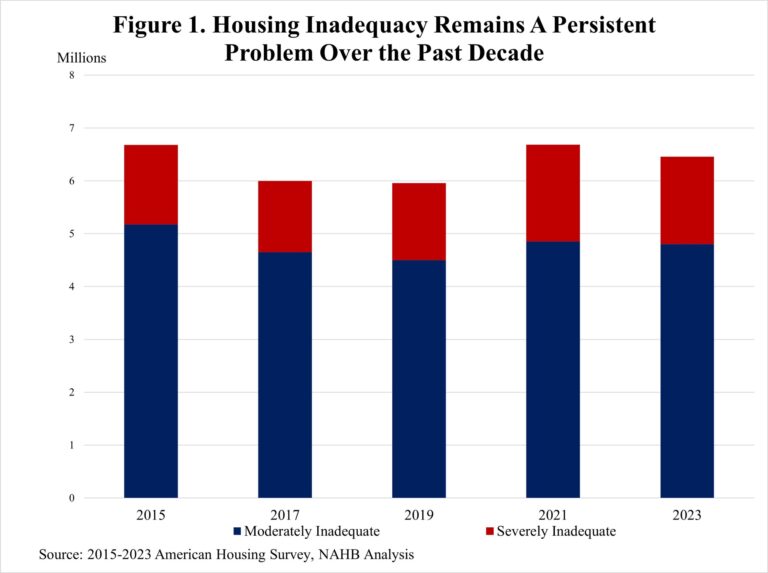
In 2023, nearly 6.45 million homes, around 5% of U.S housing stock, were classified as inadequate according to the American Housing Survey (AHS). Of these, 1.65 million homes were classified as severely inadequate, showing significant concerns over housing quality. While this reveals ongoing issues in nation’s housing conditions, it signals probable market growth for remodeling and home improvements in the year ahead.

The U.S. Department of Housing and Urban Development (HUD) defines physical adequacy based on whether a home meets the basic standard of “a decent home and a suitable living environment”. Homes are severely inadequate if they exhibit major deficiencies, such as exposed wiring, lack of electricity, missing hot or cold running water, or the absence of heating or cooling systems. Additionally, homes with at least five significant structural problems such as water leaks, large open cracks or holes in the floor also belong to this category.  Moderately inadequate homes have three or four significant structural issues, or have problems such as incomplete kitchen facilities, lack of vented heating equipment, or prolonged toilet breakdowns.

Housing inadequacy has remained a persistent issue over the past decade, shown in Figure 1.  In 2023, around 6.5 million households lived in moderately or severely inadequate housing. While the total number of inadequate homes declined slightly from 6.9 million in 2015 to 6.0 million in 2019, it rebounded to 6.7 million in 2021 and remained elevated in 2023.  The majority, around 4.8 million, of inadequate homes were moderately inadequate, while 1.65 million households lived in severely inadequate conditions in 2023.

The share of inadequate homes varies significantly by the age of the home (Figure 2). Older homes have higher rates of inadequacy. Homes built before 1940 have the highest inadequacy rate at 9%, followed by those built between 1940 and 1959 at 7%. While housing units from 1960 to 1979 show a moderate inadequacy rate of 5%, they account for the largest number of inadequate homes, with 1.2 million classified as moderately inadequate and 465,000 as severely inadequate in 2023. In contrast, newer homes (1980-Present) have lower inadequacy rates with the share steadily declining from 4% for homes built between 1980 and 1999 to 3% for those constructed from 2000 to the present.

Geographically, inadequate housing is most concentrated in smaller metro areas. Around 50.4% of moderately inadequate homes (2.4 million units) and 43.6% of severely inadequate homes (720,000 units) are in these areas in 2023. This trend is likely driven by aging housing stock and lower household income compared to major metro areas. However, major metro areas still have a substantial share of inadequate homes, with 29.7% of moderately inadequate (1.4 million) and 38.2% of severely inadequate units (631,000). Non-metro areas have the lowest total numbers, (953,000 moderately inadequate and 720,000 severely inadequate homes), though challenges persist.

In 2023, around 6.45 million households lived in inadequate housing, with more renters (3.5 million) than owners (2.8 million). Housing cost burdens varied greatly among these two groups: Among those households in inadequate homes, 1.9 million owners spent less than 30% of their income on housing, compared to 1.6 million renters. It suggests that many homeowners living in inadequate housing may indeed have the financial capacity to improve their housing conditions if they choose to do so. In contrast, renters in inadequate housing face greater financial constraints, with 1.1 million spending more than 50% of their income on housing, more than double the 480,000 cost-burdened owners. This disparity highlights the challenges renters are facing, including limited affordable housing options and a lack of control over property conditions.

Discover more from Eye On Housing

Subscribe to get the latest posts sent to your email.


This article was originally published by a eyeonhousing.org . Read the Original article here. .

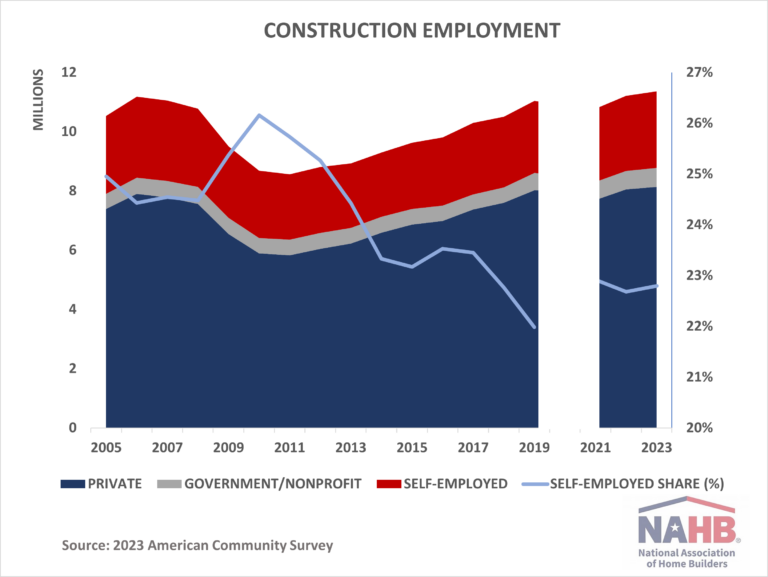
The share of self-employed in construction remains just under 23%, a new post-pandemic norm. While this is significantly higher than an economy-wide average of 10% of the employed labor force, for construction, these rates are historically low. Across the nation, construction self-employment rates range from 38% in Maine to 13% in Nevada.

As of 2023, close to 2.6 million of workers employed in construction are self-employed, according to the latest American Community Survey (ACS). While the industry’s payroll employment surpassed the historic highs of the home building boom of the mid-2000s, the number of self-employed remains below the peak of 2006 when over a quarter of the construction labor force was self-employed.

Declining self-employment rates in construction coincide with the declining share of tradesmen in construction and potentially reflect structural changes in the construction labor force, such as a shift towards larger construction firms that are better equipped to invest into new technologies and absorb higher overhead costs.

Partially, the downward trend in construction self-employment rates since the Housing Bust reflects the counter-cyclical nature of self-employment. Under normal circumstances, self-employment rates rise during an economic downturn and fall during an expansion. This presumably reflects a common practice among builders to downsize payrolls when construction activity is declining. In contrast, builders and trade contractors offer better terms for employment and attract a larger pool of laborers to be employees rather than self-employed when workflow is steady and rising.   Potentially reflecting the counter-cyclical nature of construction self-employment, the current self-employment rates are 3.4 percentage points lower compared to the peak rate of the Great Recession.

For similar reasons, persistent labor shortages that plagued the industry during the last decade likely have contributed to the decline in self-employment rates. Ostensibly, to minimize construction delays, builders and trade contractors would be willing to offer better payroll terms to secure employees when finding experienced craftsmen is a challenge.

Since the 2020 ACS data are not reliable due to the data collection issues experienced during the early lockdown stages of the pandemic, we can only compare the pre-pandemic 2019 and post-pandemic 2021-2022 data (hence the omitted 2020 data in the charts above). As a result, it is not clear what accounted for the post-pandemic bump in self-employment. One answer is that   self-employed workers in construction managed to remain employed during the short COVID-19 recession or recovered their jobs faster afterwards, compared to private payroll workers. Another possibility is that the booming residential construction sector attracted self-employed workers from other more vulnerable or slow recovering industries, including commercial construction.

Examining cross-state variation provides additional insights into construction self-employment rates. The New England states and Montana register some of the highest self-employment shares. In Maine, 38% of construction workers are self-employed. The share is similarly high in Vermont where more than a third of workers are self-employed, 36%. In Connecticut and Rhode Island, 28% of workers are self-employed. In Montana, the share is 30%.

The New England states are where it takes longer to build a house.  Because of the short construction season and longer times to complete a project, specialty trade contractors in these states have fewer workers on their payrolls. The 2022 Economic Census data show that specialty trade contractors in Vermont and Maine have some of the smallest payrolls in the nation with five workers on average. Only contractors in Montana have smaller payrolls, averaging less than 5 workers. At the same time, the national average is over nine workers. As a result, independent entrepreneurs in New England and Montana tend to complete a greater share of work, which helps explain the high self-employment shares in these states.

The Mountain division has states with the highest and lowest self-employment rates simultaneously. Montana and Colorado, where more than a quarter of workers are self-employed, round up the list of states with the highest self-employment rates. At the same time, Nevada registers one of the lowest (13%) self-employment rates in construction and takes the place at the opposite end of the list. Only Washington, DC has a lower share of self-employed, 9%. The substantial differences likely reflect a predominance of home building in Montana and Colorado and a higher prevalence of commercial construction, that has larger payroll employment and, presumably, relies less heavily on self-employed.

Discover more from Eye On Housing

Subscribe to get the latest posts sent to your email.


This article was originally published by a eyeonhousing.org . Read the Original article here. .


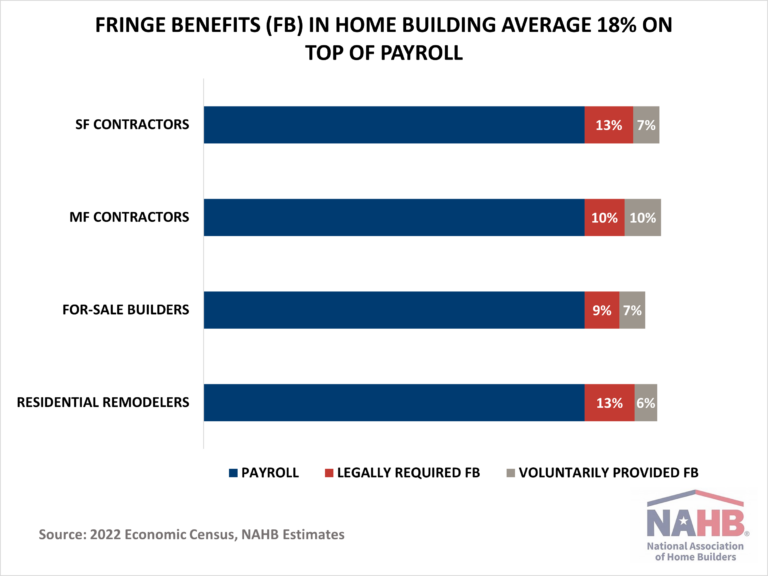
In the home building industry, fringe benefits add an additional 18% to employees’ compensation on top of payroll, according to NAHB’s analysis of the latest 2022 Economic Census data. The rates vary across residential construction sub-sectors with single-family and multifamily general contractors contributing an average of 20% on top of payroll. Fringe benefits in residential remodeling and for-sale building average 19% and 16%, respectively.

Total fringe benefits consist of legally required and voluntarily provided benefits. The legally required component includes employers’ contribution to Social Security and Medicare, unemployment insurance, worker’s compensation insurance, and state-mandated temporary disability and other state-specific contributions. Since these benefits are mandatory by law, it may seem counter-intuitive to view them as “fringe” benefits. Nevertheless, the Economic Census counts them as “legally required fringe benefits” paid on top of payroll.

In 2022, legally required fringe benefits contributed by single-family general contractors and remodelers amounted to an additional 13% on top of payroll. The average rate for multifamily general contractors and for-sale builders was 10% and 9%, respectively. Averaged across the four subsectors of home building, legally required benefits amounted to just under 12% of payroll.

Voluntarily provided fringe benefits include expenditures paid by employers for life insurance premiums, pension plans, insurance premiums on hospital and medical plans, welfare plans, and union negotiated benefits. Other perks provided by employers, such as paid holidays, vacations, sick pay, bonuses, and jury pay, may seem like valuable “fringe” benefits but are technically counted in payroll.

In 2022, voluntary fringe benefits provided by multifamily general contractors amounted to an additional 10% on top of payroll.  In the case of single-family contractors and for-sale builders, these benefits added 7% to compensation. The rate was lower for residential remodelers, where voluntary benefits amounted to 6% of payroll. Averaged across the four sub-sectors of home building, the voluntarily provided benefits approached an added cost of 7% on top of payroll.

In addition to the four residential construction subsectors discussed above, the home building industry also includes land developers and specialty trade contractors (STC). Since the Economic Census does not differentiate between residential and non-residential specialty trade contractors, this combined subsector is not included in the home building chart above. Nevertheless, the latest Economic Census shows that the fringe benefit rates were highest among specialty trade contractors – 28%, equally split between legally required and voluntary.

Among other things, the differences in the fringe benefit rates reflect variations in state-mandated regulations, size and legal form of companies, involvement in federally funded projects, unionization of workers, and employee participation rates in health and pension plans. For example, depending on the legal form of organization, accounting principles are different and can affect the estimated fringe benefit rates. For corporations, payroll includes compensation of executives, but for unincorporated businesses, such as individual proprietorships and partnerships, payroll excludes profit and other compensation of proprietors or partners. In addition, partners and proprietors may not be ineligible for the complete benefits package they offer to employees, also affecting the estimated fringe benefit rates for their businesses.

The data used in this analysis come from the Economic Census available only every five years. The Economic Census, like many other federal statistics programs, collects data only on establishments with payroll employees. In construction, an establishment operates continually at a single physical location but typically manages more than one project or job. A large building company may operate at more than one location but would file a separate report for each location or establishment.

Discover more from Eye On Housing

Subscribe to get the latest posts sent to your email.


This article was originally published by a eyeonhousing.org . Read the Original article here. .

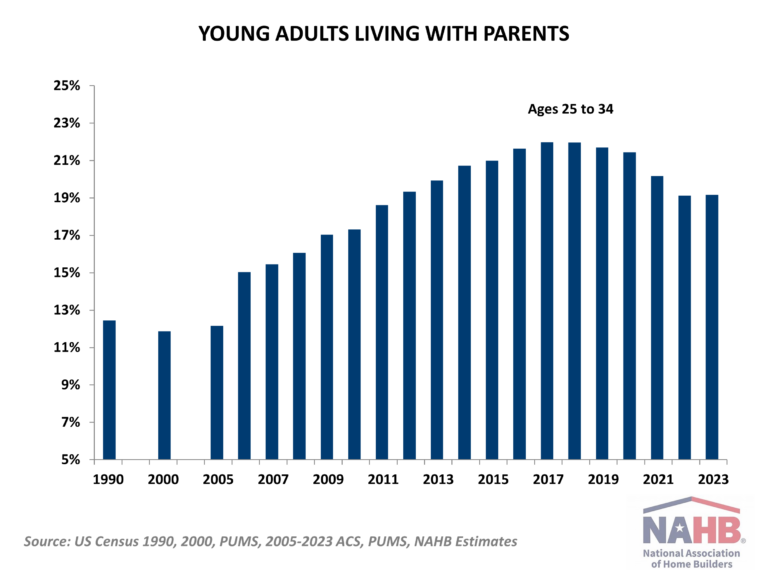
The worst on record rental affordability conditions, depleted “excess” savings of the pandemic era, and high mortgage rates halted the post-pandemic trend of young adults moving out of parental homes. The share of adults ages 25-34 living with parents or parents-in-law hovered just above 19% in 2023, stagnant from 2022, according to NAHB’s analysis of the 2023 American Community Survey (ACS) Public Use Microdata Sample (PUMS). While this percentage is the second lowest since 2011, the share remains elevated by historical standards. Regionally, Southern and Northeastern states register some of the highest shares of young adults remaining in parental homes.

Traditionally, young adults ages 25 to 34 make up around half of all first-time homebuyers. Consequently, the number and share of young adults in this age group that choose to stay with their parents, or parents-in-law, has profound implications for household formation, housing demand, and the housing market.

The current share of 19.2% translates into 8.5 million young adults living in homes of their parents or parents-in-law. In contrast, less than 12% of young adults ages 25 to 34, or 4.6 million, lived with parents in 2000. The share peaked in 2017-2018 at 22% when the ACS recorded over 9.7 million adults ages 25 to 34 living with parents.

While the national average share hovers around 19.2%, more than a quarter of young adults ages 25-34 remain in parental homes in California (26.5%), New Jersey (26.3%), and Hawaii (25.2%). Delaware (23.2%), Maryland (22.7%), Florida (22.4%) and New York (21.8%) are next on the list. At the opposite end of the spectrum are states with less than one in ten young adults living with parents. The fast-growing North Dakota records the nation’s lowest share of 5%, while the neighboring South Dakota registers 7%. In the District of Columbia, known for its relatively stable job market, less than 7.5% of young adults live with their parents. The cluster of central US states completes the nation’s list with the lowest percentages of young adults remaining in parental homes – Nebraska (8.4%), Iowa (8.5), and Wyoming (9.6%).

The elevated shares of young adults living with parents in high-cost coastal areas point to prohibitively expensive housing costs as one of the reasons for keeping young adults in parental homes. The statistical analysis confirms that states with higher shares of cost-burdened owners and renters living in unaffordable homes (i.e., paying 30 percent or more of income on housing) register higher shares of young adults living with parents. In particular, renters’ housing cost burdens explain half of the cross-state variation in the shares of young adults living in parental homes.

Multigeneration living, which is more prevalent among ethnic households, can also contribute to the elevated shares of young adults living with parents. This can be particularly relevant in the Southern states with higher shares of Hispanic households. However, the statistical analysis shows that while the correlation is positive, prevalence of Hispanic households does not carry any additional explanatory power once housing cost burdens are accounted for.

Discover more from Eye On Housing

Subscribe to get the latest posts sent to your email.


This article was originally published by a
eyeonhousing.org . Read the Original article here. .


The U.S. trade deficit in goods was at $112 billion in the month of October, according to the Census Bureau’s Foreign Trade data. Compared to last year, the level has increased 13.3%, rising from $99 billion.

Total goods imported was valued at $289 billion while the exports were valued at $177 billion in October. The import value represents the price paid for goods at the foreign port, excluding U.S. import duties, freight, insurance, and other charges. This value includes all merchandise, whether it is sold directly into the U.S. market or re-exported to another country. The export value represents the selling price of the goods plus inland/domestic freight, insurance and other charges at the U.S. port, excluding post-export charges.

As shown above, the U.S. trade deficit in goods has continued to climb higher since 2014 when it was $59 billion. Focusing on October 2024 data, the Census reports that of the 229 countries the U.S. traded goods in October, the U.S. had a trade deficit with 102 (meaning the U.S. imported more than exported to specific country). The countries that the U.S. had the largest trade deficit with in October were China ($28.0 billion), Mexico ($16.4 billion) and Vietnam ($11.6 billion). Shown below are five countries that have the highest average trade deficit with the U.S. since 2014.

Tracking the dashed trend lines above, the trade deficit with China has moved lower since peaking in 2018. Despite this recent decline, the trade deficit between China and U.S. remains significantly higher than any other country. In October, it was almost double the size of the deficit with Mexico, the second largest. The trade deficit with Mexico and the U.S. has trended upward as trade policy in the U.S. has shifted away from China. The total value of imports from Mexico in October was $45.5 billion, while imports from China stood at $41.5 billion. There also exists a notable increase in the trade deficit with Vietnam. In January 2014, the level stood at only $2 billion, well below other main exporters to the U.S. like Japan and Germany. This level has only continued to rise, caused again by a shift away from trade with China.

The top countries in October that the U.S. held a trade surplus with were Netherlands ($4.5 billion), United Kingdom ($1.7 billion) and the Hong Kong ($1.6 billion). While these were the highest surplus counties in October, the values are substantially lower than the trade deficit levels shown above. The graph below displays five countries that the U.S. has the largest average trade surplus with over the past 10 years. The surplus with the Netherlands has jumped far higher than any nation since 2022. Trade with Hong Kong historically had the highest until 2018-2019.

While the U.S. has consistently held a trade deficit since 2014, the composition of the deficit is continuing to undergo a transition. Despite a U.S. trade policy that is shifting away from China, the trade deficit with China remains by far the largest the U.S. has with any country. Expansion of trade with Mexico and Vietnam has a seen a rise in trade deficits with both nations, as the U.S. attempts to decouple with China. The data shows that both economies are still very connected, with the U.S. remaining a top destination of exportation from China and U.S. consumers needs for goods from China.

Discover more from Eye On Housing

Subscribe to get the latest posts sent to your email.


This article was originally published by a eyeonhousing.org . Read the Original article here. .

NAHB estimates that $184 billion worth of goods were used in the construction of both new multifamily and single-family housing in 2023. Additionally, we estimate that $13 billon of those goods were imported from outside of the U.S. These figures lead to 7% of all goods used in new residential construction originating from a foreign nation. This data come from the BEA input-output accounts, which reveals important details of numerous industries across the U.S. detailing what products they produce, use and import in the economy. The latest tables are from 2017 and the data is adjusted to 2023 dollar value.

Import use varies significantly by type of building product. Shown above are the ten most import reliant products that are used in new residential construction. These products are defined by North American Industry Classification System (NAICS).

The U.S Census Bureau reports data on international trade of goods by NAICS definitions. With this, we can locate which nations are responsible for importing products used in residential construction into the U.S. Using the commodities that are used in residential construction, a significant share comes from China, at 27%. Mexico was the second most important nation with around 11% followed by Canada at 8%. Shown below are the countries with the 10 highest shares along with the remaining 27% from countries outside the top 10.

Tariff Impact

During the election campaign, President Trump promised the enactment of a tariff plan ranging from 10%-20% on imported goods, with 60% tariffs on imports from China. A tariff is essentially a tax on an imported good, meaning the importer pays an additional tax for importing such an item from another country. For example, say a business in the United States needed to purchase a $100 worth of screws from China. With a 60% tariff, the business would then need to pay an additional $60 to the U.S. Government to receive the screws. The exporter in China would still receive the $100 from the business and not pay the added tariff costs. The tariff cost falls on the importer, who would absorb the higher costs through lower profit margins or raising their own prices for consumers.

Without additional detail for these tariff proposals, it is difficult to estimate the impact of these tariffs. Using our best estimate, a 10% tariff on all imports with a 60% tariff on imports directly from China would result in a $3.2 billion increase in the cost of imported building materials used in residential construction. By product, the largest increase in cost would be for household appliances, where 54% of imports come from China, this tariff adds $670 million for these imported products. Additionally, a 20% tariff coupled with 60% imports from China would result in $4.2 billion in added cost of imported residential building products.  

From Canada, the U.S. imports a significant amount of wood related products. In 2023, 70% of sawmill and wood product imports came from Canada. Many of these wood products from Canada are already subject to tariffs, with the current rate at 14.5%. Total imports of sawmill and wood products from Canada in 2023 was $5.8 billion. The highest valued import from Canada was nonferrous metals, totaling $17.6 billion in 2023.

Turning to Mexico, 71% of lime and gypsum products imported in 2023 originated from Mexico. While this share is particularly high, the total value of imports in 2023 of lime and gypsum was only $456 million. The highest valued import from Mexico at $28.6 billion in 2023 was computer equipment, where imports from Mexico made up 23% of total imports of computer equipment in 2023.

Discover more from Eye On Housing

Subscribe to get the latest posts sent to your email.


This article was originally published by a eyeonhousing.org . Read the Original article here. .

As reported in a previous post, immigrants make up one in four workers in the construction industry. The share of immigrants is significantly higher (32.5%) among construction tradesmen. In some states, reliance on foreign-born labor is particularly evident, with immigrants comprising over 40% of the construction workforce in California and New Jersey, and 38% – in Texas and Florida.

According to the government’s system for classifying occupations, the construction industry employs workers in about 390 occupations. Out of these, only 28 are construction trades, yet they account for almost two thirds of the construction labor force. The other one-third of workers are in finance, sales, administration and other off-site activities.

The concentration of immigrants is particularly high in construction trades essential for home building, such as plasterers and stucco masons, drywall/ceiling tile installers (61%), roofers (52%), painters (51%), carpet/floor/tile installers (45%).

The two most prevalent construction occupations, laborers and carpenters, account for over a quarter of the construction labor force. A third of all carpenters and 42% of construction laborers are of foreign-born origin. These trades require less formal education but consistently register some of the highest labor shortages in the NAHB/Wells Fargo Housing Market Index (HMI) and NAHB Remodeling Market Index (RMI) surveys.

In the latest February 2024 HMI Survey, 65% of builders reported some or serious shortage of workers performing finished carpentry. Looking at other tradesmen directly employed by builders, the shortages of bricklayers and masons are similarly acute, despite a high presence of immigrant workers in these trades.

Labor shortages are also high among electricians, plumbers and HVAC technicians, with over half of surveyed builders reporting shortages of these craftsmen. In contrast, these trades demand longer formal training, often require professional licenses and attract fewer immigrants.

More than half (53%) of the three million immigrant construction workers reside in the four most populous states in the U.S. – California, Texas, Florida, and New York.  California and Texas have over half a million foreign-born construction workers each. Combined, these two states account for over a third (35%) of all immigrant construction workers. Florida and New York combined account for an additional 18%.

These are not only the most populous states in the U.S., but as traditional gateway states, they are also particularly reliant on foreign-born construction labor. Immigrants comprise 41% of the construction workforce in California. In Florida and Texas, 38% of the construction labor force is foreign-born. In New York, 37% of construction industry workers come from abroad. 

The reliance on foreign-born labor continues to spread outside of these traditional immigrant magnets. This is evident in states like New Jersey, that registered the second highest share of immigrant workers, 40%, in 2023, closely following California. Nevada and Maryland, where immigrants (as of 2023) account for over a third of the construction labor force (36%) also illustrate spreading reliance on immigrant labor.

In Georgia, Connecticut, North Carolina, Virginia, Arizona, Massachusetts, and Illinois, more than a quarter of construction workers are foreign-born. At the other end of the spectrum, seven states – Montana, North and South Dakota, Vermont, Maine, West Virginia, and Alaska – have share of immigrant workers of less than 5%.

Because immigrant workers are disproportionately concentrated within the construction trades, immigrant presence among craftsmen is higher than their overall representation in the industry across all states. In California and DC, immigrant workers account for more than half of all tradesmen in construction. In New Jersey and Texas, these shares are similarly high at 49%. In Maryland, Nevada, Florida, New York and Georgia, between 40% and 47% of craftsmen are foreign-born. 

While most states draw the majority of immigrant foreign-born workers from the Americas, Hawaii relies more heavily on Asian immigrants. European immigrants are a significant source of construction labor in New York, New Jersey and Illinois.

Discover more from Eye On Housing

Subscribe to get the latest posts sent to your email.


This article was originally published by a eyeonhousing.org . Read the Original article here. .

Reflecting the sharp increase in net immigration of recent years, the number of new immigrants joining the construction industry rose substantially in 2022. According to the latest American Community Survey (ACS), the industry managed to attract close to 130,000 new workers coming from outside the U.S. to help with persistent labor shortages. For comparison, this inflow surpasses the combined number of new immigrants who joined the industry in the two years prior to the pandemic. Only during the housing boom of 2005-2006, was the industry absorbing a similar number of new foreign-born workers.

Native-born workers remain reluctant to join the industry, with their total count remaining below the record levels of the housing boom of the mid-2000s by over half a million. As a result, the share of immigrants in construction reached a new historic high of 25.5%. In construction trades, the share of immigrants remains even higher, with one in three craftsmen coming from outside the U.S. This is consistent with the earlier ACS data that regularly shows higher shares of immigrants in the construction trades.

In 2023, 11.9 million workers, including both self-employed and temporarily unemployed, comprised the construction workforce. Out of these, 8.9 million were native-born, and 3 million were foreign-born, the highest number of immigrant workers in construction ever recorded by the ACS.

The construction labor force, including both native- and foreign-born workers, exceeds the pre-pandemic levels but remains smaller than during the housing boom of the mid-2000s.  As the chart above illustrates, it is the native-born workers that remain missing. Compared to the peak employment levels of 2006, construction is short 550,000 native-born workers and new immigrants only partially close the gap. Due to the data collection issues during the early pandemic lockdown stages, we do not have reliable estimates for 2020 and omit these in the chart above.

Typically, the annual flow of new immigrant workers into construction is highly responsive to the changing labor demand. The number of newly arrived immigrants in construction rises rapidly when housing starts are rising and declines precipitously when the housing industry is contracting. The response of immigration is normally quite rapid, occurring in the same year as a change in construction activity. Statistically, the link is captured by high correlation between the annual flow of new immigrants into construction and measures of new home construction, especially new single-family starts. 

The latest data show that the substantial uptick in the number of new immigrants in 2022 does not reflect the changing volume of home building as new single-family starts declined during that time period.

Previously, the link between immigrant inflow and home building activity also disconnected in 2017 when NAHB’s estimates showed a surprising drop in the number of new immigrants in construction despite steady gains in housing starts. The connection was further severed by pandemic-triggered lockdowns and restrictions on travel and border crossings, drastically interrupting the flow of new immigrant workers. In 2021, however, the flow of immigrants into construction returned to typical levels driven by home building activity.

The overall rising trend and the noticeable uptick after the pandemic in the share of immigrants are consistent with but more pronounced in construction compared to broader U.S. economy. Excluding construction, where the reliance on foreign-born workers is greater, the share of immigrants in the U.S. labor force increased from just over 14% in 2004 to over 17% in 2023, the highest share recorded by the ACS.

Discover more from Eye On Housing

Subscribe to get the latest posts sent to your email.


This article was originally published by a eyeonhousing.org . Read the Original article here. .
Pin It