Tag

Permits

Browsing


Through April 2026, residential construction activity remained uneven across housing sectors. Single-family permitting continued to soften compared with a year ago, reflecting persistent affordability challenges and elevated borrowing costs, while multifamily permitting posted solid gains supported by stronger activity in several regions. Regional and state-level permit data reveal notable differences in housing market conditions across the country.

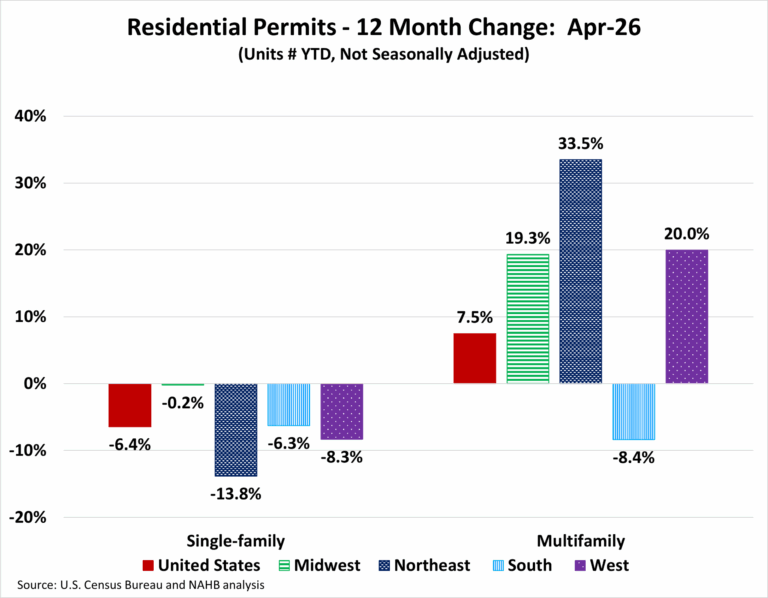
Over the first four months of the year, the number of single-family permits issued nationwide reached 299,642. On a year-over-year basis, this represents a 6.4 percent decline compared with the April 2025 total of 320,259. On the other hand, multifamily permitting activity was stronger, with 166,252 permits issued nationwide, marking a 7.5 percent increase from the same period last year.

Regionally, year-to-date single-family permitting declined in all four regions through April. The Midwest was essentially flat, the South declined by 6.3 percent, the West dropped 8.3 percent, and the Northeast fell 13.8 percent. Multifamily permits increased in three of the four regions, led by gains in the Northeast (up 33.5 percent), followed by the West (up 20.0 percent), and the Midwest (up 19.3 percent). The South saw an 8.4 percent decline, driven largely by reductions in large metro areas across Southern states.

At the state level, 13 states and the District of Columbia recorded year-over-year increases in single-family permits in April, with gains ranging from 28.0 percent in the District of Columbia to 0.6 percent in Nebraska and Minnesota. The remaining 37 states reported declines, led by Hawaii, which posted the steepest drop at 27.1 percent.

The ten states issuing the highest number of single-family permits accounted for 63.1 percent of all single-family permits issued nationwide. Texas led the country with 48,328 permits issued at the end of April 2026, although this represented an 8.2 percent decline compared with April 2025. Florida, the second-highest state, saw permits fall by 6.3 percent, while North Carolina, ranked third, experienced a decline of 12.6 percent.

Between April 2026 and April 2025, 34 states recorded increases in multifamily building permits, while 16 states and the District of Columbia experienced declines. Rhode Island posted the largest percentage increase, with multifamily permits surging 250.6 percent, rising from 170 to 596 units. In contrast, Nevada recorded the steepest decline, with permits falling 78.5 percent, from 3,426 to 738 units.

The ten states issuing the highest number of multifamily permits accounted for 61.3 percent of all multifamily permits issued nationwide. Over the first four months of 2026, California, which issued the most multifamily permits, recorded a substantial increase of 57.0 percent. Texas, the second-highest state, posted a decline of 20.6 percent, while Florida, ranking third, saw multifamily permits fall by 41.3 percent.

At the local level, the following are the ten metropolitan areas with the highest number of single-family permits issued.

Below are the ten metropolitan areas with the highest levels of multifamily permitting activity.


This article was originally published by a eyeonhousing.org . Read the Original article here. .


Residential construction permitting activity presented a mixed picture through the first quarter of 2026, as weakness in the single-family market contrasted with continued strength in multifamily development. Elevated financing costs, ongoing affordability challenges, and softer builder sentiment continued to weigh on single-family construction activity, while multifamily permitting remained supported by demand for rental housing.

Over the first three months of the year, the number of single-family permits issued nationwide reached 214,655. On a year-over-year basis, this represents a 7.6 percent decline compared with the March 2025 total of 232,221. On the other hand, multifamily permitting activity was stronger, with 121,404 permits issued nationwide, marking a 7.1 percent increase from the same period last year.

Regionally, year-to-date single-family permitting declined in all four regions through March. The Midwest was essentially flat, the South declined by 7.4 percent, the West dropped 9.3 percent, and the Northeast fell 17.1 percent. Multifamily permits increased in three of the four regions, led by gains in the Northeast (up 47.0 percent), followed by the West (up 38.0 percent), and the Midwest (up 2.2 percent). The South saw a decline of 13.3 percent, driven largely by a 42.0 percent decrease in the Houston-Pasadena-The Woodlands, TX metropolitan area and a 29.0 percent drop in the Miami-Fort Lauderdale-West Palm Beach, FL metropolitan area.

At the state level, 12 states recorded year-over-year increases in single-family permits in March, with gains ranging from 18.6 percent in Alabama to 0.2 percent in Minnesota. The District of Columbia reported no change. The remaining 38 states reported declines, led by Maryland, which posted the steepest drop at 25.4 percent.

The ten states issuing the highest number of single-family permits accounted for 63.7 percent of all single-family permits issued nationwide. Texas led the country with 35,231 permits issued at the end of the first quarter of 2026, although this represented an 8.3 percent decline compared with March 2025. Florida, the second-highest state, saw permits fall by 6.7 percent, while North Carolina, ranked third, experienced a decline of 15.4 percent.

Between March 2026 and March 2025, 29 states recorded increases in multifamily building permits, while 21 states and the District of Columbia experienced declines. Rhode Island posted the largest percentage increase, with multifamily permits surging 397.2 percent, rising from 109 to 542 units. In contrast, Nevada recorded the steepest decline, with permits falling 81.6 percent, from 2,299 to 422 units.

The ten states issuing the highest number of multifamily permits accounted for 62.8 percent of all multifamily permits issued nationwide. Over the first three months of 2026, California, which issued the most multifamily permits, recorded a substantial increase of 105.4 percent. Texas, the second-highest state, posted a decline of 2.9 percent, while New York, ranking third, saw multifamily permits rise by 154.8 percent.

At the local level, the following are the ten metropolitan areas with the highest number of single-family permits issued.

Below are the ten metropolitan areas with the highest levels of multifamily permitting activity.


This article was originally published by a eyeonhousing.org . Read the Original article here. .


Residential construction activity began 2026 on a mixed note, with single-family permitting weakening significantly while multifamily activity remained relatively stable. Higher borrowing costs and affordability constraints continue to weigh on single-family construction, while multifamily permitting shows signs of resilience despite regional variation.

Over the first month of the year, the number of single-family permits issued nationwide reached 62,034. On a year-over-year basis, this represents a 15.2 percent decline compared with the January 2025 total of 73,115. Multifamily permitting activity was essentially flat, with 38,215 permits issued nationwide, marking a 0.5 percent decline from the same period last year.

Regionally, year-to-date single-family permitting declined in all four regions in January. The Midwest declined by 9.1 percent, the Northeast fell 10.6 percent, the South declined 14.7 percent, and the West dropped 20.1 percent. Multifamily permits increased in three of the four regions, led by gains in the Northeast (up 39.4 percent), followed by the West (up 35.5 percent), and the Midwest (up 10.9 percent). The South saw a decline of 24.2 percent, driven largely by a 42.0 percent decrease in Atlanta-Sandy Springs-Roswell, GA metropolitan areas and a 39.0 percent drop in the Houston-Pasadena-The Woodlands, TX metropolitan area.

At the state level, seven states recorded year-over-year increases in single-family permits in January, with gains ranging from 25.5 percent in Montana to 0.4 percent in Washington. Connecticut reported no change. The remaining 42 states and the District of Columbia reported declines, led by the District of Columbia, which posted the steepest drop at 52.0 percent.

The ten states issuing the highest number of single-family permits accounted for 63.8 percent of all single-family permits issued nationwide. Texas led the country, with 9,580 permits issued at the start of 2026, although this represented a 21.3 percent decline compared with January 2025. Florida, the second-highest state, saw permits fall by 14.9 percent, while North Carolina, ranked third, experienced a decline of 9.8 percent.

Between January 2026 and January 2025, 26 states recorded increases in multifamily building permits, while 24 states and the District of Columbia experienced declines. Delaware posted the largest percentage increase, with multifamily permits surging 1,293.8 percent, rising from 16 to 223 units. In contrast, Wyoming recorded the steepest decline, with permits falling 100.0 percent, from 13 to zero units.

The ten states issuing the highest number of multifamily permits accounted for 63.1 percent of all multifamily permits issued nationwide. Over the first month of 2026, California, which issued the most multifamily permits, recorded a substantial increase of 119.2 percent. Texas, the second-highest state, posted a decline of 24.4 percent, while New York, ranking third, saw multifamily permits rise by 66.7 percent.

At the local level, the following are the ten metropolitan areas with the highest number of single-family permits issued.

Below are the ten metropolitan areas with the highest levels of multifamily permitting activity.


This article was originally published by a eyeonhousing.org . Read the Original article here. .


Single-family permitting softened over the course of 2025 and finished the year weaker than the prior year. After showing some resilience in 2024, permitting activity gradually lost momentum as elevated mortgage rates and ongoing affordability constraints weighed on buyer demand. By year’s end, the pace of single-family permit issuance was below the level recorded in 2024, signaling a pullback in new construction. Multifamily permitting followed a more uneven path during 2025, reflecting the sector’s typical volatility, but ended the year on a stronger footing.

Over the year, the number of single-family permits issued nationwide reached 909,280. On a year-over-year basis, this represents a 7.4 percent decline compared with the December 2024 year-to-date total of 981,834. Multifamily permitting activity was stronger, with 516,886 permits issued nationwide, marking a 5.6 percent increase from the same period last year.

Regionally, year-to-date single-family permitting increased in only one of the four regions through December. The Midwest posted a slight gain of 0.3 percent, while activity declined in the Northeast (down 1.9 percent), the South (down 8.5 percent), and the West (down 10.4 percent). Multifamily permits increased in three of the four regions, led by gains in the West (up 17.6 percent), followed by the Midwest (up 9.8 percent), and then the South (up 4.9 percent). The Northeast saw a sharp decline of 12.4 percent, driven largely by a 21.0 percent drop in the New York–Newark–Jersey City metropolitan area.

At the state level, 16 states recorded year-over-year increases in single-family permits between December 2025 year-to-date and December 2024 year-to-date, with gains ranging from 24.0 percent in the District of Columbia to 0.1 percent in New York. The remaining 34 states reported declines, led by Nevada, which posted the steepest drop at 21.3 percent.

The ten states issuing the highest number of single-family permits accounted for 61.8 percent of all single-family permits issued nationwide. Texas continued to lead the country, with 140,002 permits issued over 2025, although this represented an 11.7 percent decline compared with 2024. Florida, the second-highest state, saw permits fall by 10.3 percent, while North Carolina, ranked third, experienced a decline of 6.9 percent.

Between December 2025 year-to-date and December 2024 year-to-date, 31 states recorded increases in multifamily building permits, while 19 states and the District of Columbia experienced declines. Mississippi posted the largest percentage increase, with multifamily permits surging 195.8 percent, rising from 357 to 1,056 units. In contrast, Maryland recorded the steepest decline, with permits falling 32.7 percent, from 5,797 to 3,902 units.

The ten states issuing the highest number of multifamily permits accounted for 60.5 percent of all multifamily permits issued nationwide. Over the course of 2025, Texas, which issued the most multifamily permits, recorded a modest increase of 1.7 percent. Florida, the second-highest state, posted a stronger gain of 29.6 percent, while California, ranking third, saw multifamily permits rise by 21.6 percent.

At the local level, the following are the ten metropolitan areas with the highest number of single-family permits issued.

Below are the ten metropolitan areas with the highest levels of multifamily permitting activity.


This article was originally published by a eyeonhousing.org . Read the Original article here. .

In October, single-family building permits weakened, reflecting continued caution among builders amid affordability constraints and financing challenges. In contrast, multifamily permit activity remained steady and continued to perform relatively well. Together, these trends suggest that while demand for new housing persists, builders are adjusting residential construction activity in response to evolving market conditions. Because permits typically precede construction starts, these patterns offer insight into the near-term outlook for residential building activity.

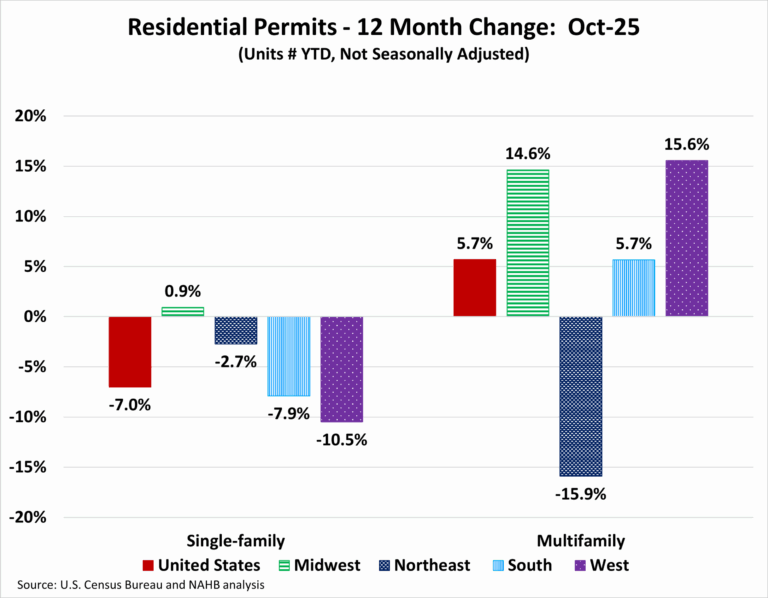
Over the first ten months of 2025, the number of single-family permits issued nationwide reached 787,122. On a year-over-year basis, this represents a 7.0 percent decline compared with the October 2024 year-to-date total of 846,446. Multifamily permitting activity was stronger, with 426,352 permits issued nationwide, marking a 5.7 percent increase from the same period last year.

Regionally, year-to-date single-family permitting increased in only one of the four regions through October. The Midwest posted a modest gain of 0.9 percent, while activity declined in the Northeast (down 2.7 percent), the South (down 7.9 percent), and the West (down 10.5 percent). Multifamily permits increased in three of the four regions, led by gains in the West (up 15.6 percent), followed by the Midwest (up 14.6 percent), and then the South (up 5.7 percent). The Northeast saw a sharp decline of 15.9 percent, driven largely by a 28.0 percent drop in the New York–Newark–Jersey City metropolitan area.

At the state level, 15 states recorded year-over-year increases in single-family permits between October 2025 year-to-date and October 2024 year-to-date, with gains ranging from 12.6 percent in New Hampshire to 0.8 percent in West Virginia. The remaining 35 states and the District of Columbia reported declines, led by Nevada, which posted the steepest drop at 22.4 percent.

The ten states issuing the highest number of single-family permits accounted for 62.0 percent of all single-family permits issued nationwide. Texas continued to lead the country, with 122,293 permits issued over the first ten months of 2025, although this represented a 10.3 percent decline compared with the same period last year. Florida, the second-highest state, saw permits fall by 9.8 percent, while North Carolina, ranked third, experienced a decline of 5.8 percent.

Between October 2025 year-to-date and October 2024 year-to-date, 29 states and the District of Columbia recorded increases in multifamily building permits, while 21 states experienced declines. Mississippi posted the largest percentage increase, with multifamily permits surging 142.6 percent, rising from 289 to 701 units. In contrast, Maryland recorded the steepest decline, with permits falling 44.5 percent, from 5,265 to 2,922 units.

The ten states issuing the highest number of multifamily permits accounted for 60.2 percent of all multifamily permits issued nationwide. Over the first ten months of 2025, Texas, which issued the most multifamily permits, recorded a modest increase of 2.9 percent. Florida, the second-highest state, posted a stronger gain of 27.8 percent, while California, ranking third, saw multifamily permits rise by 19.8 percent.

At the local level, the following are the ten metropolitan areas with the highest number of single-family permits issued.

Below are the ten local areas with the highest levels of multifamily permitting activity.


This article was originally published by a eyeonhousing.org . Read the Original article here. .

Single-family housing permits continued a downhill trend for the sixth month in a row. The continuous decline in single-family permits highlights persistently weak housing demand, tied to affordability challenges like high mortgage rates. Builders appear cautious amid economic uncertainty, labor constraints, and rising inventories. The uptick in multi-family permits suggests a potentially stabilizing trend, though it’s important to note its volatility. The housing market’s mixed signals—weak single-family coupled with some resilience in multi-family—could mean continued drag on residential investment and the broader economy this year.

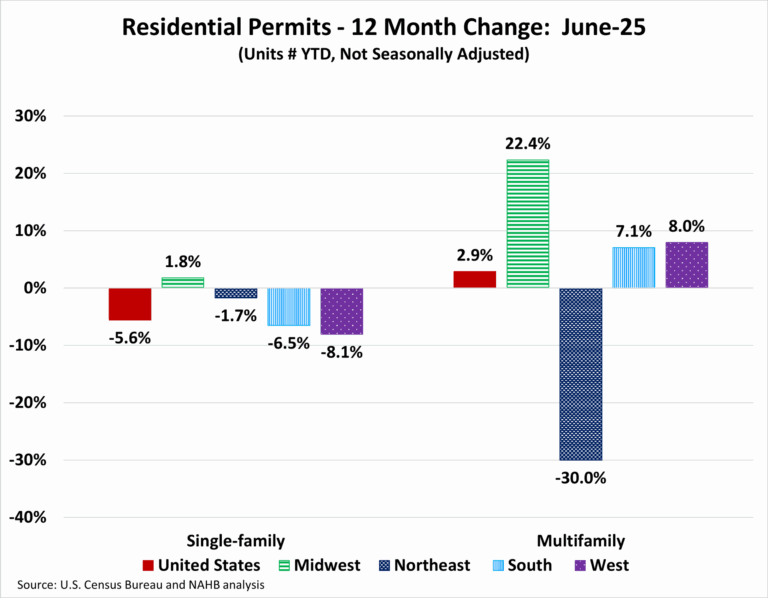
Over the first six months of 2025, the total number of single-family permits issued year-to-date (YTD) nationwide reached 485,935. On a year-over-year (YoY) basis, this is a decline of 5.6% over the June 2024 level of 514,728. For multifamily, the total number of permits issued nationwide reached 244,812. This is 2.9% higher compared to the June 2024 level of 237,935.

Year-to-date ending in June, single-family permits were up in one out of the four regions. The Midwest posted a small increase of 1.8%. The Northeast was 1.7% lower, the South was down by 6.5%, and the West was down by 8.1% in single-family permits during this time. For multifamily permits, three out of the four regions posted increases. The Midwest was up by 22.4%, the West was up by 8.0%, and the South was up by 7.1%, Meanwhile, the Northeast declined steeply by 30.0%, driven by the New York-Newark-Jersey City, NY-NJ MSA which declined by 40.0%.

Between June 2025 YTD and June 2024 YTD, 15 states posted an increase in single-family permits. The range of increases spanned 19.9% in Hawaii to 0.2% in Kentucky. The remaining 35 states and the District of Columbia reported declines in single-family permits with the District of Columbia reporting the steepest decline of 24.2%.

The ten states issuing the highest number of single-family permits combined accounted for 63.0% of the total single-family permits issued. Texas, the state with the highest number of single-family permits, issued 78,104 permits over the first six months of 2025; this is a decline of 8.0% compared to the same period last year. The second highest state, Florida, decreased by 10.6%, while the third highest, North Carolina, posted a decline of 0.9%.

Between June 2025 YTD and June 2024 YTD, 29 states recorded growth in multifamily permits, while 21 states and the District of Columbia recorded a decline. Iowa (+165.5%) led the way with a sharp rise in multifamily permits from 1,178 to 3,128, while Alabama had the largest decline of 49.6% from 1,788 to 901.

The ten states issuing the highest number of multifamily permits combined accounted for 61.8% of the multifamily permits issued. Over the first six months of 2025, Florida, the state with the highest number of multifamily permits issued, experienced an increase of 25.0%. Texas, the second-highest state in multifamily permits, saw an increase of 14.1%. California, the third largest multifamily issuing state, increased by 11.5%.

At the local level, below are the top ten metro areas that issued the highest number of single-family permits.

For multifamily permits, below are the top ten local areas that issued the highest number of permits.

Discover more from Eye On Housing

Subscribe to get the latest posts sent to your email.


This article was originally published by a eyeonhousing.org . Read the Original article here. .

Housing permits continued a downhill trend for the fifth month in a row, pointing to a broader residential construction slowdown for 2025. This slowdown is attributed to factors like higher mortgage rates, tariff concerns, and challenges about future housing demand due to economic uncertainty.

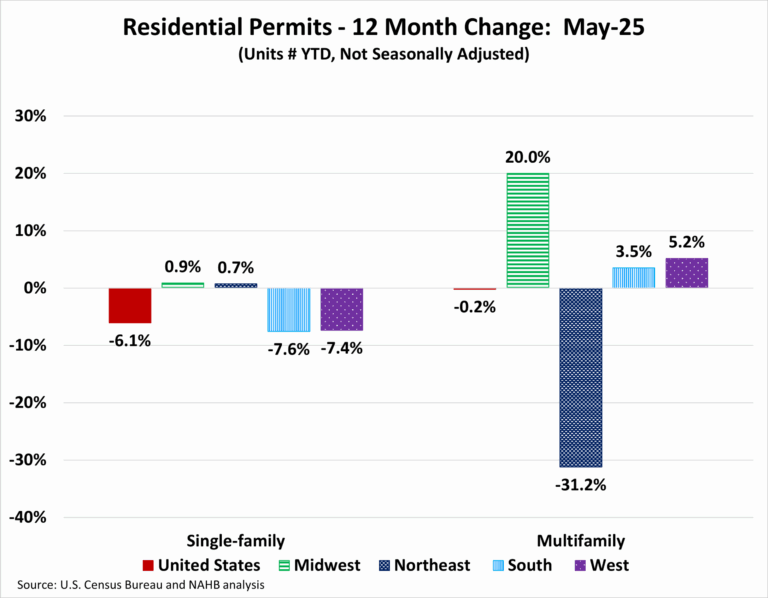
Over the first five months of 2025, the total number of single-family permits issued year-to-date (YTD) nationwide reached 404,977. On a year-over-year (YoY) basis, this is a decline of 6.1% over the May 2024 level of 431,196. For multifamily, the total number of permits issued nationwide reached 195,561. This is essentially unchanged from the May 2024 level of 195,932.

Year-to-date ending in May, single-family permits were up in two out of the four regions. The Midwest and the Northeast posted small increases of 0.9% and 0.7% respectively. The South was down by 7.6% and the West was down by 7.4% in single-family permits during this time. For multifamily permits, three out of the four regions posted increases. The Midwest was up by 20.0%, the West was up by 5.2%, and the South was up by 3.5%, Meanwhile, the Northeast declined steeply by 31.2%, driven by the New York-Newark-Jersey City, NY-NJ MSA which declined by 42.0%.

Between May 2025 YTD and May 2024 YTD, 16 states posted an increase in single-family permits. The range of increases spanned 26.2% in Hawaii to 0.4% in Pennsylvania. The remaining 34 states and the District of Columbia reported declines in single-family permits with New Mexico reporting the steepest decline of 24.5%.

The ten states issuing the highest number of single-family permits combined accounted for 63.2% of the total single-family permits issued. Texas, the state with the highest number of single-family permits, issued 66,055 permits over the first five months of 2025; This is a decline of 8.7% compared to the same period last year. The second highest state, Florida, decreased by 12.2%, while the third highest, North Carolina, posted a decline of 3.9%.

Between May 2025 YTD and May 2024 YTD, 27 states recorded growth in multifamily permits, while 23 states and the District of Columbia recorded a decline. Iowa (+168.0%) led the way with a sharp rise in multifamily permits from 781 to 2,093, while Alabama had the biggest decline of 54.7% from 1,676 to 760.

The ten states issuing the highest number of multifamily permits combined accounted for 61.1% of the multifamily permits issued. Over the first five months of 2025, Florida, the state with the highest number of multifamily permits issued, experienced an increase of 14.5%. Texas, the second-highest state in multifamily permits, saw an increase of 12.7%. California, the third largest multifamily issuing state, increased by 1.1%.

At the local level, below are the top ten metro areas that issued the highest number of single-family permits.

For multifamily permits, below are the top ten local areas that issued the highest number of permits.

Discover more from Eye On Housing

Subscribe to get the latest posts sent to your email.


This article was originally published by a eyeonhousing.org . Read the Original article here. .
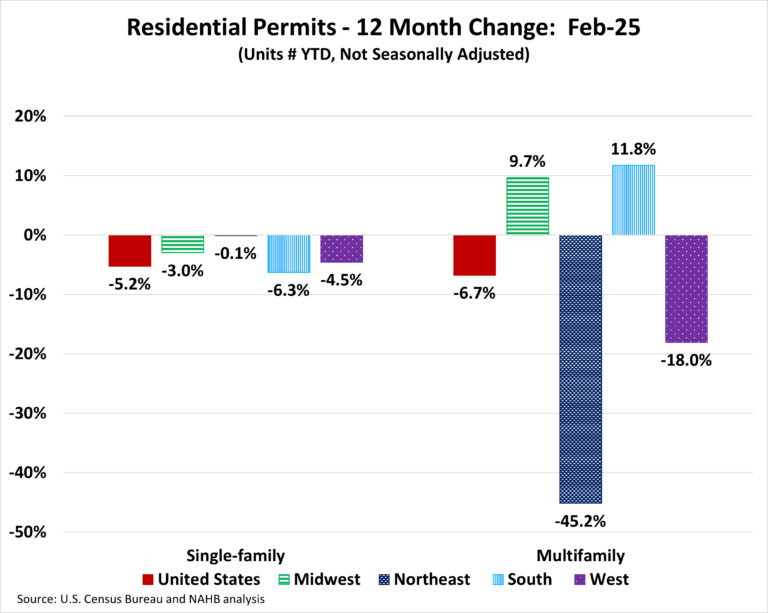

Permits continue the downward trend for the second month in a row. Over the first two months of 2025, the total number of single-family permits issued year-to-date (YTD) nationwide reached 147,119. On a year-over-year (YoY) basis, this is a decline of 5.2% over the February 2024 level of 155,236. For multifamily, the total number of permits issued nationwide reached 72,979. This is 6.7% below the February 2024 level of 78,259.

Year-to-date ending in February, single-family permits were down in all four regions. The Northeast posted the smallest decline of 0.1%, the Midwest was down by 3.0%, the West was down by 4.5% and the South was down by 6.3% in single-family permits during this time. For multifamily permits, two out of the four regions posted increases. The South was up by 11.8% and the Midwest was up by 9.7%. Meanwhile, the West posted a decline of 18.0% and the Northeast declined steeply by 45.2%.

Between February 2025 YTD and February 2024 YTD, 19 states and the District of Columbia posted an increase in single-family permits. The range of increases spanned 133.3% in the District of Columbia to 0.1% in New Jersey. The remaining 31 states reported declines in single-family permits with West Virginia reporting the steepest decline of 21.1%.

The ten states issuing the highest number of single-family permits combined accounted for 65.6% of the total single-family permits issued. Texas, the state with the highest number of single-family permits, issued 24,960 permits over the first two months 2025, which is a decline of 5.6% compared to the same period last year. The second highest state, Florida, was down by 8.3%, while the third highest, North Carolina, posted a decline of 4.5%.

Between February 2025 YTD and February 2024 YTD, 26 states and the District of Columbia recorded growth in multifamily permits, while 24 states recorded a decline. Iowa (+177.4%) led the way with a sharp rise in multifamily permits from 354 to 982, while Arizona had the biggest decline of 67.5% from 3,209 to 1,044.

The ten states issuing the highest number of multifamily permits combined accounted for 63.2% of the multifamily permits issued. Over the first two months of 2025, Florida, the state with the highest number of multifamily permits issued, experienced an increase of 63.0%. Texas, the second-highest state in multifamily permits, saw a decline of 9.0%. California, the third largest multifamily issuing state, decreased by 21.7%.

At the local level, below are the top ten metro areas that issued the highest number of single-family permits.

For multifamily permits, below are the top ten local areas that issued the highest number of permits.

Discover more from Eye On Housing

Subscribe to get the latest posts sent to your email.


This article was originally published by a eyeonhousing.org . Read the Original article here. .
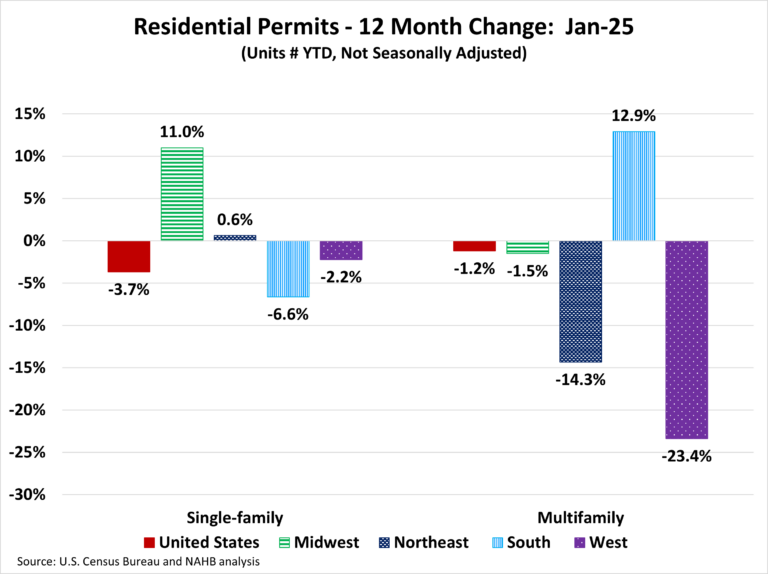

Permits are off to a lower level to start the new year. Over the first month of 2025, the total number of single-family permits issued year-to-date (YTD) nationwide reached 73,115. On a year-over-year (YoY) basis, this is a decline of 3.7% over the January 2024 level of 75,906. For multifamily, the total number of permits issued nationwide reached 38,402. This is 1.2% below the January 2024 level of 38,870.

Year-to-date ending in January, single-family permits were up in the Midwest (+11.0%) and the Northeast (+0.6%) but down in the two remaining regions. The West was down by 2.2% and the South was down by 6.6% in single-family permits during this time. For multifamily permits, three out of the four regions posted declines. The South was up by 12.9% but the West posted a decline of 23.4%, the Northeast declined by 14.3%, and the Midwest declined by 1.5%.

Between January 2025 YTD and January 2024 YTD, 26 states and the District of Columbia posted an increase in single-family permits. The range of increases spanned 525.0% in the District of Columbia to 0.1% in Utah. The remaining 24 states reported declines in single-family permits with Alaska reporting the steepest decline of 23.1% .

The ten states issuing the highest number of single-family permits combined accounted for 65.4% of the total single-family permits issued. Texas, the state with the highest number of single-family permits, issued 12,179 permits over the first month 2025, which is a decline of 4.2% compared to the same period last year. The second highest state, Florida, was down by 13.9%, while the third highest, North Carolina, posted a decline of 11.4%.

Between January 2025 YTD and January 2024 YTD, 22 states recorded growth in multifamily permits, while 27 states and the District of Columbia recorded a decline. In January 2024, Alaska issued zero permits and issued 9 multifamily permits in January 2025. Therefore, the growth rate for Alaska is undefined. The District of Columbia (+1,282.4%) led the way with a sharp rise in multifamily permits from 17 to 235, while Delaware had the biggest decline of 90.9% from 176 to 16.

The ten states issuing the highest number of multifamily permits combined accounted for 67.6% of the multifamily permits issued. Over the first month of 2025, Florida, the state with the highest number of multifamily permits issued, experienced an increase of 48.0%. Texas, the second-highest state in multifamily permits, saw a decline of 23.1%. New York, the third largest multifamily issuing state, decreased by 19.4%.

At the local level, below are the top ten metro areas that issued the highest number of single-family permits.

For multifamily permits, below are the top ten local areas that issued the highest number of permits.

Discover more from Eye On Housing

Subscribe to get the latest posts sent to your email.


This article was originally published by a eyeonhousing.org . Read the Original article here. .
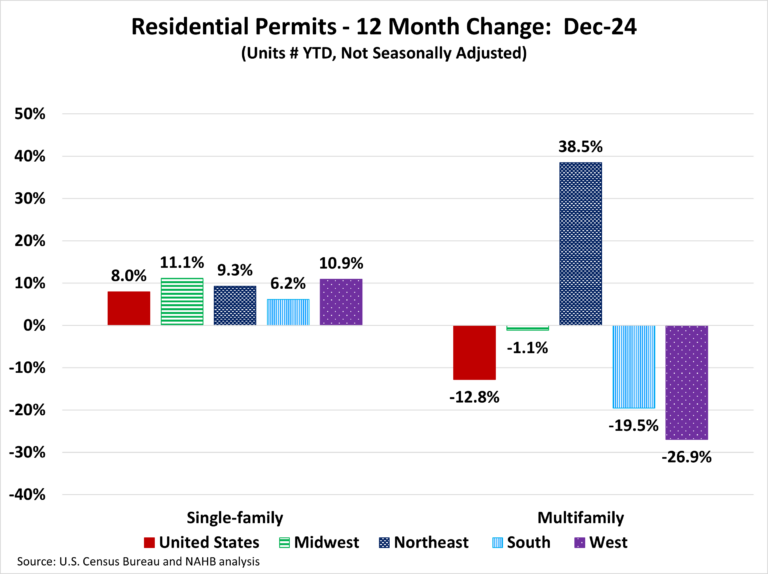

Over 2024, the total number of single-family permits issued year-to-date (YTD) nationwide reached 981,834. On a year-over-year (YoY) basis, this is an increase of 8.0% over the 2023 level of 909,227.

Year-to-date ending in December, single-family permits were up in all four regions. The range of permit increases spanned 11.1% in the Midwest to 6.2% in the South. The West was up by 10.9% and the Northeast was up by 9.3% in single-family permits during this time. For multifamily permits, three out of the four regions posted declines. The Northeast, driven by New York City’s MSA, was the only region to post an increase and was up by 38.5%. Meanwhile, the West posted a decline of 26.9%, the South declined by 19.5%, and the Midwest declined by 1.1%.

Between December 2024 YTD and December 2023 YTD, 45 states posted an increase in single-family permits. The range of increases spanned 33.8% in Montana to 0.1% in South Dakota. The remining five states and the District of Columbia reported declines in single-family permits. The ten states issuing the highest number of single-family permits combined accounted for 63.1% of the total single-family permits issued. Texas, the state with the highest number of single-family permits, issued 158,544 permits over 2024, which is an increase of 9.3% compared to the same period last year. The second highest state, Florida, was down by 0.9%, while the third highest, North Carolina, posted an increase of 6.7%.

For 2024, the total number of multifamily permits issued nationwide reached 489,533. This is 12.8% below the 2023 level of 561,369.

Between December 2024 YTD and December 2023 YTD, 22 states recorded growth in multifamily permits, while 28 states and the District of Columbia recorded a decline. New York (+128.7%) led the way with a sharp rise in multifamily permits from 15,293 to 34,982, while Idaho had the biggest decline of 53.0% from 5,891 to 2,771. The ten states issuing the highest number of multifamily permits combined accounted for 62.4% of the multifamily permits issued. Over 2024, Texas, the state with the highest number of multifamily permits issued, experienced a decline of 18.6%. Florida, the second-highest state in multifamily permits, saw a decline of 27.5%. California, the third largest multifamily issuing state, decreased by 26.2%.

At the local level, below are the top ten metro areas that issued the highest number of single-family permits.

For multifamily permits, below are the top ten local areas that issued the highest number of permits.

Discover more from Eye On Housing

Subscribe to get the latest posts sent to your email.


This article was originally published by a eyeonhousing.org . Read the Original article here. .

Pin It