Tag

other housing data

Browsing


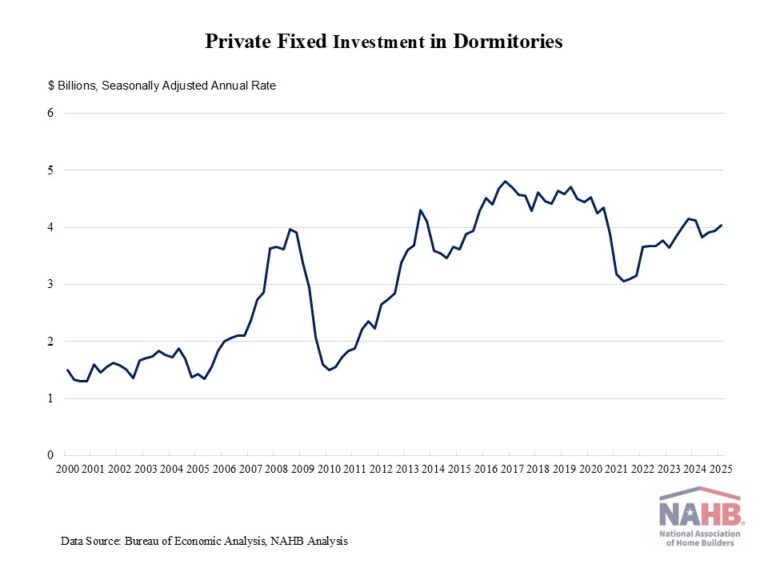
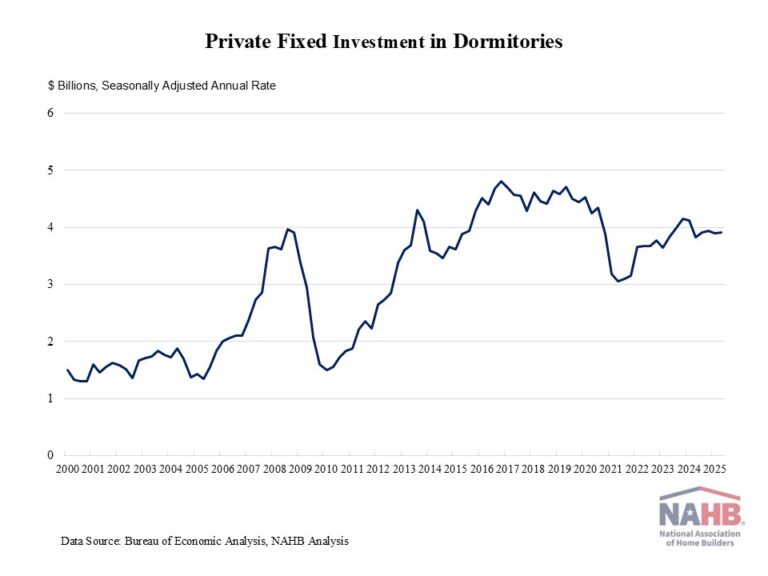
Private fixed investment in student dormitories inched up 0.3% in the second quarter of 2025, reaching a seasonally adjusted annual rate (SAAR) of $3.9 billion. This gain followed a 1.1% decrease in the previous quarter, as elevated interest rates placed a damper on student housing construction. Moreover, private fixed investment in dorms was 2.1% higher than a year ago 

Private fixed investment in student housing experienced a surge after the Great Recession, as college enrollment increased from 17.2 million in 2006 to 20.4 million in 2011. However, during the pandemic, private fixed investment in student housing declined drastically from $4.4 billion (SAAR) in the last quarter of 2019 to a lower annual pace of $3 billion in the second quarter of 2021, as COVID-19 interrupted normal on-campus learning. According to the National Student Clearinghouse Research Center, college enrollment fell by 3.6% in the fall of 2020 and by 3.1% in the fall of 2021.  

Since then, private fixed investment in dorms has rebounded, as college enrollments show a gradual recovery from pandemic driven declines. Effective in-person learning requires college students to return to campuses, boosting the student housing sector.  Still, demographic trends are reshaping the outlook for student housing. The U.S. faces slower growth in the college-age population as birth rates declined following the Great Recession. As a result, total enrollment in postsecondary institutions is projected to only increase 8% from 2020 to 2030, according to the National Center for Education Statistics, well below the 37% increase between 2000 and 2010. 

Despite recent fluctuations, the student housing construction shows signs of recovery and future growth is expected in response to increasing student enrollment projections. 

Discover more from Eye On Housing

Subscribe to get the latest posts sent to your email.


This article was originally published by a eyeonhousing.org . Read the Original article here. .


Personal income increased by 0.3% in June, following a 0.4% dip in May, according to the latest data from the Bureau of Economic Analysis. The gains in personal income were largely driven by higher wages and social benefits. However, the pace of personal income growth slowed from its peak monthly gain of 1.4% in January 2024.  

Real disposable income, the amount remaining after adjusted for taxes and inflation, was unchanged in June, following a 0.7% decline in May. On a year-over-year basis, real (inflation-adjusted) disposable income rose 1.7%, down from a 6.5% year-over-year peak recorded in June 2023.  

Spending also showed signs of softening. Personal consumption expenditures rose 0.3% in June, after staying flat in May. Real spending, adjusted to remove inflation, increased 0.1% in June, with expenditures on goods climbing 0.1% and spending on services up 0.1%.


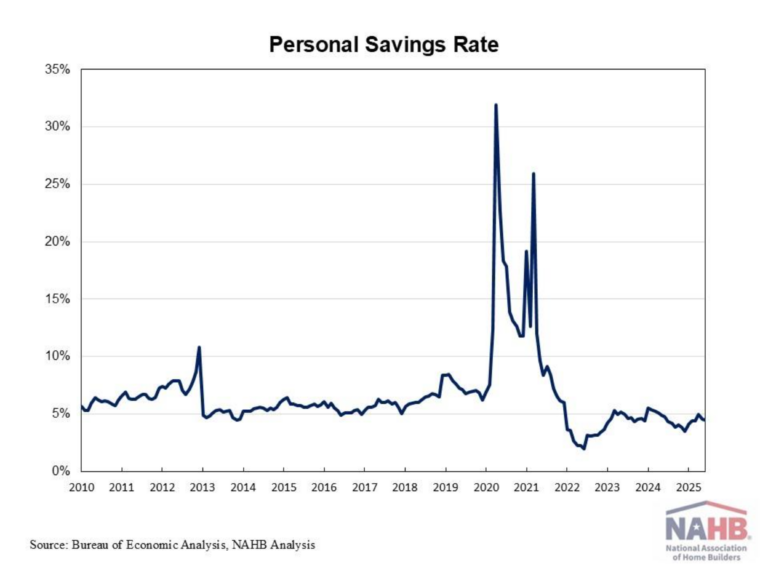
With income growth outpacing spending, the personal savings rate increased to 4.5% in June. But with inflation eroding compensation gains, people are dipping into savings to support spending. This trend will ultimately lead to a slowing of consumer spending. 

Discover more from Eye On Housing

Subscribe to get the latest posts sent to your email.


This article was originally published by a eyeonhousing.org . Read the Original article here. .


The latest homeownership rate declined to 65% in the second quarter of 2025, marking its lowest level since late 2019, according to the Census’s Housing Vacancy Survey (HVS). With mortgage interest rates remaining elevated and housing supply still tight, housing affordability is at a multidecade low. Compared to the peak of 69.2% in 2004, the homeownership rate is currently 4.2 percentage points lower and remains below the 25-year average rate of 66.3%.

Compared to the previous quarter, the homeownership rate dropped by 0.1 percentage point.[OD1]  Additionally, homeownership rates dropped amongst almost all age groups. Householders aged 45-54 experienced the largest drop, declining by 1.9 percentage points from 71.1% to 69.2%. The 35-44 age group saw a 1.2 percentage point decrease, decreasing from 62.2% to 61%. Among younger households, the homeownership rate for those under 35 dropped 1percentage points to 36.4% in the second quarter of 2025, hovering near the lowest rate in the last 6 years. This age group, particularly sensitive to mortgage rates and the inventory of entry-level homes. However, homeownership rates for householders aged 55-64 and 65 years and over stayed unchanged from a year ago.

The national rental vacancy rate inched down to 7% for the second quarter of 2025, after steadily increasing since 2021. Meanwhile, the homeowner vacancy rate stayed at 1.1%, remaining near the survey’s 67-year low of 0.7%.

The housing stock-based HVS revealed that the count of total households increased to 132.5 million in the second quarter of 2025 from 131.3 million a year ago. This increase was driven entirely by renter household growth, which added 1.2 million new households. Meanwhile, the number of owner-occupied households declined by 39,000 over the same period.

Discover more from Eye On Housing

Subscribe to get the latest posts sent to your email.


This article was originally published by a eyeonhousing.org . Read the Original article here. .


The majority of single-family home builders do not currently use Artificial Intelligence (AI) in their businesses.  For the highest use, 20% of builders use AI to generate advertising/marketing materials and 11% to help analyze markets/plan projects.  Less than 5% currently use this tool to help with another 10 business functions, from designing projects to operating automated construction equipment in the chart below. These findings were derived from the July 2025 survey for the NAHB/Wells Fargo Housing Market Index (HMI) and reflect an early industry reading likely to evolve in the coming years.

Builders not currently using AI were asked about the likelihood they will start doing so in the next two years (using a scale from 1 to 5, where 1=not at all likely and 5=very likely).  Not surprisingly, the two areas most likely to see new builders adopting AI are the generation of advertising/marketing materials (average rating 3.6) and the analysis of markets/plan projects (3.0)—the same ones that boast the largest adoption rates already.

Meanwhile, the chance that builders will take up the use of AI in any of the other business functions is much lower, as all 10 received average likelihood ratings below 3.0.  The two areas where builders are least likely to start using AI in the next two years are in the operation of automated construction equipment (average rating: 1.7) and to interact with the local building or planning department (1.9).

Discover more from Eye On Housing

Subscribe to get the latest posts sent to your email.


This article was originally published by a eyeonhousing.org . Read the Original article here. .


An earlier post described how the top 10 builders in the country captured a record 44.7% of new single-family closings in 2024. BUILDER Magazine has now released additional data on the top ten builders within each of the 50 largest new home markets in the U.S., ranked by single-family permits. It is important to note that this post does not focus on the top ten largest home builders nationally; instead, it analyzes the top ten list within each of the largest 50 new housing markets.

The 2024 data show that the top 10 builder concentration in the 50 largest markets ranged from 38.9% in Kansas City, MO-KS to 97.8% in Cincinnati, OH. In 11 metro areas, the top ten builders’ market share exceeded 90%. Across all 50 metro areas, the average market share of the top 10 builders was 79.3%, up from 78.2% in 2023.  

Looking at the results on a map reveals that southern California, South Carolina, Florida, and parts of the Midwest include multiple highly concentrated markets, while Texas and the Northwest include markets with lower levels of concentration (figure 1).

Lennar and D.R. Horton each made the top ten builder list in 46 markets, the most among all builders. PulteGroup was next with 36 metro markets, followed by NVR and Meritage Homes with 22 and 20 metro markets, respectively.

From 2023 to 2024, 27 metro areas saw an increase in their top 10 builders’ market share, compared with 36 increases from 2022 to 2023. Seven metro areas experienced a double-digit increase in 2024:

Oklahoma City, OK (+20.7 percentage points, 82.8%)

Atlanta-Sandy Springs-Alpharetta, GA (+14.7 percentage points, 76.8%)

Punta Gorda, FL (+11.5 percentage points, 85.9%)

Philadelphia-Camden-Wilmington, PA-NJ-DE-MD (+10.7 percentage points, 87.5%)

Greenville-Anderson, SC (+10.6 percentage points, 89.3%)

Salt Lake City, UT (+10.5 percentage points, 69.8%)

Charleston-North Charleston, SC (+10.4 percentage points, 92.3%)

Meanwhile, 20 metro areas saw a decline in their top 10 builders’ market share from 2023 to 2024, up from only 9 decreases from 2022 to 2023. The largest decreases were seen in:

Miami-Fort Lauderdale-Pompano Beach, FL (-18.1 percentage points, 72.4%)

Los Angeles-Long Beach-Anaheim, CA (-14.7 percentage points, 75.6%)

Orlando-Kissimmee-Sanford, FL (-11.6 percentage points, 76.8%)

Tucson, AZ (-10.4 percentage points, 82.4%

Of the remaining three largest markets, Cape Coral-Fort Myers, FL saw no change in its top ten builder concentration (96.2%) from 2023 to 2024, while Fresno, CA and Spartanburg, SC are new to the top 50 market list in 2024.

Discover more from Eye On Housing

Subscribe to get the latest posts sent to your email.


This article was originally published by a
eyeonhousing.org . Read the Original article here. .


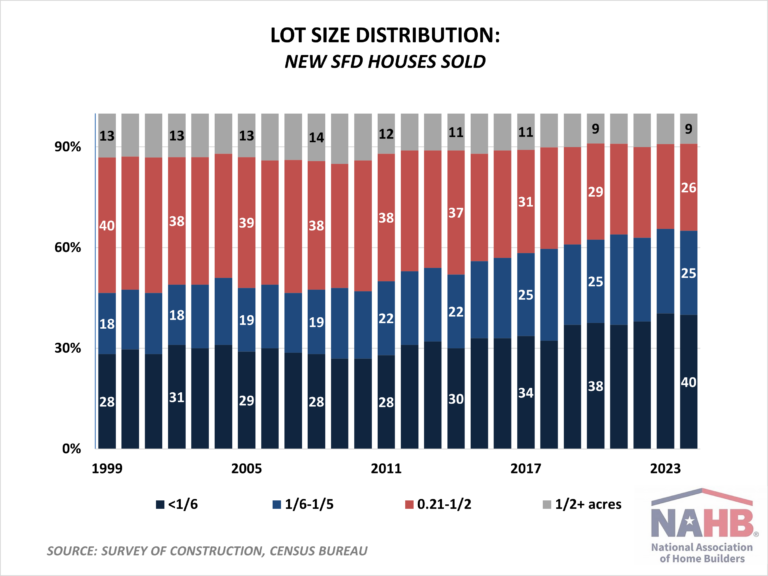
The share of smaller lots remained record high in 2024, with two out of three new single-family detached homes sold occupying lots under 9,000 square feet (1/5 of an acre or less). Moreover, a high share of 40% occupied lots under 7,000 square feet (or less than 1/6 of an acre). These shares match the record highs established a year earlier, according to the latest Survey of Construction (SOC). Analysis of a quarter-century of SOC data reveals stark changes in the lot size distribution and documents a dramatic shift towards more compact building over the last two decades.

In 1999, when the Census Bureau started tracking these series, less than half (46%) of new for-sale single-family detached homes occupied lots under 9,000 square feet. The share of these smaller lots fluctuated around 48%, never crossing the 50% mark, until 2011. A shift in speculatively built (or spec) home building towards smaller lots first became noticeable during the anemic housing recovery that followed the Great Recession. Over that period, the share of spec homes built on lots smaller than or equal to one-fifth of an acre rose rapidly, from 47% in 2010 to 61% right before the pandemic.

The trend towards more compact spec building continued during the post-pandemic housing boom, with the share of smaller lots gaining an additional 4 percentage points during the last five years. The persistent shift towards building spec homes on smaller lots is seemingly harder to explain against the backdrop of the pandemic-triggered suburban flight and presumed shifts in preferences towards more spacious living. Less indicative of changing consumer preferences or the residential business cycle, the steadily rising share of spec homes built on smaller lots undoubtedly reflects unprecedented lot shortages confronted by home builders and their attempts to make new homes more affordable.

A closer look at the lot size distribution since 2010 reveals that the most dramatic shifts took place at the lowest end, with lots smaller than 7,000 square feet (or under 1/6 of an acre) increasing their share by 13 percentage points. In 2010, 27% of all sold single-family detached homes occupied lots under 1/6 of an acre. The share was not much different from the 1999 recording of 28%. Fast forward to 2024, and the percentage increased to 40%. At the same time, the share of single-family detached spec homes occupying lots between 1/6 and 1/5 acres increased from 20% in 2010 to 25% in 2024.

At the other end of the lot size distribution, the share of spec homes built on larger lots exceeding half an acre shrank from 14% in 2010 to 9% in 2024. The share of homes occupying lots between a quarter and half an acre declined from 24% to 19% over that period. The market share of homes built on lots between 1/5 and 1/4 of an acre lost 8 percentage points, declining from 15% to 7%.

The median lot size of a new single-family detached home sold in 2024 is 8,506 square feet, or just under one-fifth of an acre. This is slightly larger but statistically not different from the lowest on record median of 8,177 square feet set a year before the COVID-19 pandemic.

While the nation’s production of spec homes shifts towards smaller lots, regional differences in lot sizes persist. Looking at single-family detached spec homes started in 2024, the median lot size in New England is three times larger than the national median.

New England is known for strict local zoning regulations that often require very low density. Therefore, it is not surprising that single-family detached spec homes started in New England are built on some of the largest lots in the nation, with half of the lots exceeding 0.6 acres. The East South Central division is a distant second on the list, with the median lot occupying 0.3 acres.

At the other end of the spectrum, the Pacific division, where densities are high and developed land is scarce, has the smallest lots, with half of the lots being under 0.13 acres. The bordering Mountain division also reports typical lots smaller (0.15 acres) than the national median.

In the South, the West South Central division stands out for starting half of single-family detached spec homes on lots under 0.15 acres. This is half the size of typical lots in the neighboring East South Central division.

The analysis above is limited to single-family detached speculatively built homes. Custom homes built on an owner’s land with either the owner or a builder acting as the general contractor do not involve the work of a professional land developer subdividing a property. Therefore, in the case of custom homes, lots refer to an owner’s land area rather than lots in a conventional sense. Nevertheless, the SOC reports lot sizes for custom homes and shows that they tend to have larger lots. The median lot size for custom single-family detached homes started in 2024 is one acre.

For regional analysis, the median lot size is chosen over the average since averages tend to be heavily influenced by extreme outliers. In addition, the Census Bureau often masks extreme lot sizes and values on the public use SOC dataset, making it difficult to calculate averages precisely, but medians (as the midpoint of a frequency distribution) remain unaffected by these procedures.

Discover more from Eye On Housing

Subscribe to get the latest posts sent to your email.


This article was originally published by a eyeonhousing.org . Read the Original article here. .


Remote work may no longer dominate the U.S. labor force as it did during the height of the pandemic in 2020, but it still represents a substantial share of employment today. According to the latest data from the Current Population Survey (CPS), approximately 34.3 million employed people teleworked or worked at home for pay in April 2025. The telework rate, which represents the number of people who teleworked as a percentage of people who were working, was 21.6% in April, and it has consistently ranged between 17.9% and 23.8% between October 2022 and April 2025.

Of those who teleworked in April, more than half teleworked for all their working hours, while the remaining teleworked for some, but not all, of their work hours.

The distribution of telework across the U.S. workforce continues to reflect deeper patterns shaped by gender, age, education, occupation, and industry. The following insights are based on an analysis of monthly CPS data.

Gender: Women Lead in Telework

Women continue to outpace men in remote work participation.

Nearly 25% of employed women worked from home in April 2025.

In contrast, about 19% of employed men teleworked.

This gender gap reflects employment trends. Many women are employed in professional, administrative, or office-based roles. These fields transitioned smoothly to remote work during the pandemic and have largely maintained hybrid or fully remote options. Additionally, the growing rate of college completion among women1 has pushed more women into positions that are structurally suited to telework. Flexibility remains a priority, especially for women balancing work and caregiving responsibilities, further reinforcing the demand for work-from-home arrangements.

Age: Older Workers Are More Likely to Telework

Age also plays a major role in who works remotely. Workers aged 25 and older are more likely to telework than their younger counterparts.

Ages 16–24: Only 6.2% worked from home.

Ages 25–54: About 24% reported teleworking.

Ages 55+: Around 23% worked remotely.

Younger workers tend to fill entry-level roles in retail, hospitality, and service sectors that require in-person attendance. Meanwhile, older workers are more likely to have progressed in their careers into managerial or specialized roles where remote work is feasible or even expected.

Education: Higher Degrees, Higher Telework Rates

Education remains one of the strongest indicators of telework status. Higher educational attainment is positively associated with a higher telework rate.

No high school diploma: Just 3.1% worked remotely.

High school graduates, no college: 8.4% teleworked.

Some college or associate degree: 17.3% reported working from home.

Bachelor’s degree or higher: 38.3% worked remotely.

Higher educational attainment often leads to employment in knowledge-based sectors such as finance, information technology, consulting, and research. These roles often depend on digital communication tools and independent project-based tasks, making them well-suited for remote settings.

Occupation: Business and Financial Operations, and Professionals Dominate Remote Work

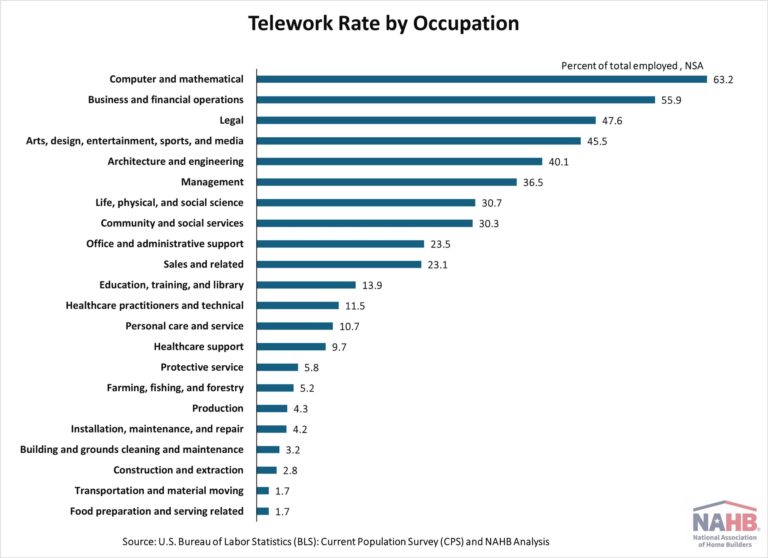
Not surprisingly, occupation heavily influences access to teleworking. Jobs that require physical presence, such as those in food service, transportation, manufacturing, and construction, naturally offer limited remote opportunities. In contrast, people employed in professional and technical fields report the highest telework rate, especially those working in computer and mathematical roles.

Industry trends mirror these occupational divisions. Certain sectors have fully embraced telework, particularly finance, information services, and professional and business services. These industries often prioritize flexibility and are structured in ways that make remote work not only possible but efficient. On the other hand, industries like construction, leisure and hospitality remain firmly grounded in physical spaces and in-person involvement. In these fields, work is inherently tied to locations and equipment that cannot be replicated remotely. The construction industry had a telework rate of just 9.8% in April, and leisure and hospitality reported an even lower rate of 8.1%.

Looking Ahead:

Remote work is not disappearing; it is evolving. The opportunity to work from home is increasingly concentrated among individuals with higher education levels, white-collar job titles, and positions in tech-driven or office-based industries. Meanwhile, those who are younger, have less educational attainments, or work in manual or service-based roles remain largely tied to traditional, in-person work.

For the future, we don’t know if telework will expand to become more inclusive or continue reinforcing existing divides in education and job roles. For now, the data suggests that remote work is here to stay, but only for some.

Note:

“U.S. women are outpacing men in college completion, including in every major racial and ethnic group”, Pew Research Center.

Connor Borkowski and Rifat Kaynas, “Telework trends,” Beyond the Numbers: Employment & Unemployment, vol. 14, no. 2 (U.S. Bureau of Labor Statistics, March 2025),

Discover more from Eye On Housing

Subscribe to get the latest posts sent to your email.


This article was originally published by a eyeonhousing.org . Read the Original article here. .


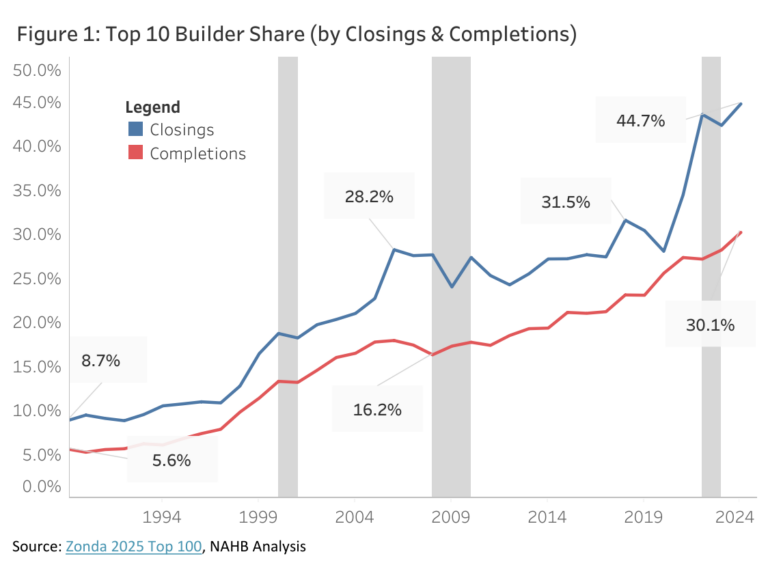
The top ten builders captured a record 44.7% of all new U.S. single-family home closings in 2024, up 2.4 percentage points from 2023 (42.3%). This is the highest share ever captured by the top ten builders since NAHB began tracking BUILDER magazine data on new single-family home closings in 1989. The 2024 share constitutes 306,932 closings out of 686,000 new single-family houses sold in 2024. However, closings by the top 10 builders only represent 30.1% of new single-family home completions, a wider measure of home building that covers not-for-sale home construction. Also of note, the top 15 builders accounted for more than half of all closings (51%) for the first time ever in 2024.

The top ten builder share has increased significantly –albeit unevenly– in the last 35 years. In 1989, the top ten builders accounted for only 8.7% of single-family home closings. By 2000, the share had more than doubled to 18.7%, growing to 28.2% by 2006 and 31.5% by 2018. After slight declines in 2019 and 2020, the share exceeded 40% for the first time in 2022 (43.5%) and reached a record high in 2024 (44.7%). (Figure 1).

Meanwhile, the top ten builder share by completions, has also trended upward, with a share of just 5.6% in 1989. It reached double digits for the first time in 1999 (11.3%) and rose to a cycle high of 17.9% in 2006. The share broke the 20% mark for the first time in 2015 (21.0%) and has continued to trend upward since, reaching an all-time high of 30.1% in 2024 (Figure 1).

The top five highest producing builders did not change from 2023 to 2024, with D.R. Horton maintaining its position as America’s largest single-family home builder. D.R. Horton captured 13.6% of the market with 93,311 closings, marking a fourth consecutive year with a market share above 10%, and a 23rd consecutive year atop the list. Results also show that 2024 marked the third year in a row where the top three builders accounted for more than a quarter (29.9%) of overall closings, with Lennar and PulteGroup achieving 11.7% and 4.6%, respectively. With 3.3% and 2.3% of overall closings, NVR and Meritage Homes ranked fourth and fifth on the list, respectively.

Notably, SH Residential Holdings (U.S. subsidiary of Sekisui House, a Japanese homebuilder, who acquired M.D.C. Holdings in 2024) broke into the top ten in 2024, ranking sixth on the list with 2.2% of the market. Clayton Properties Group, ranking 8th in 2023, fell out of the top 10 for the first time since 2019. KB Home (2.1%), Taylor Morrison (1.9%), Century Communities (1.6%), and Toll Brothers (1.6%) round out the top 10 builders for 2024 (Figure 2).

Builder Magazine also released Local Leaders data on the top 10 builders in the top 50 largest new-home markets in the U.S. where ranking is determined by the number of single-family permits, which NAHB will analyze in a later post.

Discover more from Eye On Housing

Subscribe to get the latest posts sent to your email.


This article was originally published by a eyeonhousing.org . Read the Original article here. .


In a further sign of declining builder sentiment, the use of price incentives increased sharply in June as the housing market continues to soften.

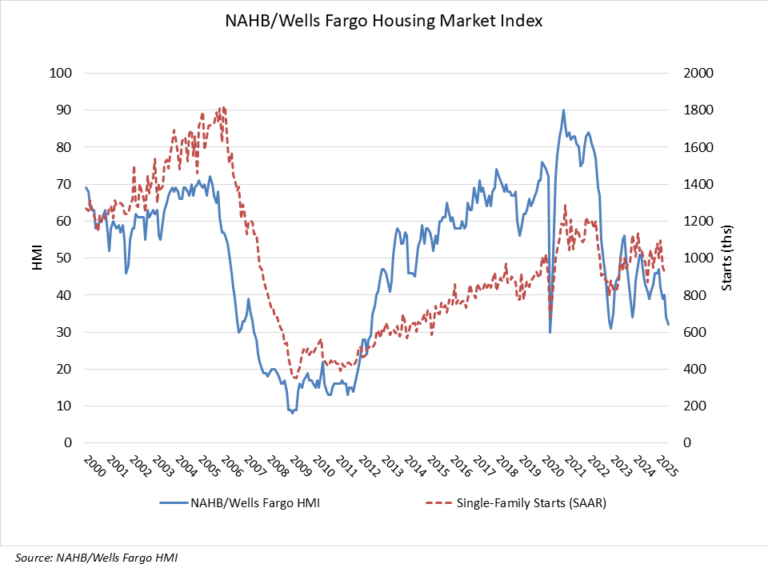
Builder confidence in the market for newly built single-family homes was 32 in June, down two points from May, according to the National Association of Home Builders (NAHB)/Wells Fargo Housing Market Index (HMI). The index has only posted a lower reading twice since 2012 – in December 2022 when it hit 31 and in April 2020 at the start of the pandemic when it plunged more than 40 points to 30.

Buyers have increasingly moved to the sidelines due to elevated mortgage rates and tariff and economic uncertainty. Consequently, the latest HMI survey revealed that 37% of builders reported cutting prices in June, the highest percentage since NAHB began tracking this figure on a monthly basis in 2022. This compares with 34% of builders who reported cutting prices in May and 29% in April. Meanwhile, the average price reduction was 5% in June, the same as it’s been every month since last November. The use of sales incentives was 62% in June, up one percentage point from May.

Rising inventory levels and prospective home buyers who are on hold waiting for affordability conditions to improve are resulting in weakening price growth in most markets and generating price declines for resales in a growing number of markets. Given current market conditions, NAHB is forecasting a decline in single-family starts for 2025.

Derived from a monthly survey that NAHB has been conducting for more than 35 years, the NAHB/Wells Fargo HMI gauges builder perceptions of current single-family home sales and sales expectations for the next six months as “good,” “fair” or “poor.” The survey also asks builders to rate traffic of prospective buyers as “high to very high,” “average” or “low to very low.” Scores for each component are then used to calculate a seasonally adjusted index where any number over 50 indicates that more builders view conditions as good than poor.

All three of the major HMI indices posted losses in June. The HMI index gauging current sales conditions fell two points in June to a level of 35, the component measuring sales expectations in the next six months dropped two points lower to 40 while the gauge charting traffic of prospective buyers posted a two-point decline to 21, the lowest reading since November 2023.

Looking at the three-month moving averages for regional HMI scores, the Northeast fell one point to 43, the Midwest moved one point higher to 41, the South dropped three points to 33 and the West declined four points to 28. HMI tables can be found at nahb.org/hmi.

Discover more from Eye On Housing

Subscribe to get the latest posts sent to your email.


This article was originally published by a eyeonhousing.org . Read the Original article here. .


Private fixed investment in student dormitories increased by 2.3% in the first quarter of 2025, reaching a seasonally adjusted annual rate (SAAR) of $4.04 billion. This gain followed a 1.0% increase in the previous quarter. However, private fixed investment in dorms was 2% lower than a year ago, as elevated interest rates place a damper on student housing construction.  

Private fixed investment in student housing experienced a surge after the Great Recession, as college enrollment increased from 17.2 million in 2006 to 20.4 million in 2011. However, during the pandemic, private fixed investment in student housing declined drastically from $4.4 billion (SAAR) in the last quarter of 2019 to a lower annual pace of $3 billion in the second quarter of 2021, as COVID-19 interrupted normal on-campus learning. According to the National Student Clearinghouse Research Center, college enrollment fell by 3.6% in the fall of 2020 and by 3.1% in the fall of 2021.  

Since then, private fixed investment in dorms has rebounded, as college enrollments show a gradual recovery from pandemic driven declines. Effective in-person learning requires college students to return to campuses, boosting the student housing sector.  Still, demographic trends are reshaping the outlook for student housing. The U.S. faces slower growth in the college-age population as birth rates declined following the Great Recession. As a result, total enrollment in postsecondary institutions is projected to only increase 8% from 2020 to 2030, according to the National Center for Education Statistics, well below the 37% increase between 2000 and 2010. 

Despite recent fluctuations, the student housing construction shows signs of recovery and future growth is expected in response to increasing student enrollment projections. 

Discover more from Eye On Housing

Subscribe to get the latest posts sent to your email.


This article was originally published by a eyeonhousing.org . Read the Original article here. .

Pin It