Tag

multifamily

Browsing


Single-family housing starts declined in June to the lowest rate since July 2024 as elevated interest rates, rising inventories and ongoing supply-side issues continue to act as headwinds for the housing sector.

Due to a solid increase in multifamily production, overall housing starts increased 4.6% in June to a seasonally adjusted annual rate of 1.32 million units, according to a report from the U.S. Department of Housing and Urban Development and the U.S. Census Bureau.

The June reading of 1.32 million starts is the number of housing units builders would begin if development kept this pace for the next 12 months. Within this overall number, single-family starts decreased 4.6% to an 883,000 seasonally adjusted annual rate and are down 10% compared to June 2024. The multifamily sector, which includes apartment buildings and condos, increased 30% to an annualized 438,000 pace.

Single-family building conditions continued to weaken in June as housing affordability challenges caused builder traffic to move lower as buyers moved to the sidelines. Rising levels of resale inventory are also a headwind for the industry.

Single-family home building in the South is down 12.4% on a year-to-date basis, far outpacing declines in the Northeast and the West. However, single-family home building is up 10% on a year-to-date basis in the Midwest, where housing affordability conditions are generally better than much of the nation.

On a regional and year-to-date basis, combined single-family and multifamily starts were 28.8% higher in the Northeast, 13.1% higher in the Midwest, 8.1% lower in the South and 0.6% lower in the West.

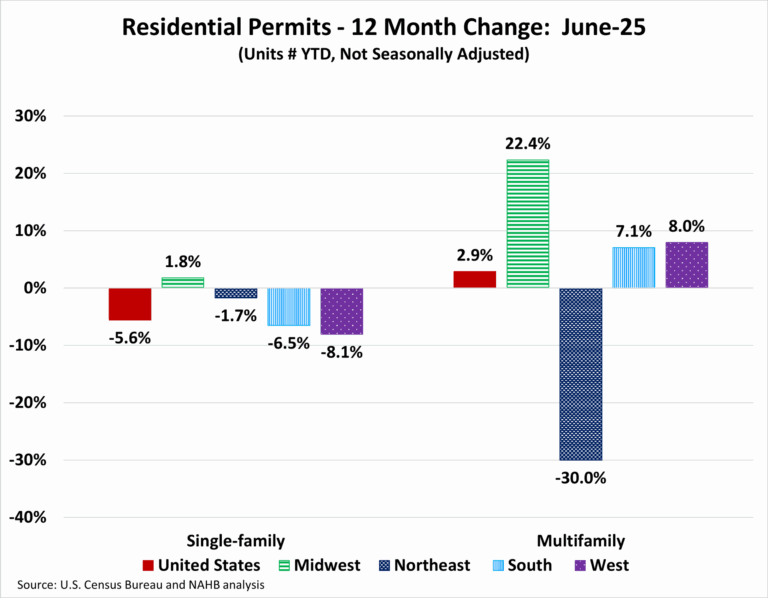
Overall permits increased 0.2% to a 1.40-million-unit annualized rate in June. Single-family permits decreased 3.7% to an 866,000-unit rate and are down 8.4% compared to June 2024. Multifamily permits increased 7.3% to a 531,000 pace.

Looking at regional permit data on a year-to-date basis, permits were 16.9% lower in the Northeast, 8.2% higher in the Midwest, 3.3% lower in the South and 3.7% lower in the West.

The declines for single-family home building have caused the number of single-family homes under construction to level off. There are currently 622,000 single-family homes under construction, which is 6% lower than a year ago. The number of apartments under construction in June, 739,000, is 18.8% lower than a year ago.

Discover more from Eye On Housing

Subscribe to get the latest posts sent to your email.


This article was originally published by a eyeonhousing.org . Read the Original article here. .

Multifamily units completed in 2024 recorded their highest level since 1986 at 608,000 units, according to NAHB analysis of the Census Bureau’s Survey of Construction. For the eighth consecutive year, most multifamily units were in buildings with 50 or more units (these will be labeled as high-density buildings).

As shown below, this trend is relatively new. Dating back to the earliest estimates in the series (1972), most multifamily units were historically located in buildings with less than 50 units (low-medium density buildings). Of the total 608,000 multifamily units completed in 2024, 330,000 (54%) were in high-density buildings while the remaining 278,000 (46%) were in low-medium density buildings.

Regional Distribution

The South continued to be the leading region in terms of units completed, rising from 212,000 in 2023 to 292,000 completions in 2024. The South accounted for 48% of the total number of completions; the West held 27% (163,000), the Midwest 14% (87,000), and the Northeast 11% (68,000). Singularly, the South was the only region where the number of units completed in low-medium density buildings outpaced the number in high-density buildings. The South had 147,000 completions in low-medium density compared to 145,000 units in high-density.

Conversely, in the Midwest and Northeast the number of units in high-density buildings nearly doubled those of low-medium density buildings. For the Midwest, there were 58,000 units in high-density buildings and 29,000 low-medium density units. The Northeast had 45,000 units in high-density buildings and 23,000 low-medium density units. The West featured an almost 50/50 split with 82,000 high-density units and 81,000 low-medium density.

Built-for-Rent

Among multifamily units completed in 2024, 95% were built-for-rent at a level of 580,000. Over half of these units (55%) were in a building with 50 units or more. This is a seismic shift towards high-density buildings, as this share was only 25% in 2004. Over the past twenty years, there has consistently been a falling share of units in buildings with 10-19 units, as the share in 2004 was 24%, while in 2024 this share only accounts for 4% of completed units.

Built-for-Sale

The number of multifamily units built-for-sale rose from 20,000 in 2023 to 29,000 in 2024. High-density buildings continued to be the primary type of building where these units were built, with 40% of built-for-sale units being completed in buildings with 50+ units. This share was up from 28% in 2023. The largest loss in market share for multifamily built-for-sale units was for buildings with 10-19 units, dropping from 23% in 2023 to just 13% in 2024.

Discover more from Eye On Housing

Subscribe to get the latest posts sent to your email.


This article was originally published by a eyeonhousing.org . Read the Original article here. .

A sharp decline in multifamily production pushed overall housing starts down in May, while single-family output was essentially flat due to economic and tariff uncertainty along with elevated interest rates.

Overall housing starts decreased 9.8% in May to a seasonally adjusted annual rate of 1.26 million units, according to a report from the U.S. Department of Housing and Urban Development and the U.S. Census Bureau.

The May reading of 1.26 million starts is the number of housing units builders would begin if development kept this pace for the next 12 months. Within this overall number, single-family starts increased 0.4% to a 924,000 seasonally adjusted annual rate and are down 7.3% compared to May 2024. The volatile multifamily sector, which includes apartment buildings and condos, decreased 29.7% in May to an annualized 332,000 pace.

On a year-to-date basis, single-family starts are down 7.1%. In contrast, multifamily 5-plus unit starts are up 14.5% as more prospective home buyers remain on the sidelines helping rental demand.

Single-family permits and construction starts are down on a year-to-date basis for 2025 for what has been a disappointing spring housing market, given ongoing elevated mortgage interest rates, challenging housing affordability conditions led by higher construction costs, and macroeconomic uncertainty. NAHB is forecasting that 2025 will end with a decline for single-family housing starts.

The number of single-family homes currently under construction totaled 623,000 homes as of May. This is 1.3% lower than April, 7.6% lower than a year ago and 25% lower than the post-Great Recession peak level in June 2022. There were 752,000 apartments under construction in June, 4.6% lower than May and 18.2% lower than a year ago.

On a regional and year-to-date basis, combined single-family and multifamily starts were 21.1% higher in the Northeast, 10.8% higher in the Midwest, 6.8% lower in the South and 1.6% lower in the West.

Overall permits decreased 2% to a 1.39-million-unit annualized rate in May. Single-family permits decreased 2.7% to an 898,000-unit rate and are down 6.4% compared to May 2024. Multifamily permits decreased 0.8% to a 495,000 pace.

Looking at regional permit data on a year-to-date basis, permits were 17.2% lower in the Northeast, 6% higher in the Midwest, 5.4% lower in the South and 3.7% lower in the West.

Discover more from Eye On Housing

Subscribe to get the latest posts sent to your email.


This article was originally published by a eyeonhousing.org . Read the Original article here. .

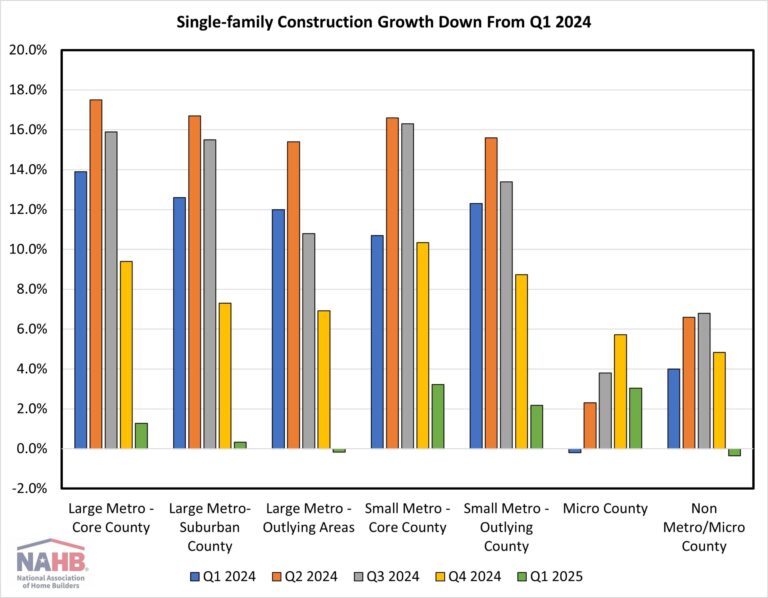
Single-family construction growth slowed substantially across all markets in the first quarter of 2025, according to the Home Building Geography Index (HBGI).  Multifamily construction growth remained negative in the largest markets but reported significant expansion in lower population density areas. The HBGI tracks single-family and multifamily permits across seven population density delineated geographies in the United States.  

Single-Family

Among the HBGI geographies, the highest growth in the first quarter of 2025 was registered in small metro core counties, which increased 3.2% year-over-year on a four-quarter moving average basis (4QMA). The market with the largest decline in growth between the fourth quarter and first quarter was large metro core counties, which saw its four-quarter moving average growth rate fall from 9.4% to 1.3% (-8.1 pp). Two geographies, large metro outlying areas and non metro/micro counties, reported declines in the first quarter, down 0.2% and 0.4% respectively.

In terms of market share, single-family construction took place primarily in small metro core county areas, representing 29.2% of single-family construction. The smallest single-family construction market remained non metro/micro county areas, with a 4.2% market share. Single-family construction market share have been stable since the first quarter of 2024, with the largest gain being 0.4 percentage points in small metro core counties over the year.  

Multifamily

Multifamily construction expanded 33.2% in large metro outlying areas in the first quarter, the highest growth (4QMA) since the second quarter of 2022 when this geography grew 71.8%. Growth was present in three other geographies, with micro counties up 29.3%, small metro outlying counties up 18.5%, and non metro/micro counties up 3.7%.

Because of the notable increase in multifamily construction occurring in smaller markets, market shares have shifted over the past two years. Large metro core counties, where a plurality of construction takes place, saw a 4.8 percentage point drop in market share between Q1 of 2024 and 2025. The largest construction gains have been in low population density areas, with the combined market share for small metro outlying counites, micro counties and non metro/micro counties growing 2.2 percentage points from 7.8% to 10.0% between Q1 2024 and 2025.

The first quarter of 2025 HBGI data along with an interactive HBGI map can be found at http://nahb.org/hbgi.

Discover more from Eye On Housing

Subscribe to get the latest posts sent to your email.


This article was originally published by a eyeonhousing.org . Read the Original article here. .

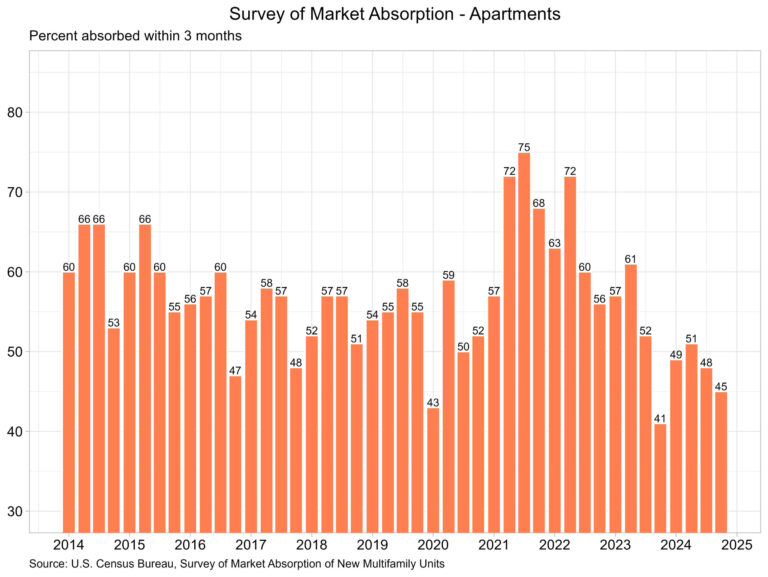
The percentage of new apartment units that were absorbed within three months after completion continued to trend lower, according to the Census Bureau’s latest release of the Survey of Market Absorption of New Multifamily Units (SOMA). The survey covers new units in multifamily residential buildings with five or more units. The number of new multifamily units completed pulled back slightly in the fourth quarter of 2024 but remained elevated near historical highs after posting a third straight quarter of above 100,000 completions.  

Apartments

The percentage of apartments absorbed within three months has fallen significantly from its peak of 75% in the third quarter of 2021, as shown in the graph above. Currently, the rate stands at 45%, coupled with 126,100 units completed in the fourth quarter of 2024. The large number of units completed each quarter continues to be a positive sign on the overall inflation front, as shelter inflation remains stubbornly high. More new apartments should help slow rent growth to lower levels in the coming months.

Along with the three-month absorption rate and completions, SOMA reports absorption rates within six-months, nine-months, and 12-months of completion. Solely focusing on the 12-month absorption rate, it remained at its lowest level since the start of the pandemic, registering a rate of just 90%. This means that 10% of the 99,850 apartments completed in the first quarter of 2024 remain unoccupied a year after completion. Regional SOMA data indicates that apartments completed over a year ago remain unoccupied primarily in the Midwest (12%) and the South (12%). The Northeast reported only 2%, while the West reported 6%.

Condominiums and Cooperative Units

The 3-month absorption rate for new condominiums and cooperative units rose one percentage point up to 67%. Total completions of new condominiums and cooperative units, according to the SOMA, fell in the fourth quarter from 4,793 to 2,880. Completions of these units peaked in the second quarter of 2018 at 7,996 and has steadily fallen since then.

Discover more from Eye On Housing

Subscribe to get the latest posts sent to your email.


This article was originally published by a eyeonhousing.org . Read the Original article here. .


According to NAHB analysis of quarterly Census data, the count of multifamily, for-rent housing starts increased during the first quarter of 2025. For the quarter, 88,000 multifamily residences started construction. Of this total, 83,000 were built-for-rent. This was almost 11% higher than the first quarter of 2024.

The market share of rental units of multifamily construction starts was 94% for the first quarter. A historical low market share of 47% for bult-for-rent multifamily construction was set during the third quarter of 2005, during the condo building boom. An average share of 80% was registered during the 1980-2002 period.

For the first quarter, there were 5,000 multifamily condo unit construction starts, flat from a year ago.

An elevated rental share of multifamily construction is holding typical apartment size below levels seen during the pre-Great Recession period. However, according to the first quarter 2025 data, the average square footage of multifamily construction starts fell back to 1,027 square feet. The median declined to 1,027 square feet.

Discover more from Eye On Housing

Subscribe to get the latest posts sent to your email.


This article was originally published by a eyeonhousing.org . Read the Original article here. .


The missing middle construction sector includes development of medium-density housing, such as townhouses, duplexes and other small multifamily properties.

The multifamily segment of the missing middle (apartments in 2- to 4-unit properties) has generally disappointed since the Great Recession. However, there has been a noticeable uptick for this type of housing construction in recent data. For the first quarter of 2025, there were 5,000 2- to 4-unit housing unit construction starts. This is flat relative to the first quarter of 2024.

However, over the last four quarters this type of construction totaled 23,000 units, up 53% over the four quarters prior to that period.

As a share of all multifamily production, 2- to 4-unit development was just above 6% of total multifamily development for the first quarter. However this is still lower than recent historic trends. From 2000 to 2010, such home construction made up a little less than 11% of total multifamily construction.

Construction of the missing middle has clearly lagged during the post-Great Recession period and will continue to do so without zoning reform focused on light-touch density. But recent data offer hope for additional housing supply for these kind of homes.

Discover more from Eye On Housing

Subscribe to get the latest posts sent to your email.


This article was originally published by a eyeonhousing.org . Read the Original article here. .


Economic uncertainty stemming from tariff issues, elevated mortgage rates and rising building material costs pushed single-family housing starts lower in April.

Overall housing starts increased 1.6% in April to a seasonally adjusted annual rate of 1.36 million units, according to a report from the U.S. Department of Housing and Urban Development and the U.S. Census Bureau.

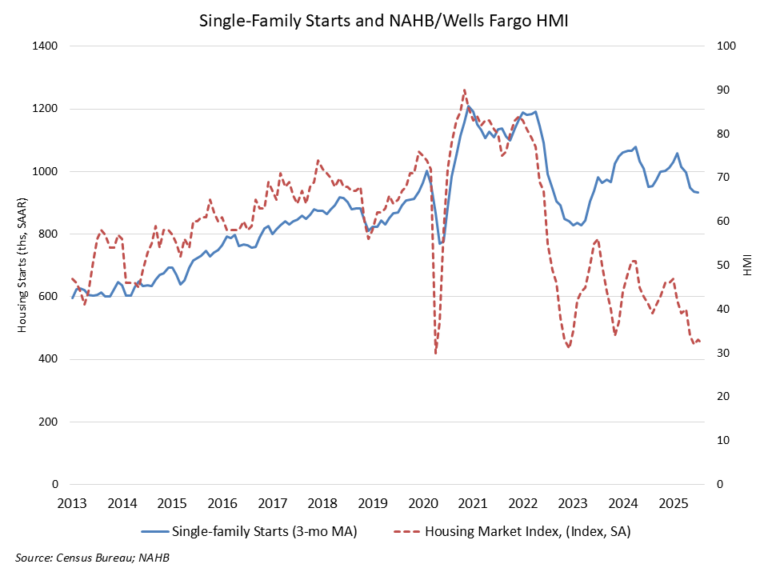
The April reading of 1.36 million starts is the number of housing units builders would begin if development kept this pace for the next 12 months. Within this overall number, single-family starts decreased 2.1% to a 927,000 seasonally adjusted annual rate and are down 12.0% compared to April 2024. On a year-to-date basis, single-family starts are down 7.1%. The three-month moving average (a useful gauge given recent volatility) is down to 991,000 units, as charted below.

The multifamily sector, which includes apartment buildings and condos, increased 10.7% to an annualized 434,000 pace. The three-month moving average for multifamily construction has trended upward to a 406,000-unit annual rate. On a year-over-year basis, multifamily construction is up 30.7%.

On a regional and year-to-date basis, combined single-family and multifamily starts were 19.8% higher in the Northeast, 4.4% higher in the Midwest, 3.4% higher in the West , and 7.4% lower in the South.

The total number of single-family homes and apartments under construction was 1.4 million units in April. This is the lowest total since June 2021. Total housing units now under construction are 14.3% lower than a year ago. Single-family units under construction fell to a count of 630,000—down 7.1% compared to a year ago. The number of multifamily units under construction has fallen to 788,000 units. This is down 15.6% compared to a year ago.

On a 3-month moving average basis, there are currently 1.3 apartments completing construction for every one that is beginning construction. While apartment construction starts are down, the number of completed units entering the market is rising due to prior elevated construction levels. Year-to-date, the pace of completions for apartments in buildings with five or more units is down 3.4% in 2025 compared to 2024. An elevated pace of completions in 2025 for multifamily construction will place some downward pressure on rent growth.

Overall permits decreased 4.7% to a 1.41-million-unit annualized rate in April. Single-family permits decreased 5.1% to a 922,000-unit rate and are down 6.2% compared to April 2024. Multifamily permits decreased 3.7% to a 490,000 pace but are up 2.9% compared to April 2024.

Looking at regional permit data on a year-to-date basis, permits were 5.1% higher in the Midwest, 3.5% lower in the West, 3.8% lower in the South, and 20.3% lower in the Northeast.

Discover more from Eye On Housing

Subscribe to get the latest posts sent to your email.


This article was originally published by a eyeonhousing.org . Read the Original article here. .

Multifamily developers are starting the year in a cautious state, according to Q1 2025 results from the Multifamily Market Survey (MMS) released today by the National Association of Home Builders (NAHB).  The MMS produces two separate indices.  The Multifamily Production Index (MPI) decreased three points to 44 year-over-year, marking the seventh consecutive quarter below the break-even point of 50.  The Multifamily Occupancy Index (MOI) had a reading of 82, slightly lower than the 83 reading it recorded in the first quarter of 2024.

The current MPI reading is consistent with NAHB’s forecast for a modest decline in the rate of multifamily production for the remainder of 2025, followed by a modest recovery in 2026. Multifamily builders and developers continue to experience major headwinds from rising construction costs, regulatory barriers, and availability of financing.

Like remodelers and single-family builders, multifamily developers are also being affected by economic policy uncertainty.  In this quarter’s MMS, more than half of the developers reported that their suppliers have increased prices due to announced, enacted or anticipated tariffs.

Multifamily Production Index (MPI)

The MMS asks multifamily developers to rate the current conditions as “good”, “fair”, or “poor” for multifamily starts in markets where they are active.  The index and all its components are scaled so that a number above 50 indicates that more respondents report conditions as good rather than poor. The MPI is a weighted average of four key market segments: three in the built-for-rent market (garden/low-rise, mid/high-rise, and subsidized) and the built-for-sale (or condominium) market.

Three of the four components experienced year-over-year decreases: the component measuring mid/high-rise units fell eight points to 28 and the components measuring garden/low-rise and built-for-sale units both dipped by one point to 54 and 38, respectively.   The component measuring subsidized units was unchanged at 50 year-over-year.

Multifamily Occupancy Index (MOI)

The survey also asks multifamily property owners to rate the current conditions for occupancy of existing rental apartments, in markets where they are active, as “good”, “fair”, or “poor”.  Like the MPI, the MOI and all its components are scaled so that a number above 50 indicates more respondents report that occupancy is good than report it as poor.  The MOI is a weighted average of three built-for-rent market segments (garden/low-rise, mid/high-rise and subsidized). 

Two of the three MOI components experienced year-over-year declines in the first quarter of 2025.  The component measuring subsidized units dropped by five points to 89 and the garden/low-rise component decreased two points to 82.  Meanwhile, the component measuring mid/high-rise units rose two points to 76.  Despite the declines, all three MOI components remain well above the break-even point of 50.

The MMS was re-designed in 2023 to produce results that are easier to interpret and consistent with the proven format of other NAHB industry sentiment surveys.  Until there is enough data to seasonally adjust the series, changes in the MMS indices should only be evaluated on a year-over-year basis.

Please visit NAHB’s MMS web page for the full report.

Discover more from Eye On Housing

Subscribe to get the latest posts sent to your email.


This article was originally published by a eyeonhousing.org . Read the Original article here. .

Constrained housing affordability conditions due to elevated interest rates, rising construction costs and labor shortages led to a reduction in housing production in March.

Overall housing starts decreased 11.4% in March to a seasonally adjusted annual rate of 1.32 million units, according to a report from the U.S. Department of Housing and Urban Development and the U.S. Census Bureau.

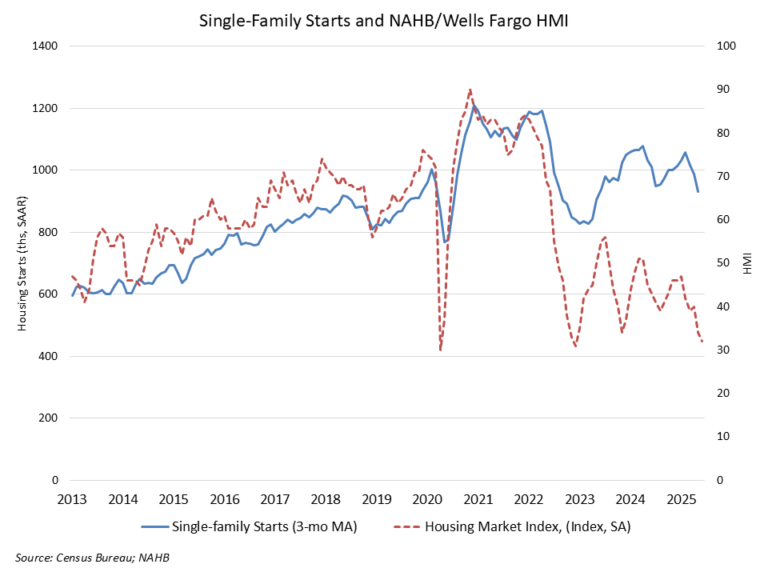
The March reading of 1.32 million starts is the number of housing units builders would begin if development kept this pace for the next 12 months. Within this overall number, single-family starts decreased 14.2% to a 940,000 seasonally adjusted annual rate over the month and are down 9.7% compared to March 2024. On a year-to-date basis, single-family starts are down 5.6%. The three-month moving average (a useful gauge given recent volatility) is down to 1.01 million units, as charted below.

The multifamily sector, which includes apartment buildings and condos, decreased 3.5% to an annualized 384,000 pace. The three-month moving average for multifamily construction has trended upward to a 381,000-unit annual rate. On a year-over-year basis, multifamily construction is up 48.8%.

On a regional and year-to-date basis, combined single-family and multifamily starts were 10.6% higher in the West, 8.6% higher in the Northeast, 3.3% higher in the Midwest, and 8.5% lower in the South.

The total number of single-family homes and apartments under construction was 1.4 million in March. This is the lowest total since July 2021. Total housing units now under construction are 15.2% lower than a year ago. Single-family units under construction fell to a count of 632,000—down 8.7% compared to a year ago. The number of multifamily units under construction has fallen to 759,000 units. This is down 20.0% compared to a year ago.

On a 3-month moving average basis, there are currently 1.5 apartments completing construction for every one that is beginning construction. While apartment construction starts are down, the number of completed units entering the market is rising due to prior elevated construction levels. Year-to-date, the pace of completions for apartments in buildings with five or more units is down 3.5% in 2025 compared to 2024. An elevated pace of completions in 2025 for multifamily construction will place some downward pressure on rent growth.

Overall permits increased 1.6% to a 1.48-million-unit annualized rate in March. Single-family permits decreased 2.0% to a 978,000-unit rate. Multifamily permits increased 9.3% to a 504,000 pace.

Looking at regional permit data on a year-to-date basis, permits were 4.7% higher in the Midwest, 0.4% higher in the South, 8.8% lower in the West and 24.7% lower in the Northeast.

Discover more from Eye On Housing

Subscribe to get the latest posts sent to your email.


This article was originally published by a eyeonhousing.org . Read the Original article here. .
Pin It