Tag

Moves

Browsing


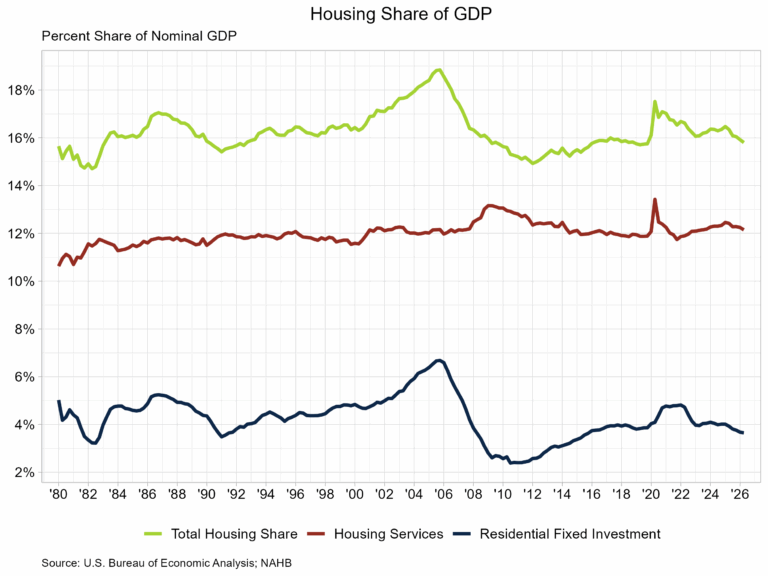
Housing’s share of the economy was 15.8% in the second quarter of 2026, according to the latest estimates of GDP produced by the Bureau of Economic Analysis. This share is down from 15.9% in the first quarter and is at the lowest level since 2019. Residential construction, measured by residential fixed investment, rose for the first time in over a year, while households’ expenditure on housing services fell due to lower household consumption of utilities.

The more cyclical home building and remodeling component–residential fixed investment (RFI)–was 3.7% of GDP, even with the previous quarter. The second component, housing services, was 12.1% of GDP, down from 12.2% in the previous quarter. The graph below plots the share for housing services and RFI, along with housing’s total share of nominal GDP.

Housing service expenditures are much less volatile when compared to RFI due to the cyclical nature of RFI. Historically, RFI has averaged roughly 5% of GDP, while housing services have averaged between 12% and 13%, for a combined 17% to 18% of GDP. These shares tend to vary over the business cycle. However, the housing share of GDP lagged during the post-Great Recession period due to underbuilding, particularly in the single-family sector.

Residential Fixed Investment

In the second quarter, RFI contributed 5 basis points to the headline GDP growth rate. This was the first positive contribution to GDP from RFI since the fourth quarter of 2024. RFI was 3.7% of the economy, recording a $1.2 trillion seasonally adjusted annual pace.

RFI can be split into two segments, structures and equipment. Residential structure investment not only consists of new single-family and multifamily units but also includes manufactured homes, improvements, and dormitories. Residential equipment, which accounts for under 2% of total RFI, consists of furniture or household appliances that are purchased by landlords for rental to tenants. Real private investment in structures rose 1.3%, while investment in residential equipment rose 12.1%.

Breaking down the components of residential structures, single-family RFI rose 4.4%, while multifamily RFI fell 1.8%. Permanent site structure RFI, which is made up of single-family and multifamily RFI, rose 1.3%. The “other structures” RFI category was down 0.1% in the second quarter. This component consists primarily of manufactured homes, improvements, and dormitories. On a seasonally adjusted annual basis in the second quarter, private investment in permanent site structures was at $523.8 billion, while other structures totaled $639.3 billion.

Housing Services

The second impact of housing on GDP is the measure of housing services. Similar to RFI, housing services consumption can be broken into two components. The first component, housing, includes gross rents paid by renters, owners’ imputed rent (an estimate of how much it would cost to rent owner-occupied units), rental value of farm dwellings, and group housing. The inclusion of owners’ imputed rent is necessary from a national income accounting approach, because without this measure, increases in homeownership would result in declines in GDP. The second component, household utilities, is composed of consumption expenditures on water supply, sanitation, electricity, and gas.

For the second quarter, housing services represented 12.1% of the economy or $3.9 trillion on a seasonally adjusted annual basis. Real housing services expenditure declined 0.1% at an annual rate in the second quarter. Real personal consumption expenditure for housing grew 1.1%, while real household utilities expenditures declined 8.2%.

Personal consumption expenditure (PCE) on housing services is the largest component of PCE, making up 17.9% in the second quarter. The second largest component of PCE is health care services, at 16.8%. Expenditure on services was $15.2 trillion on a seasonally adjusted annual basis in the second quarter, more than double the expenditure on goods ($6.9 trillion).


This article was originally published by a eyeonhousing.org . Read the Original article here. .
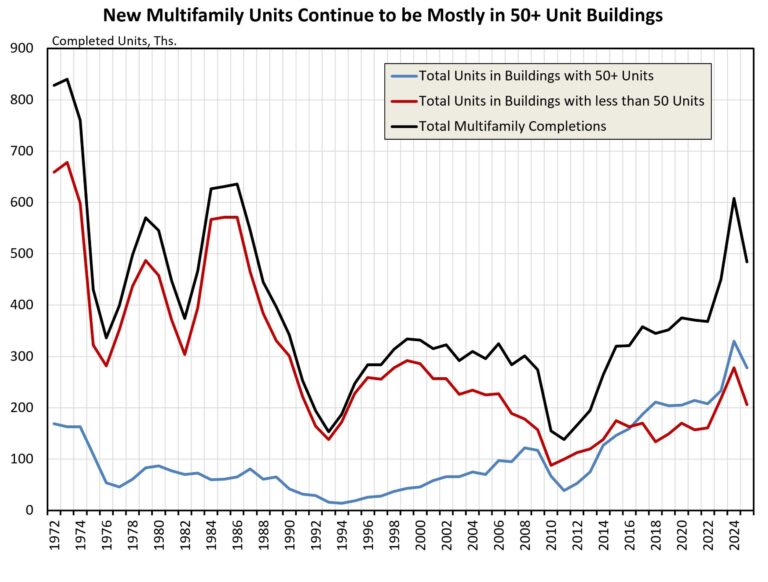

Following the highest number of multifamily completions in nearly 40 years in 2024, completions declined in 2025 to 484,000, according to NAHB analysis of the Census Bureau’s Survey of Construction. For the ninth consecutive year, a majority of new multifamily units were in buildings with 50 or more units (labeled as high-density buildings) at 57%, the highest share since 2021.

Dating back to the earliest estimates in the series (1972), multifamily units have historically been built in buildings with less than 50 units (low-medium density buildings). This trend reversed in 2017 and has remained unchanged through 2025, with a majority of new multifamily units being located in high-density buildings. Of the total 484,000 multifamily units completed in 2025, 278,000 (57%) were in high-density buildings while the remaining 206,000 (43%) were in low-medium density buildings.

Regional Distribution

The South continued to be the leading region in terms of units completed, down from 292,000 in 2024 to 217,000 completions in 2025. The South accounted for 45% of the total multifamily completions; the West held 26% (127,000), the Northeast 16% (79,000), and the Midwest 13% (63,000). The Midwest was the only region where low-medium density completions outpaced those in high-density buildings. The Midwest had 38,000 completions in low-medium density compared to 25,000 units in high-density buildings.

Conversely, the South, West and Northeast had more high-density completions than completions in low-medium density buildings. For the South, there were 122,000 units in high-density buildings and 95,000 low-medium density units. The West had 74,000 units in high-density buildings and 53,000 low-medium density units. The Northeast featured the largest divergence with 58,000 high-density units and 21,000 low-medium density.

As a share of regional completions, units in high-density buildings reached a new high in the Northeast at 73%. In the South, this share was up from 50% in 2024 to 56% in 2025. The West saw a similar rise, from 50% to 58% in 2025. The Midwest was the only region where this share declined, from 67% in 2024 to just 40% of completions in 2025.

Built-for-Rent

Among multifamily units completed in 2025, 95% were built-for-rent at 461,000. Over half of these units (59%) were in a building with 50 units or more, the highest share since 2021 (59%). This was the ninth straight year where most of multifamily rental-units were in high-density buildings. The second largest share was split between 30-49 unit buildings and 20-29 unit buildings, as both represented 15% of completed units in 2025. No other building category accounted for over 10% of completions in 2025.

Built-for-Sale

The number of multifamily units built-for-sale fell from 29,000 in 2024 to 23,000 in 2025. High-density buildings continued to be the primary type of building where these units were built, with 32% of built-for-sale units being completed in buildings with 50+ units. This share was down from 40% in 2024. The largest gain in market share for multifamily built-for-sale units was for buildings with 10-19 units, rising from 13% in 2024 to 24% in 2025 and making it the second largest segment of multifamily units built-for-sale.


This article was originally published by a eyeonhousing.org . Read the Original article here. .
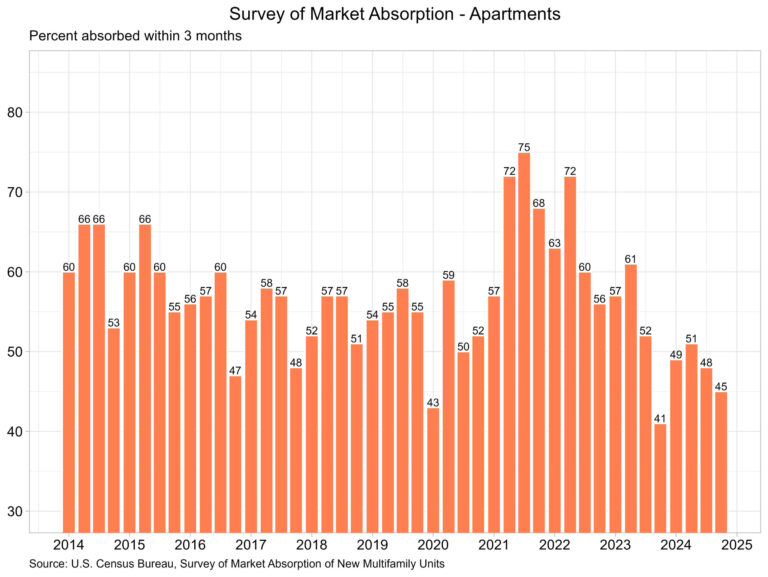

The percentage of new apartment units that were absorbed within three months after completion continued to trend lower, according to the Census Bureau’s latest release of the Survey of Market Absorption of New Multifamily Units (SOMA). The survey covers new units in multifamily residential buildings with five or more units. The number of new multifamily units completed pulled back slightly in the fourth quarter of 2024 but remained elevated near historical highs after posting a third straight quarter of above 100,000 completions.  

Apartments

The percentage of apartments absorbed within three months has fallen significantly from its peak of 75% in the third quarter of 2021, as shown in the graph above. Currently, the rate stands at 45%, coupled with 126,100 units completed in the fourth quarter of 2024. The large number of units completed each quarter continues to be a positive sign on the overall inflation front, as shelter inflation remains stubbornly high. More new apartments should help slow rent growth to lower levels in the coming months.

Along with the three-month absorption rate and completions, SOMA reports absorption rates within six-months, nine-months, and 12-months of completion. Solely focusing on the 12-month absorption rate, it remained at its lowest level since the start of the pandemic, registering a rate of just 90%. This means that 10% of the 99,850 apartments completed in the first quarter of 2024 remain unoccupied a year after completion. Regional SOMA data indicates that apartments completed over a year ago remain unoccupied primarily in the Midwest (12%) and the South (12%). The Northeast reported only 2%, while the West reported 6%.

Condominiums and Cooperative Units

The 3-month absorption rate for new condominiums and cooperative units rose one percentage point up to 67%. Total completions of new condominiums and cooperative units, according to the SOMA, fell in the fourth quarter from 4,793 to 2,880. Completions of these units peaked in the second quarter of 2018 at 7,996 and has steadily fallen since then.

Discover more from Eye On Housing

Subscribe to get the latest posts sent to your email.


This article was originally published by a eyeonhousing.org . Read the Original article here. .

Builder sentiment improved for the third straight month, and builders expect market conditions will continue to improve with Republicans winning control of the White House and Congress.

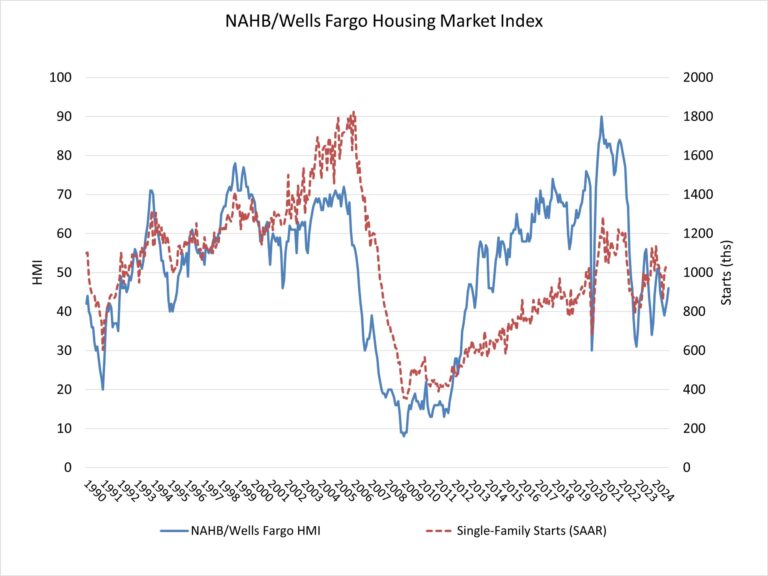
Builder confidence in the market for newly built single-family homes was 46 in November, up three points from October, according to the National Association of Home Builders (NAHB)/Wells Fargo Housing Market Index. Future sales expectations posted a notable increase in the November reading of builder sentiment.

While builder confidence is improving, the industry still faces many headwinds such as an ongoing shortage of labor and buildable lots along with elevated building material prices. Moreover, while the stock market cheered the election result, the bond market has concerns, as indicated by a rise for long-term interest rates. There is also policy uncertainty in front of the business sector and housing market as the executive branch changes hands.

The latest HMI survey also revealed that 31% of builders cut home prices in November. This share has remained essentially unchanged since July, hovering between 31% and 33%. Meanwhile, the average price reduction was 5%, slightly below the 6% rate posted in October. The use of sales incentives was 60% in November, slightly down from 62% in October.

Derived from a monthly survey that NAHB has been conducting for more than 35 years, the NAHB/Wells Fargo HMI gauges builder perceptions of current single-family home sales and sales expectations for the next six months as “good,” “fair” or “poor.” The survey also asks builders to rate traffic of prospective buyers as “high to very high,” “average” or “low to very low.” Scores for each component are then used to calculate a seasonally adjusted index where any number over 50 indicates that more builders view conditions as good than poor.

All three HMI sub-indices were up in November. The index charting current sales conditions rose two points to 49, the component measuring sales expectations in the next six months increased seven points to 64 and the gauge charting traffic of prospective buyers posted a three-point gain to 32.

Looking at the three-month moving averages for regional HMI scores, the Northeast increased four points to 55, the Midwest moved three points higher to 44, the South edged up one point to 42 and the West held steady at 41. HMI tables can be found at nahb.org/hmi.

Discover more from Eye On Housing

Subscribe to get the latest posts sent to your email.


This article was originally published by a eyeonhousing.org . Read the Original article here. .
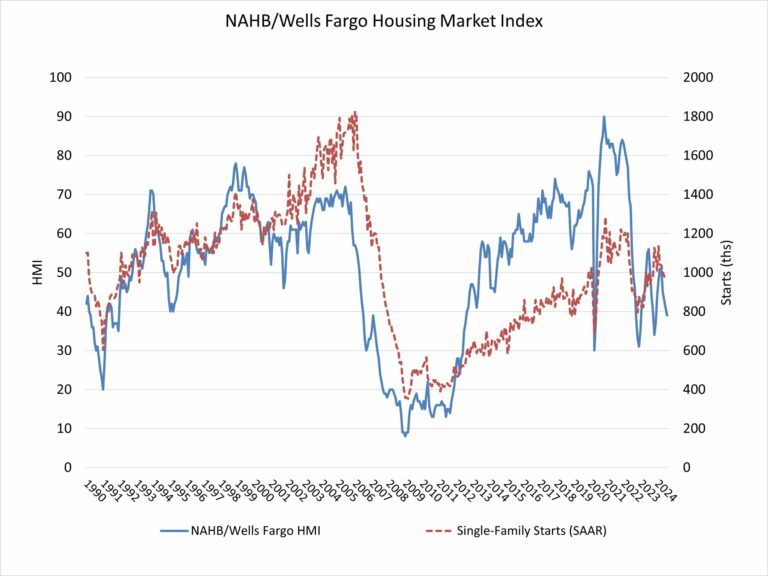

A lack of affordability and buyer hesitation stemming from elevated interest rates and high home prices contributed to a decline in builder sentiment in August.

Builder confidence in the market for newly built single-family homes was 39 in August, down two points from a downwardly revised reading of 41 in July, according to the National Association of Home Builders (NAHB)/Wells Fargo Housing Market Index (HMI) released today. This is the lowest reading since December 2023.

Almost three-quarters of the responses to the August HMI were collected during the first week of the month when interest rates averaged 6.73%, according to Freddie Mac. Mortgage rates declined notably the following week to 6.47%, the lowest reading since May 2023.

Challenging housing affordability conditions remain the top concern for prospective home buyers in the current reading of the HMI, as both present sales and traffic readings showed weakness. However, with current inflation data pointing to interest rate cuts from the Federal Reserve and mortgage rates down markedly in the second week of August, buyer interest and builder sentiment should improve in the months ahead.

The August HMI survey also revealed that 33% of builders cut home prices to bolster sales in August, above the July rate of 31% and the highest share in all of 2024. However, the average price reduction in August held steady at 6% for the 14th straight month. Meanwhile, the use of sales incentives increased to 64% in August from 61% in July, and this was the highest level since April 2019.

Derived from a monthly survey that NAHB has been conducting for more than 35 years, the NAHB/Wells Fargo HMI gauges builder perceptions of current single-family home sales and sales expectations for the next six months as “good,” “fair” or “poor.” The survey also asks builders to rate traffic of prospective buyers as “high to very high,” “average” or “low to very low.” Scores for each component are then used to calculate a seasonally adjusted index where any number over 50 indicates that more builders view conditions as good than poor.

The HMI index charting current sales conditions in August fell two points to 44 and the gauge charting traffic of prospective buyers also declined by two points to 25. The component measuring sales expectations in the next six months increased one point to 49.

Looking at the three-month moving averages for regional HMI scores, the Northeast fell four points to 52, the Midwest dropped four points to 39, the South decreased two points to 42 and the West held steady at 37. The HMI tables can be found at nahb.org/hmi.

Discover more from Eye On Housing

Subscribe to get the latest posts sent to your email.


This article was originally published by a eyeonhousing.org . Read the Original article here. .

Pin It