Tag

metro

Browsing


U.S. house prices continued to rise in the second quarter of 2026, with most states and metropolitan areas recording annual gains. Elevated borrowing costs and affordability constraints remained important headwinds, while limited housing supply continued to support prices in many markets, particularly across parts of the Midwest and Northeast.

According to the Federal Housing Finance Agency’s (FHFA) quarterly purchase-only House Price Index (HPI), national house prices increased 2.1% in the second quarter of 2026 from a year earlier. This was slightly faster than the 1.9% annual gain reported for the first quarter. On a quarter-over-quarter basis, house prices rose 0.3%, moderating from the 0.6% increase in the previous quarter.

The FHFA’s purchase-only HPI tracks average price changes using more than six million repeat-sales transactions involving the same single-family properties. In addition to the national picture, the index provides valuable insight into house price trends across states and metropolitan areas.

At the state level, house price performance remained positive across most of the country. Among the 50 states and the District of Columbia, 47 states recorded year-over-year gains, while four posted declines. Thirty states matched or exceeded the national appreciation rate of 2.1%. Puerto Rico also registered an annual increase.

Alaska led the nation, with house prices rising 8.3% from a year earlier. Vermont followed with a 7.3% gain, while prices increased 5.8% in Hawaii. Illinois and West Virginia each posted gains of approximately 5.6%.

Other strong-performing states included Wisconsin and North Dakota, where prices rose about 4.8%, followed by Connecticut, Rhode Island, and New Jersey. Although the strongest gains were not concentrated in a single region, many Midwest and Northeast states continued to outperform the national average.

At the other end of the spectrum, New Mexico recorded the largest annual decline, with house prices falling 1.2%. Washington declined 0.9%, Colorado fell 0.5%, and California edged down 0.2%.

Several other states, including Oregon, North Carolina, Texas, Mississippi, and Arizona, recorded annual appreciation of less than 1%. These results point to continued softness in several Western and Sun Belt markets, including some areas that experienced rapid price growth during the pandemic-era housing boom.

Quarterly performance was similarly uneven. Hawaii recorded the largest quarter-over-quarter increase at 4.7%, followed by Rhode Island at 2.4%. Conversely, Puerto Rico declined 2.6% from the first quarter, while New Mexico fell 1.7%.

House price performance varied even more widely across the nation’s 100 largest metropolitan areas. Annual house price appreciation ranged from a decline of 3.7% to an increase of 7.7% in the second quarter of 2026.

Overall, 75 of the 100 metro areas posted year-over-year gains, while 22 recorded declines and three remained unchanged. Forty-nine metros matched or exceeded the national appreciation rate of 2.1%.

Elgin, Illinois, recorded the strongest annual appreciation among the 100 largest metros, with prices rising 7.7%. Allentown-Bethlehem-Easton, Pennsylvania–New Jersey, followed with a 7.0% increase.

Chicago, New York, Newark, and Greensboro rounded out the ten strongest annual performers. The rankings indicate continued strength in several Midwest and Northeast markets, where relatively limited housing supply may be helping support prices.

The weakest results were concentrated in portions of the West and Southwest. Everett, Washington, posted the largest annual decline at 3.7%, followed by San Antonio-New Braunfels, Texas, at 3.0%.

Bakersfield-Delano, California, declined 2.6%, while Seattle and San Francisco each fell approximately 2.4%. Tucson, Albuquerque, San Jose-Sunnyvale-Santa Clara, Washington, D.C.–Maryland, and Denver-Aurora-Centennial were also among the ten weakest-performing large metro areas.

Short-term changes sometimes diverged considerably from annual trends. Allentown posted a 4.3% quarterly increase, while Austin rose 3.7% from the first quarter despite a slight year-over-year decline.

By contrast, San Francisco posted a 9.1% quarter-over-quarter decline, the largest quarterly decline among the 100 metros, followed by Tucson at 5.3% and San Jose at 3.6%.

These large quarterly movements highlight the greater volatility in metro-level house price data. While year-over-year changes provide a better indication of underlying price trends, quarterly measures can help identify more recent shifts in local housing market conditions.

Note:

Unless otherwise noted, this blog post uses the quarterly purchase-only House Price Index (HPI), which measures the sales prices of homes that are bought and sold, rather than the broader all-transactions HPI. The purchase-only HPI provides a more precise view of current market conditions. Year-over-year change compares 2026 Q2 with 2025 Q2, while quarter-over-quarter change compares 2026 Q2 with 2026 Q1.


This article was originally published by a eyeonhousing.org . Read the Original article here. .


U.S. house prices continued to rise in the first quarter of 2026, but appreciation slowed markedly from the rapid pace seen during the pandemic-era housing boom. Higher mortgage rates, persistent affordability challenges, and softer demand weighed on price growth nationally. At the same time, local market conditions varied considerably. Some states and metropolitan areas continued to post solid gains, while others experienced flat or declining house prices.

According to the quarterly purchase-only House Price Index1 (HPI) released by the Federal Housing Finance Agency (FHFA), national house prices rose 1.7% in the first quarter of 2026 from a year earlier. This growth rate represented the slowest annual appreciation since the second quarter of 2012, signaling the continued cooling of house price growth after more than a decade of strong gains. On a quarterly basis, house prices increased a modest 0.5% from the fourth quarter of 2025.

The FHFA’s purchase-only HPI tracks average price changes using more than six million repeat-sales transactions involving the same single-family properties. In addition to the national picture, the index provides valuable insight into house price trends across states and metropolitan areas.

At the state level, house price performance remained positive across most of the country in the first quarter of 2026, although appreciation rates varied widely. Annual appreciation ranged from a 2.4% decline to a 16.3% gain.

Puerto Rico recorded the strongest annual appreciation, with house prices surging 16.3% from a year earlier. Among the 50 states and the District of Columbia, Illinois posted the largest gain (7.3%), followed by Alaska (5.5%), Vermont (4.9%), and Connecticut (4.7%). More broadly, many states across the Midwest and Northeast continued to outperform the national average.

At the other end of the spectrum, Colorado recorded the largest annual decline, with house prices falling 2.4% from a year earlier. Texas and the District of Columbia also posted modest declines, while several Western and Sun Belt states saw only limited appreciation. Many of the markets that experienced some of the strongest price growth during 2021–2022 continue to face affordability pressures and softer buyer demand.

Overall, 42 states and Puerto Rico reported annual house price gains. In addition, 31 states and Puerto Rico matched or exceeded the national appreciation rate of 1.7%, underscoring the resilience of many regional housing markets despite challenging financing conditions.

House price performance varied even more widely across metropolitan areas than at the state level. Among the nation’s 100 largest metro areas tracked by FHFA, annual house price appreciation ranged from a decline of 6.9% to an increase of 10.8% in the first quarter of 2026.

The strongest-performing metro areas were concentrated primarily in the Midwest and Northeast, where limited housing supply continued to support price growth. Several metro areas in Pennsylvania, New York, Ohio, and Illinois posted especially strong annual gains, reflecting continued demand amid limited supply.

In contrast, some of the weakest-performing markets were located in Florida, Texas, and parts of the Mountain West. Austin-Round Rock-San Marcos, Texas, recorded the steepest annual price decline among the top 100 metro areas, continuing a correction after several years of exceptionally rapid house price growth. Cape Coral–Fort Myers, Florida, also remained among the nation’s weakest housing markets, extending a trend of price declines amid cooling demand and a gradual rebalancing of market conditions.

Overall, one-third of the 100 largest metro areas posted annual price declines in the first quarter of 2026, while the remaining two-thirds recorded either positive appreciation or essentially flat price growth.

Note:

Unless otherwise noted, this blog post uses the quarterly purchase-only House Price Index (HPI), which measures the sales prices of homes that are bought and sold, rather than the broader all-transactions HPI. The purchase-only HPI provides a more precise view of current market conditions.


This article was originally published by a eyeonhousing.org . Read the Original article here. .
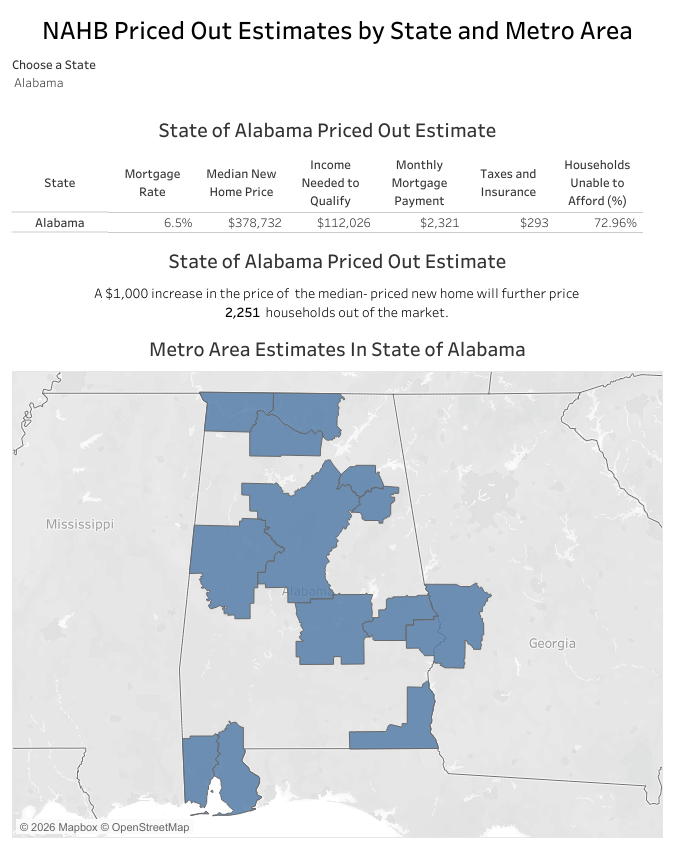

The NAHB 2026 priced-out estimates show that the housing affordability challenge is widespread across the country. In 39 states and the District of Columbia, over 65% of households are priced out of the median-priced new home market. This indicates a significant disconnect between higher new home prices, elevated mortgage rates, and household incomes.

New Hampshire stands out as the state with the highest share of households (83.4%) unable to afford the state’s median new home price of $677,982. High-cost states such as Hawaii and Maine follow closely, with 83% and 82.7% of households, respectively, struggling to afford new homes.

Even in states with relatively lower median new home prices, affordability remains a major concern. For example, in Mississippi, where the median home price is $266,837, 61.1% of households still find these new homes out of reach. Meanwhile, Delaware, the state with better affordability in the analysis, has a median new home price of $373,666, and even there, around 56% of households still struggle to afford a new home. Even modest price increases, such as an additional $1,000, could push thousands more households from affording these median priced new homes. For instance, in Texas, such an increase could price out over 14,365 households.

Affordability patterns also vary significantly across metropolitan areas. In high-cost areas like the San Jose-Sunnyvale-Santa Clara, CA metro area, where new homes largely target high-income Silicon Valley residents, only 14% of all households meet the minimum income threshold of $407,659 required to qualify for a loan on a median-priced new home. In contrast, in more affordable metro areas like Rome, GA, where the median new home price is $107,567, more than three-quarters of households can afford a median-priced new home. While higher home prices generally result in higher monthly mortgage payments and higher income thresholds, the relationship between home prices and affordability is not always linear. Factors like property taxes and insurance payments can also significantly impact monthly housing costs, adding complexity to affordability calculations.

The affordability of new homes, together with the population size of a metro area, significantly influences the priced-out impact of a $1,000 increase in new home prices. In metro areas where new homes are already unaffordable to most households, the effect of such an increase tends to be small. For instance, in the San Jose-Sunnyvale-Santa Clara, CA metro area, an additional $1,000 increase to the home price affects only 273 households, as only 14% of all households could afford such expensive new homes in the first place. Here, the additional price increase only affects a narrow share of high-income households at the upper end of the income distribution, where affordability is already stretched.

In contrast, metro areas, where new homes are more broadly affordable, experience a larger priced-out effect. A $1,000 increase in the median new home price affects a larger share of households in the “thicker part” of the income distribution. For example, in the New York-Newark-Jersey City, NY-NJ Metro Area metro area, a $1,000 increase in new home price would disqualify 4,028 households from affording a median-priced new home. This is the largest priced-out effect among all metro areas, driven by a substantial population base.

Detailed priced-out estimates for every state and more than 300 metro areas are available in the interactive dashboard below.


This article was originally published by a eyeonhousing.org . Read the Original article here. .
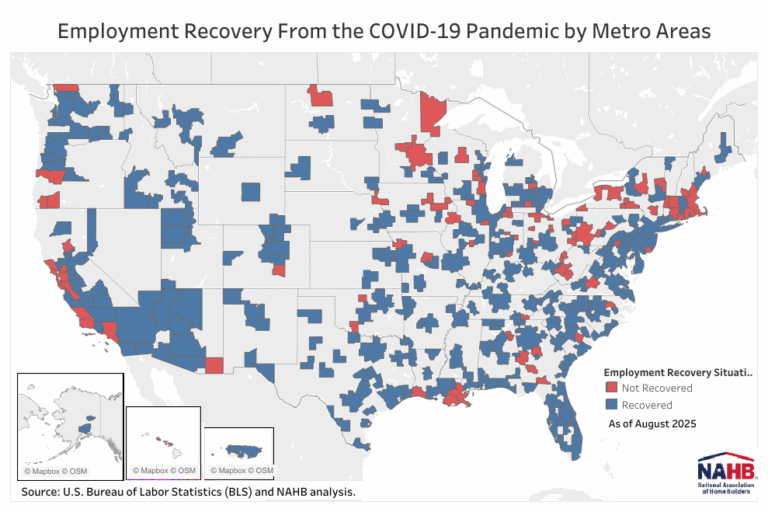

In April 2020, total payroll employment in the United States fell by an unprecedented 20.5 million, following a loss of 1.4 million in March, as the COVID-19 pandemic brought the economy to a sudden halt. The unemployment rate surged by 10.4 percentage points to 14.8% in April. It was the highest rate effectively since the Great Depression. Tracking the labor market impact is critical for understanding the follow-on effect on home building activity during the last five years.

As people stayed at home and businesses shut down under government directives, millions of Americans lost their jobs. Initial unemployment insurance claims soared to 2.9 million during the week of March 21, 2020. For the following 19 consecutive weeks, more than one million Americans filed for unemployment each week, totaling roughly 50.9 million claims over just five months.

While the national labor market suffered an unprecedented collapse in both speed and depth, the effects varied significantly across U.S. metro areas. Local economies experience dramatically different outcomes depending on their industrial composition, the feasibility of remote work, and the strictness of local public health restrictions. A map of metro areas across the United States reveals striking variations in employment losses from February 2020 to the pandemic’s employment trough. Nonfarm employment payrolls declined by anywhere from 5% to 35% across 393 metro areas.

Kahului-Wailuku, Hawaii, experienced the steepest job losses, with employment plummeting by 35%. This metro area’s deep dependence on tourism and hospitality, particularly in accommodation and food services, left it vulnerable to travel restrictions and widespread shutdown. Similarly, Atlantic City-Hammonton, New Jersey, as a prime tourism destination, was devastated by pandemic-related closures. By May 2020, its total employment dropped 34% from the February 2020 level.

Some metro areas experienced major setbacks tied to their dominant industries. In Elkhart-Goshen, Indiana, as the heart of the U.S. RV manufacturing industry, employment plunged 34% as production ground to a halt.

At the other end of the spectrum, Logan, UT-ID, recorded the mildest downturn, with a relatively modest 5% employment drop, reflecting a more resilient local economy.

In sheer numbers, New York-Newark-Jersey City, New York-New Jersey saw the largest employment losses in the nation, shedding nearly 2 million jobs, or about 20% of its pre-pandemic workforce. Los Angeles–Long Beach–Anaheim, California, followed closely, losing 1.1 million jobs, about 17% of its February 2020 level.

Despite the historic scale of these losses, the U.S. labor market rebounded faster than many anticipated. Within just 26 months, overall employment had fully recovered, surpassing its February 2020 level to reach 152.4 million by June 2022. Yet, as with the initial losses, the recovery varied widely across metro areas. By August 2025, 93 of the 393 metro areas had still not regained their pre-pandemic employment levels.

Lake Charles, Louisiana, remains the slowest to recover, with employment at only 87% of its February 2020 level. The region’s setbacks have been compounded by multiple disasters—COVID-19, followed by Hurricanes Laura and Delta in 2020—that disrupted both infrastructure and labor markets. Kankakee, Illinois (92% recovered), and Weirton–Steubenville, West Virginia–Ohio (93%), also lagged, highlighting how recovery can be delayed by structural and regional challenges.

In contrast, many other metro areas have not only recovered but expanded beyond their pre-pandemic employment levels. As of August 2025, 300 metro areas have fully rebounded, with some even booming. Wildwood–The Villages, Florida, leads the nation with employment reaching 127% of its February 2020 level, followed by St. George, Utah, at 125%.

Notably, the areas that suffered the sharpest employment declines in 2020 did not necessarily experience the slowest recoveries. Las Vegas–Henderson–North Las Vegas, Nevada, for instance, lost 277,900 jobs, about 26% of its workforce, but has rebounded strongly, reaching 109% of its pre-pandemic employment. By contrast, Enid, Oklahoma, which lost just 1,600 jobs, remains slightly below its February 2020 level, still 2% short of full recovery.

The story of employment loss and recovery across U.S. metro areas underscores the uneven geography of the COVID-19 economy. The resilience of local economies has since reshaped the post-pandemic landscape, revealing not only where recovery has taken root but also where it remains incomplete. And of course, the health of local labor markets has important impacts on the status of local home building and remodeling conditions.


This article was originally published by a eyeonhousing.org . Read the Original article here. .

House price growth slowed in the first quarter of 2025, partly due to a decline in demand and an increase in supply. Persistent high mortgage rates and increased inventory combined to ease upward pressure on house prices. These factors signaled a cooling market, following rapid gains seen in previous years.

Nationally, according to the quarterly all-transactions House Price Index (HPI) released by the Federal Housing Finance Agency (FHFA), U.S. house prices rose 4.7% in the first quarter of 2025, compared to the first quarter of 2024. This year-over-year (YoY) rate was lower than the previous quarter’s rate of 5.5%. The FHFA’s all-transactions HPI tracks average price changes based on repeat sales and refinancings of the same single-family properties. It offers insights not only at the national level but also across states and metropolitan areas.

Between the first quarter of 2024 and the first quarter of 2025, all 50 states and the District of Columbia experienced positive house price appreciation, ranging from 1.0% to 8.4%. Connecticut and Rhode Island topped the house price appreciation list with an 8.4% gain each, followed by New Jersey with a 7.8% gain. On the opposite end, Louisiana recorded the lowest house price appreciation at 1.0%. Out of all 50 states and the District of Columbia, 26 states exceeded the national YoY growth rate of 4.7%. However, on a quarterly basis, home price appreciation slowed in 39 states compared to the fourth quarter of 2024, highlighting a broad-based deceleration in the housing market.

House price growth widely varied across U.S. metro areas year-over-year, ranging from -7.0% to +23.0%. Rome, GA recorded the largest decline in house prices, whereas Johnstown, PA posted the highest increase over the previous four quarters. In the first quarter of 2025, 28 metro areas, in reddish color on the map above, experienced negative house price appreciation. Meanwhile, 356 metro areas experienced price increases.

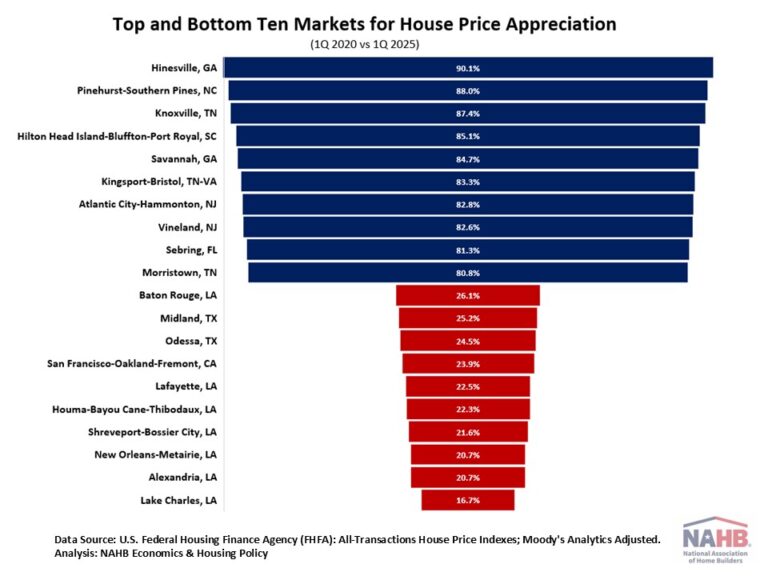
Since the onset of the COVID-19 pandemic, house prices have surged nationally. Between the first quarter of 2020 and the first quarter of 2025, house prices rose by 54.9% nationwide. More than half of metro areas outpaced this national price growth rate of 54.9%.

The table below highlights the top ten and bottom ten markets for house price appreciation during this five-year period. Among all the metro areas, house price appreciation ranged from 16.7% to 90.1%. Hinesville, GA led the nation with the highest house price appreciation. Lake Charles, LA recorded the lowest appreciation, marking its fourth consecutive quarter at the bottom.

Discover more from Eye On Housing

Subscribe to get the latest posts sent to your email.


This article was originally published by a eyeonhousing.org . Read the Original article here. .

Following two straight quarters of deceleration, house price appreciation accelerated slightly in the fourth quarter of 2024 due to the persistent high mortgage rates and low inventory. Although inventories of existing homes have improved from a year ago, the current 3.5-month supply remains below the 4.5- to 6-month supply that considered a balanced housing market.

Nationally, according to the quarterly all-transactions House Price Index (HPI) released by the Federal Housing Finance Agency (FHFA), U.S. house prices rose 5.4% in the fourth quarter of 2024, compared to the fourth quarter of 2023. The year-over-year rate has decreased from a high of 20.6% in the second quarter of 2022, but is higher than the previous quarter’s rate of 5.2%.

The quarterly FHFA HPI not only reports house prices at the national level but also provides insights about house price fluctuations at the state and metro area levels. The FHFA HPI used in this article is the all-transactions index, measuring average price changes in repeat sales or refinancings on the same single-family properties.  

Between the fourth quarter of 2023 and the fourth quarter of 2024, 49 states and the District of Columbia had positive house price appreciation. Vermont topped the house price appreciation list with an 8.9% gain, followed by New Jersey and Connecticut both with 8.3% gains. At the other end, Louisiana had the lowest house price appreciation (+2.1%), while Hawaii was the only state to experience a price decline (-4.3%). Among all 50 states and the District of Columbia, 31 states reached or exceeded the national growth rate of 5.4%. Compared to the third quarter of 2024, 32 out of the 50 states had an acceleration in house price appreciation in the fourth quarter.

House price growth widely varied across U.S. metro areas year-over-year, ranging from -4.9% to +24.7%. In the fourth quarter of 2024, 18 metro areas, in reddish color on the map above, had negative house price appreciation, while the remaining 366 metro areas experienced positive price appreciation. Punta Gorda, FL had the largest decline in house prices, while Cumberland, MD-WV saw the highest increase over the previous four quarters.

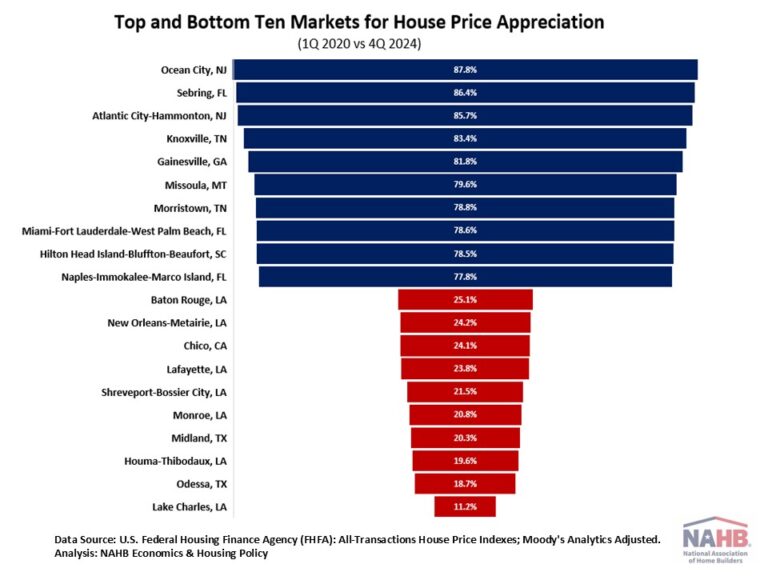
Additionally, house prices have increased dramatically since the COVID-19 pandemic. Nationally, house prices rose 53% between the first quarter of 2020 and the fourth quarter of 2024. More than half of metro areas saw house prices rise by more than the national price growth rate of 53%.

The table below shows the top and bottom ten markets for house price appreciation between the first quarter of 2020 and the fourth quarter of 2024. Among all the metro areas, house price appreciation ranged from 11.2% to 87.8%. Ocean City, NJ experienced the highest house price appreciation. Lake Charles, LA had the lowest appreciation for the third quarter in a row.

Discover more from Eye On Housing

Subscribe to get the latest posts sent to your email.


This article was originally published by a eyeonhousing.org . Read the Original article here. .


Real GDP of metropolitan areas rose 2.7% in 2023, with the “real estate, rental and leasing” sector contributing 0.34 percentage points and construction contracting growth by 0.11 percentage points. While many metro areas followed the national growth trend, each region has its unique economic narrative. This article explores the economic trends driving these outcomes, focusing on the leading metro areas in real GDP growth, the construction sector’s standout performers over a five-year period, and the top MSAs benefiting from growth in real estate, rental, and leasing.

In 2023, real GDP increased in 348 Metropolitan Statistical Areas (MSAs), decreased in 34 MSAs, and remained unchanged in 3 MSAs, according to the U.S. Bureau of Economic Analysis (BEA). The data, which was recently released in December 2024, shows the range of growth spanned from 42.9% in Midland, TX, to a contraction of -9.3% in Elkhart-Goshen, IN. Three MSAs—Ithaca, NY, Joplin, MO, and Longview, WA—saw no change in real GDP.

The oil and gas sector played a significant role in driving growth in many MSAs. Midland, TX, recorded the highest growth due to a surge in oil production, with the “mining, quarrying, and oil and gas extraction” industry contributing a hefty 41.2 percentage points to the metro area’s GDP growth. Furthermore, among the top five highest growth areas, four had this industry as the leading contributor.

Top Five MSAs by Real GDP Growth and Leading Contributing Industry

Metro Area2023 Real GDP Growth (%)Largest Contributing IndustryContribution (Percentage Points)Midland, TX42.9Mining, quarrying, and oil and gas extraction41.2Greeley, CO18.5Mining, quarrying, and oil and gas extraction15.5El Centro, CA16.4Agriculture, forestry, fishing, and hunting14.4Odessa, TX11.6Mining, quarrying, and oil and gas extraction7.1Wheeling, WV-OH10.7Mining, quarrying, and oil and gas extraction9.9

Construction Sector Growth (2018–2023)

From 2018 to 2023, the construction industry exhibited a mixed performance, with 140 MSAs reporting positive compound annual growth rates (CAGR), 188 recording declines, and 5 showing no change. States like Idaho, Arizona, and Florida emerged as hotspots for construction growth during this period while states in the East North Central division appear to have slowdowns in this sector.

Elizabethtown-Fort Knox, KY, led with a 14.4% CAGR in construction. This boom was primarily driven by the development of the BlueOval SK Battery Park, slated to begin production in 2025. This joint venture between Ford Motor Company and SK On, a South Korean electric vehicle (EV) supplier, is expected to be the largest EV battery manufacturing facility globally.

According to a study by the Hardin County Chamber of Commerce (HCCC), the project is estimated to:

Generate $1.6 billion in construction payroll.

Create 5,000 jobs by the end of 2025.

Require 3,100 additional housing units to accommodate new workers.

Top Five MSAs for Construction Growth (2018–2023):

Metro AreaCAGR (%)Average Contribution (Percentage Points)Elizabethtown-Fort Knox, KY14.40.45Clarksville, TN-KY10.80.03Punta Gorda, FL10.61.12Jacksonville, NC10.20.32The Villages, FL10.11.23

Real Estate, Rental, and Leasing Growth (2018–2023)

The real estate, rental, and leasing sector also showed robust growth in many regions, with 209 MSAs experiencing positive growth during the five-year period. The Villages, FL, recorded the highest CAGR at 14.1%, reflecting its status as the nation’s largest community designed for an aging population.

Other MSAs like Jonesboro, AR, saw significant real estate growth due to proximity to Arkansas State University, while Austin-Round Rock-Georgetown, TX, benefited from a population influx because of its thriving tech economy.

Top Five MSAs for Real Estate Growth (2018–2023):

Metro AreaCAGR (%)Average Contribution (Percentage Points)The Villages, FL14.13.6Jonesboro, AR12.11.2Twin Falls, ID10.81.1Austin-Round Rock-Georgetown, TX10.71.4El Centro, CA10.60.6

Visit NAHB’s dashboard for additional data and visualizations on demographics, housing market and the economy for all metro areas.

Discover more from Eye On Housing

Subscribe to get the latest posts sent to your email.


This article was originally published by a eyeonhousing.org . Read the Original article here. .

House prices posted modest annual growth for the third quarter of 2024, as elevated mortgage rates kept many potential home buyers away from the housing market. Nonetheless, housing inventory has improved in recent months.

Nationally, house price appreciation has decelerated for two straight quarters. According to the quarterly all-transactions House Price Index (HPI) released by the Federal Housing Finance Agency (FHFA), U.S. house prices rose 5.1% in the third quarter of 2024, compared to the third quarter of 2023.

The quarterly FHFA HPI not only reports house prices at the national level, but also provides insights about house price fluctuations at the state and metro area levels. The FHFA HPI used in this article is the all-transactions index, measuring average price changes in repeat sales or refinancings on the same single-family properties.  

Between the third quarter of 2023 and the third quarter of 2024, all 50 states and the District of Columbia had positive house price appreciation, ranging from 1.2% to 8.8%. New Jersey and Connecticut topped the house price appreciation list with an 8.8% gain. They were followed by Rhode Island with an 8.4% gain. Meanwhile, the District of Columbia had the lowest price growth (+1.2%). Among all 50 states and the District of Columbia, 29 states exceeded the national growth rate of 5.1%. Compared to the second quarter of 2024, 40 out of the 50 states had a deceleration in house price appreciation in the third quarter.

House prices have changed unevenly across U.S. metro areas, from the third quarter of 2023 to the third quarter of 2024. House price appreciation ranged from -9.0% to +19.1%. In the third quarter of 2024, 21 metro areas, in reddish color on the map above, had negative house price appreciation, while the remaining 363 metro areas experienced positive price appreciation.

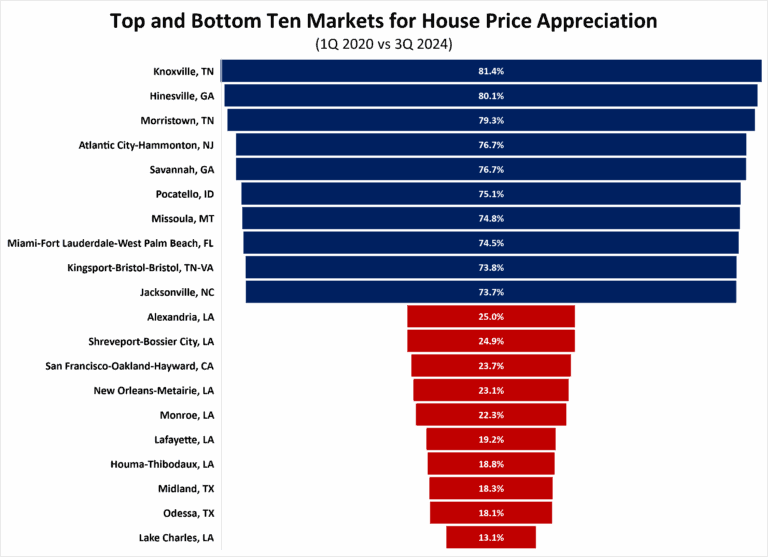
Additionally, house prices have increased dramatically since the COVID-19 pandemic. Nationally, house prices rose 50.4% between the first quarter of 2020 and the third quarter of 2024. More than half of the metro areas saw house prices rise by more than the national price growth rate of 50.4%.

The table below shows the top and bottom ten markets for house price appreciation between the first quarter of 2020 and the third quarter of 2024. Among all the metro areas, house price appreciation ranged from 13.1% to 81.4%. Knoxville, TN has experienced the highest house price appreciation. Lake Charles, LA had the lowest appreciation.

Discover more from Eye On Housing

Subscribe to get the latest posts sent to your email.


This article was originally published by a eyeonhousing.org . Read the Original article here. .

The residential construction industry plays a crucial role in driving economic growth and local community development. It has a lasting impact on local communities by creating jobs, improving infrastructure, boosting local businesses, and enhancing property values.

The residential construction industry is more reliant on labor than capital in the United States. As of October 2024, about 3.4 million people work in the residential construction industry in the United States, with 957,000 builders and 2.4 million residential specialty trade contractors.

The NAHB analysis of the Quarterly Census of Employment and Wages (QCEW) data provides an insight into employment and establishment concentration of the residential construction industry across metro areas (MSA).

Location quotients (LQ) are ratios that compare the concentration of the residential construction industry within a metro area to the concentration of the industry nationwide. LQs are used in this article to evaluate the employment and establishment concentration of the residential construction industry in local areas.  

Employment

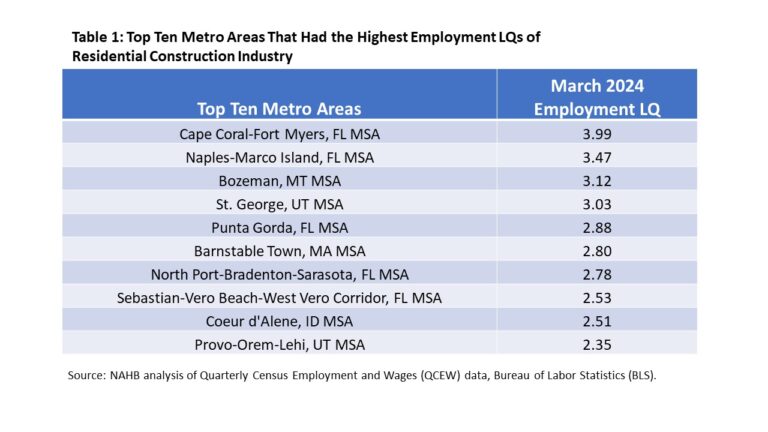
The March 2024 QCEW data indicates that employment in the residential construction industry, while found throughout the country, was more highly concentrated in some metro areas than others.

Among 387 metro areas, employment LQs ranged from 0.02 to 3.99. Cape Coral-Fort Myers, FL had the highest employment concentration of the residential construction industry with an LQ of 3.99. It was followed by Naples-Marco Island, FL (LQ: 3.47) and Bozeman, MT (LQ: 3.12).

Florida, experiencing a rapid growth in population, reported a relatively high employment concentration in residential construction. All metro areas in Florida had a higher employment concentration than the nation’s concentration. Moreover, half of the top ten metro areas with the highest employment concentrations of the residential construction industry were in Florida.

Various metro areas in the Mountain Division also have a high reliance on the residential construction industry for employment. Bozeman, MT (LQ: 3.12), St. George, UT (LQ: 3.03), Coeur d’Alene, ID (LQ: 2.51), and Provo-Orem-Lehi, UT (LQ: 2.35) were ranked in the top ten markets with a higher employment concentration of the residential construction industry.

Metro areas in the South reported the three lowest employment LQs of the residential construction industry. The lowest was Owensboro, KY with a LQ of 0.02, followed by Dalton, GA (LQ: 0.03) and Eagle Pass, TX (LQ: 0.05).

Establishment

On aggregate, New York-Newark-Jersey City, NY-NJ, Los Angeles-Long Beach-Anaheim, CA, and Miami-Fort Lauderdale-West Palm Beach, FL were the three metro areas that not only had the most employment in residential construction but also had the largest number of residential construction establishments among all metro areas. However, these three metro areas didn’t have higher establishment concentrations of the residential construction industry than the nation.

Among all the 387 metro areas, 104 of them had a higher establishment concentration of the residential construction industry than the nation. St. George, UT had the highest establishment concentration of the residential construction industry, which was more than three times that of the nation, followed by Barnstable Town, MA (LS: 2.42) and Cape Coral-Fort Myers, FL (LQ: 2.38).

The three metro areas in the South that reported the lowest employment LQs of the residential construction industry also had the lowest establishment LQs of the residential construction industry.

For more information on QCEW, please check the “Handbook of Methods” published by BLS.

Discover more from Eye On Housing

Subscribe to get the latest posts sent to your email.


This article was originally published by a eyeonhousing.org . Read the Original article here. .

House price appreciation was recorded in all 50 states and the District of Columbia. Limited resale inventory and strong growth in demand continued to put upward pressure on house prices.

Nationally, house prices grew at a relatively slower pace, compared to double-digit annual growth during the COVID-19 pandemic. According to the quarterly all-transactions House Price Index (HPI) released by the Federal Housing Finance Agency (FHFA), U.S. house prices rose 5.9% in the second quarter of 2024, compared to the second quarter of 2023. This rate of price growth decreased from 6.4% in the first quarter of 2024.

The quarterly FHFA HPI not only reports house prices at the national level, but it also provides insights about house price fluctuations at the state and metro area levels. The FHFA HPI used in this article is the all-transactions index, measuring average price changes in repeat sales or refinancings on the same single-family properties.  

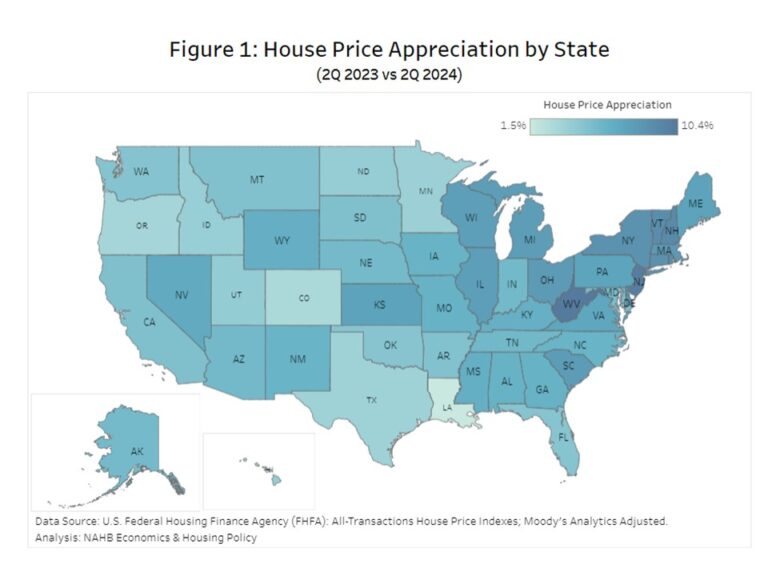
Between the second quarter of 2023 and the second quarter of 2024, all 50 states and the District of Columbia had positive house price appreciation, ranging from 1.5% to 10.4%. West Virginia led the way with the highest price appreciation (+10.4%). It was followed by New Jersey with a 10.1% gain, and New Hampshire with a 9.1% gain. Meanwhile, Louisiana had the lowest price growth (+1.5%). Among all 50 states and the District of Columbia, 28 states exceeded the national growth rate of 5.9%. Compared to the first quarter of 2024, thirty-five out of the 50 states had a deceleration in house price appreciation in the second quarter.

House prices have changed unevenly across U.S. metro areas, from the second quarter of 2023 to the second quarter of 2024. House price appreciation ranged from -4.6% to +20.7%. In the second quarter of 2024, 14 metro areas, in reddish color on the map above, had negative house price appreciation, while the remaining 370 metro areas experienced positive price appreciation.

Meanwhile, house prices in the second quarter of 2024 are much higher than they were before the pandemic. Nationally, house prices rose 49.7% between the first quarter of 2020 and the second quarter of 2024. More than half of the metro areas saw house prices rise by more than the national price growth rate of 49.7%. Among all the metro areas, house price appreciation ranged from 13.8% to 81.0%. House prices in the South and the West have grown faster than the prices in the Midwest and Northeast. Within the top 20 metro areas that had the highest house price appreciation, 11 metro areas are in the South Atlantic Division and six in the East South Central Division, while none were in the Midwest.

Discover more from Eye On Housing

Subscribe to get the latest posts sent to your email.


This article was originally published by a eyeonhousing.org . Read the Original article here. .
Pin It