If you’re thinking about buying or selling a house right now and wondering about the real estate housing market, you’re not alone. The housing market has seen a lot of unusual trends in the past couple of years, so it makes sense you’d want the latest market update before you decide to buy or sell. The truth is, housing market predictions are about as reliable as weather forecasts. The real estate pros make their best predictions based on data, but no one can know what’s going to happen with 100% accuracy.
Still, even if you don’t know for sure, you can check out what the experts are saying and make some pretty good guesses. Just remember, you never want to let a market prediction control your housing decisions . . . only your personal situation and finances should do that!
With that said, here’s the real estate market forecast.
Mortgage interest rates have been rising like crazy over the last few years, thanks to the Federal Reserve (also known as the Fed) repeatedly raising the federal funds rate. But will that trend finally start heading in the other direction in 2024? Yep! In fact, it already has.
Average interest rates across the U.S. for both 30-year and 15-year fixed-rate mortgages began steadily going down in November 2023, and that trend continued into January 2024.1 Rates will likely keep going down throughout the rest of the year, especially since the Fed projected that it’ll lower the federal funds rate three times in 2024.2
So, what does that mean for the housing market? First, it means that buyer demand could increase in 2024 since more people will be able to afford a mortgage. It also means that, if you’re financially ready to buy a house, there’s no reason to wait around—since an increase in demand would also lead to an increase in home prices.
How do you know if you’re financially ready to buy? Let’s take a look.
Should I Buy a House in 2024?
You’re ready to buy a house in 2024 if (and only if) you can check off these boxes:
You’re debt-free.
You have an emergency fund of 3–6 months of expenses.
Your monthly house payment will be 25% or less of your monthly take-home pay on a 15-year fixed-rate mortgage.
You have a down payment. A 20% down payment is ideal because you’ll avoid paying private mortgage insurance (PMI). But 5–10% is okay, too, if you’re a first-time home buyer. Just be prepared to pay PMI. And steer clear of FHA and VA loans—you’ll pay much more in fees with them.
You can pay the closing costs up front without stealing from your down payment.
If you don’t meet these qualifications, it doesn’t matter if the market is in your favor. Buying a home would end up being a curse instead of a blessing. Take your time to get in a better financial position so you can buy a house the right way.
A housing market recession means the total number of home sales has been shrinking for at least six months in a row. So, has that been happening? Nope! In fact, home sales actually grew from May to June 2023, and again from July to August.3 That means the housing market is steady, even though sales saw a seasonal decline toward the end of the year.
Find expert agents to help you buy your home.
But even if home sales become unstable and start decreasing consistently in 2024, a housing recession isn’t really something to worry about—the prices will stay about the same.
You’d only worry about the market if the declining home sales were indicating too much supply (houses for sale) and not enough buyer demand. That would make home values plummet and hurt the overall economy. But that’s not what’s happening!
Forecast: Will the Housing Market Crash in 2024?
If you’re concerned about the housing market potentially crashing in 2024, you can put those worries to rest. Not only will prices not drop substantially in 2024, but prices are actually more likely to continue rising. The National Association of Realtors predicts that when August 2024 rolls around, existing home prices will be 2.6% higher than the year before.4 Freddie Mac expects a 0.8% bump during the same timeframe.5
To get a clearer picture of what to expect from the housing market in 2024, let’s go over the three factors that influence prices the most: inventory, buyer demand and interest rates.
What’s the Average House Price in 2024?
The average home price in the U.S. was $736,388 in December 2023 (including existing homes, new builds, single-family homes, condos and townhomes). But most experts report on the median, which was $410,000 in December 2023.6
Just so you know, the median price is right smack-dab in the middle of lowest to highest prices. It’s usually better to look at the median home price than the average. That’s because a small group of abnormally high- or low-priced houses can throw off the average and make regular homes seem more or less expensive than they really are. (Just something to keep in mind as you watch the average house price fluctuate in 2024.)
The main thing to know about this (and any) market is that home prices are determined by inventory and demand. Here’s a look at what you can expect in each of those areas.
Housing Inventory
Housing inventory simply refers to the number of houses for sale. When fewer houses are available, buyers are willing to pay more, and sellers have more leverage to increase their asking price. So, low inventory leads to higher home prices. It’s a big reason why buying a home has gotten so expensive recently.
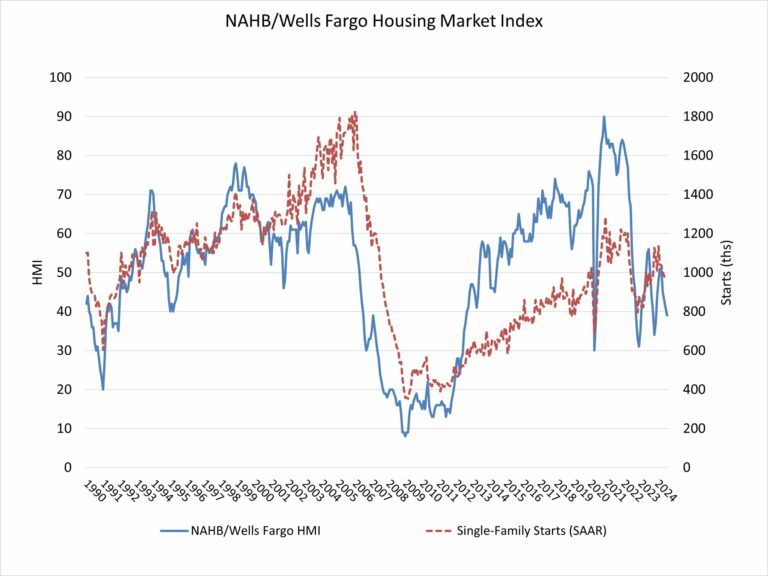
When it comes to housing inventory for 2024, it looks like the number of houses on the market will still be low. For reference: The total housing inventory in December 2023 was 4.9% higher than the year before, but it was 4.7% lower than November 2023 and still a whopping 36% lower than pre-COVID levels.7
And even though plenty of new houses are being built, it’s not happening fast enough to make a major difference in overall housing inventory. In fact, the number permits issued for new builds was down 11.7% year-to-date in November 2023.8
Buyer Demand
Like we talked about earlier, buyer demand could sink in 2024, especially if the Federal Reserve continues to increase federal interest rates. Today, buyer demand is still greater than housing supply. So home prices are likely to stay mostly the same in 2024, with some markets experiencing a small increase or a small decrease in dollar amount.
Here’s the thing: The market shouldn’t determine your decision to buy a house. If you’re prepared financially like we talked about earlier, then it’s a good time to buy a home—even if inventory is limited and interest rates are high. If you’re not financially prepared, it’s not a good time, even if there’s plenty of inventory and rates are down.
What the 2024 Housing Market Means for Buyers and Sellers
Is It a Buyer’s Market?
In a buyer’s market, there are more homes for sale than buyers. But since home supply is still low, it doesn’t look like there’ll be a buyer’s market anytime soon.
The good news is, the market isn’t as hot as it was in the past few years. If you’re looking to buy, you’ll have a few more options—and maybe less competition. Yes, prices are still high, but the frenzy is slowing down.
Is It a Seller’s Market?
A seller’s market is when demand for homes is higher than the supply of homes. And that’s still the case right now. If you’re planning to sell your house, you can expect to sell it fairly quickly for close to your asking price—as long as your asking price is realistic for the current market. (It’s easy to value your home based on memories and how much you loved living there, but a good agent will help you price it fairly.)
Will There Be a Lot of Foreclosures in 2024?
Foreclosures will likely rise throughout 2024, just as they did in 2023. For reference, the number of foreclosures in 2023 was 10% higher than the year before.9
Now, if you’re concerned about a repeat of the crazy number of foreclosures we saw back in 2010 on the heels of the Great Recession, here’s a stat that should give you some peace of mind: While foreclosure repossessions were up 10% in 2023 compared to 2022—that was still down 28% compared to 2019, and down 88% compared to the peak of foreclosures in 2010 caused by the Great Recession.10
Plus, most of the homes in foreclosure today probably won’t be repossessed by lenders like they were during the Great Recession. That’s because many of the borrowers in foreclosure today have positive equity (their homes are worth more than they owe), which they can use to avoid foreclosure by selling their house.11
Here’s what all this foreclosure stuff means for homeowners and home buyers:
Homeowners: Since the market isn’t going to get flooded with foreclosures, you can rest easy, knowing your home isn’t going to tank in value because of a sudden increase in home inventory.
Home buyers: If you’re waiting to find a great deal on a foreclosure, don’t hold your breath. This market is nothing like the Great Recession. And keep in mind, buying a foreclosed home could come with its own set of potential issues. So, make sure you do your homework on the house and know what you’re getting yourself into before you buy.
How to Buy or Sell With Confidence in Any Housing Market
I know buying or selling a house may seem overwhelming, especially after all the wackiness we’ve seen in the market over the last few years, but you’ve got this!
Yes, the cost of buying a house is higher than it’s ever been before. And yes, selling a home in 2024 will come with obstacles—like higher-than-normal interest rates and high home values pricing out a lot of would-be buyers. But just because buying or selling may be more difficult now than it was a couple of years back, it is not impossible.
You still control your financial future. That includes real estate—no matter what’s going on in the market.
This article was originally published by a www.ramseysolutions.com . Read the Original article here. .


