Tag

Market

Browsing


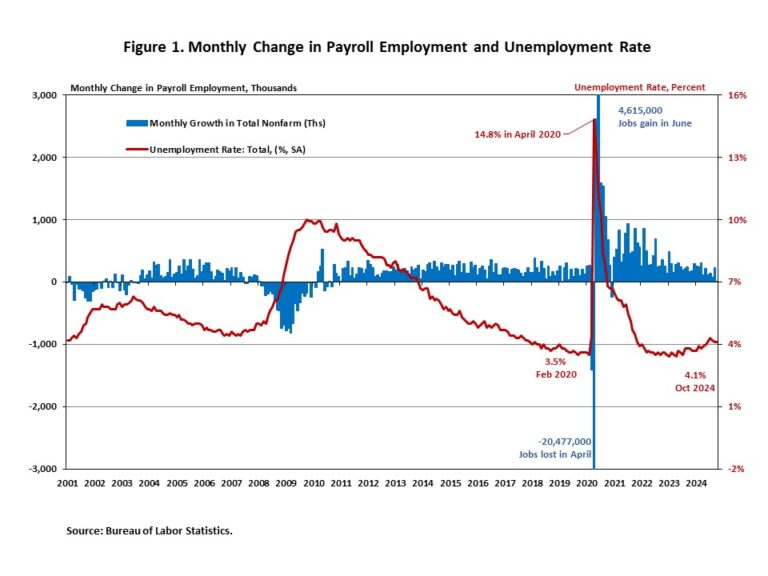
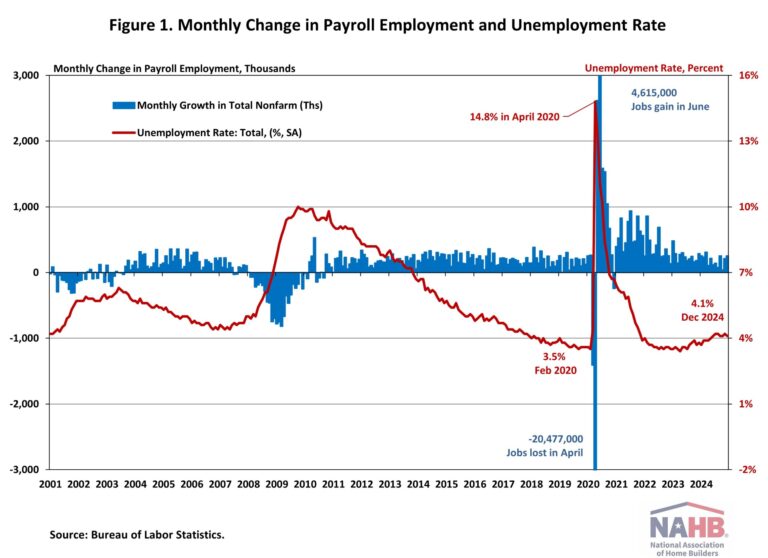
The U.S. labor market finished 2024 with solid job growth and a decrease in the unemployment rate.

In December, wage growth slowed. Wages grew at a 3.9% year-over-year (YOY) growth rate, down 0.3 percentage points from a year ago. Wage growth is outpacing inflation, which typically occurs as productivity increases.

National Employment

According to the Employment Situation Summary reported by the Bureau of Labor Statistics (BLS), total nonfarm payroll employment rose by 256,000 in December. Since January 2021, the U.S. job market has added jobs for 48 consecutive months, making it the third-longest period of employment expansion on record.

The estimates for the previous two months were revised. The monthly change in total nonfarm payroll employment for October was revised up by 7,000, from +36,000 to +43,000, while the change for November was revised down by 15,000 from +227,000 to +212,000. Combined, the revisions were 8,000 lower than previously reported.

In 2024, more than 2.3 million jobs were created. Additionally, monthly employment growth averaged 186,000 per month, compared to the 251,000 monthly average gain for 2023. The U.S. economy has created nearly 8.7 million jobs since March 2022, when the Fed enacted the first interest rate hike of this cycle.

The unemployment rate decreased to 4.1% in December. While the number of employed persons increased by 478,000, the number of unemployed persons decreased by 235,000.

Meanwhile, the labor force participation rate—the proportion of the population either looking for a job or already holding a job—remained unchanged at 62.5%. For people aged between 25 and 54, the participation rate decreased one percentage point to 83.4%. While the overall labor force participation rate remains below its pre-pandemic levels of 63.3% at the beginning of 2020, the rate for people aged between 25 and 54 exceeds the pre-pandemic level of 83.1%.

In December, employment continued to trend up in health care (+46,000), government (+33,000), and social assistance (+23,000). Retail trade added 43,000 jobs, following a job loss in November.

Construction Employment

Employment in the overall construction sector increased by 8,000 in December, after 8,000 gains in November. While residential construction gained 4,000 jobs, non-residential construction employment added 4,700 jobs for the month.

Residential construction employment now stands at 3.4 million in December, broken down as 961,000 builders and 2.4 million residential specialty trade contractors. The 6-month moving average of job gains for residential construction was 3,333 a month. Over the last 12 months, home builders and remodelers added 51,000 jobs on a net basis. Since the low point following the Great Recession, residential construction has gained 1,396,200 positions.

In December, the unemployment rate for construction workers rose to 5.5% on a seasonally adjusted basis. The unemployment rate for construction workers has remained at a relatively lower level, after reaching 15.3% in April 2020 due to the housing demand impact of the COVID-19 pandemic.

Discover more from Eye On Housing

Subscribe to get the latest posts sent to your email.


This article was originally published by a eyeonhousing.org . Read the Original article here. .


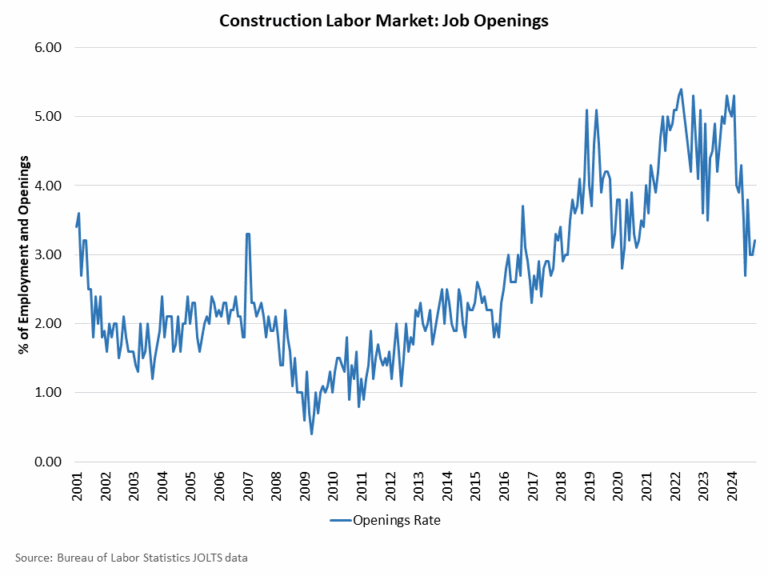
After a period of slowing associated with declines for some elements of the residential construction industry, the count of open construction sector jobs has remained lower than a year ago, per the November Bureau of Labor Statistics’ Job Openings and Labor Turnover Survey (JOLTS). However, the most recent data showed a slight gain for the number of open construction sector jobs.

The number of open jobs for the overall economy increased from 7.84 million to 8.10 million in November. Nonetheless, this is notably smaller than the 8.93 million estimate reported a year ago and reflects a softened aggregate labor market. Previous NAHB analysis indicated that this number had to fall below 8 million on a sustained basis for the Federal Reserve to feel more comfortable about labor market conditions and their potential impacts on inflation. With estimates remaining below 8 million for national job openings, the Fed is continuing a policy of interest rate cuts.

The number of open construction sector jobs increased from a revised 259,000 in October to 276,000 in November. Nonetheless, the November reading of opening, unfilled construction jobs is lower than that registered a year ago (454,000) due to a slowing of construction activity because of elevated interest rates.

The construction job openings rate edged higher to 3.2% in November but remains lower than a year ago, albeit with a fair amount of statistical month-to-month noise in the recent data.

The layoff rate in construction remained in the 2% range in November (2.1%). The quits rate in construction fell to 1.7% in November.

Discover more from Eye On Housing

Subscribe to get the latest posts sent to your email.


This article was originally published by a eyeonhousing.org . Read the Original article here. .


Mortgage rates climbed in November, driven by market volatility and a surge in Treasury yields following the recent elections. On the day after the election results, the 10-year Treasury yield spiked by 14 basis points (bps), setting the stage for further rate increases throughout the month.

According to Freddie Mac, the average rate for a 30-year fixed-rate mortgage increased 38 basis points from October, reaching 6.81%. Meanwhile, the 15-year fixed-rate mortgage saw an even steeper increase of 43 bps to land at 6.03%.

The 10-year Treasury yield, a key benchmark for mortgage rates, averaged 4.37% in November—38 bps higher than October’s average. This increase reflected heightened market uncertainty and persistent volatility. Looking ahead, the Federal Reserve is set to meet on December 17-18 to evaluate the possibility of another rate cut. Since the federal funds rate influences interest rates, a rate cut could potentially ease long-term mortgage rates, but this decision will hinge on the latest employment and inflation data, and other macroeconomic factors that could have an upward pressure on inflation including larger government deficits and higher tariffs. NAHB forecasts additional declines to the federal funds rate into a range below 4%.

Discover more from Eye On Housing

Subscribe to get the latest posts sent to your email.


This article was originally published by a eyeonhousing.org . Read the Original article here. .


After a period of slowing associated with declines for some elements of the residential construction industry, the count of open construction sector jobs trended lower in the October data, per the Bureau of Labor Statistics’ Job Openings and Labor Turnover Survey (JOLTS). The data indicates the demand for construction labor market remains weaker than a year ago.

In contrast, after revisions, the number of open jobs for the overall economy increased from 7.37 million to 7.74 million in October. Nonetheless, this is notably smaller than the 8.69 million estimate reported a year ago and is a sign of a softening aggregate labor market. Previous NAHB analysis indicated that this number had to fall below 8 million on a sustained basis for the Federal Reserve to feel more comfortable about labor market conditions and their potential impacts on inflation. With estimates remaining below 8 million for national job openings, the Fed is underway easing credit conditions.

The number of open construction sector jobs fell from a revised 258,000 in September to a softer 249,000 in October. Elements of the construction sector slowed in prior months as tight Fed policy persisted. The October reading of opening, unfilled construction jobs is lower than that registered a year ago: 413,000.

The construction job openings rate fell back to 2.9% in October and continues to trend lower, albeit with a fair amount of statistical month-to-month noise in the recent data.

The layoff rate in construction moved lower to 1.2% in October after a 2% rate in September. This was the lowest layoff rate for construction in the data series (going back to late 2000). The quits rate in construction increased to 1.9% in October.

Discover more from Eye On Housing

Subscribe to get the latest posts sent to your email.


This article was originally published by a eyeonhousing.org . Read the Original article here. .


Job growth decelerated significantly in October, driven by the effects of strikes and hurricanes. As stated in this month’s job report, October data are “the first collected since Hurricanes Helene and Milton struck the United States”. Despite lower monthly job gains, the unemployment rate held steady at 4.1%, indicating the labor market remains solid.

In October, wage growth remained unchanged. Wages grew at a 4.0% year-over-year (YOY) growth rate, down 0.3 percentage points from a year ago. Wage growth is outpacing inflation, which typically occurs as productivity increases.

National Employment

According to the Employment Situation Summary reported by the Bureau of Labor Statistics (BLS), total nonfarm payroll employment rose by 12,000 in October, down sharply from a downwardly revised increase of 223,000 jobs in September, marking the smallest monthly job gain in years. The estimates for the previous two months were revised lower. The monthly change in total nonfarm payroll employment for August was revised down by 81,000, from +159,000 to +78,000, while the change for September was revised down by 31,000 from +254,000 to +223,000. Combined, the revisions were 112,000 lower than previously reported.

In the first ten months of 2024, 1,701,000 jobs were created. Additionally, monthly employment growth averaged 170,000 per month, compared to the 251,000 monthly average gain for 2023. The Fed’s easing cycle began on September 18, marking the end of a period of restrictive monetary policy. The U.S. economy has created about 8 million jobs since March 2022, when the Fed enacted the first interest rate hike of this cycle.

The unemployment rate was unchanged at 4.1% in October. While the number of employed persons decreased by 368,000, the number of unemployed persons rose by 150,000.

Meanwhile, the labor force participation rate—the proportion of the population either looking for a job or already holding a job—decreased by one percentage point to 62.6%. However, for people aged between 25 and 54, the participation rate declined for the third straight month to 83.5%. This rate still exceeds the pre-pandemic level of 83.1%. Meanwhile, the overall labor force participation rate remains below its pre-pandemic levels of 63.3% at the beginning of 2020.

In October, employment continued to trend up in health care (+52,000) and government (+40,000). Temporary help for business and professional services lost 49,000 jobs. Manufacturing employment fell by 46,000 in October. The BLS noted that a decline of 44,000 in transportation equipment manufacturing was “largely due to strike activity.”

Construction Employment

Employment in the overall construction sector increased by 8,000 in October, after 27,000 gains in September. While residential construction shed 5,300 jobs, non-residential construction employment added 13,500 jobs for the month.

Residential construction employment now stands at 3.4 million in October, broken down as 957,000 builders and 2.4 million residential specialty trade contractors. The 6-month moving average of job gains for residential construction was 3,000 a month. Over the last 12 months, home builders and remodelers added 44,500 jobs on a net basis. Since the low point following the Great Recession, residential construction has gained 1,388,200 positions.

In October, the unemployment rate for construction workers rose to 5.3% on a seasonally adjusted basis. The unemployment rate for construction workers has remained at a relatively lower level, after reaching 15.3% in April 2020 due to the housing demand impact of the COVID-19 pandemic.

Discover more from Eye On Housing

Subscribe to get the latest posts sent to your email.


This article was originally published by a eyeonhousing.org . Read the Original article here. .


The NAHB/Westlake Royal Remodeling Market Index (RMI) for the third quarter of 2024 posted a reading of 63, down two points compared to the previous quarter.

Remodelers remain optimistic about the market even though the overall RMI edged down for the third consecutive quarter. Some have potential customers citing the upcoming election as a reason for putting large projects on hold. Remodelers also continue to face various headwinds such as difficulty finding skilled construction labor and higher interest rates. Nevertheless, the overall RMI reading of 63 is consistent with NAHB’s forecast for steady 2% growth in remodeling spending over the next two years.

The RMI is based on a survey that asks remodelers to rate various aspects of the residential remodeling market “good”, “fair” or “poor.”  Responses from each question are converted to an index that lies on a scale from 0 to 100. An index number above 50 indicates a higher proportion of respondents view conditions as good rather than poor.

Current Conditions

The Remodeling Market Index (RMI) is an average of two major component indices: the Current Conditions Index and the Future Indicators Index. 

The Current Conditions Index is an average of three subcomponents: the current market for large remodeling projects ($50,000 or more), moderately sized projects ($20,000 to $49,999), and small projects (under $20,000). In the third quarter of 2024, the Current Conditions Index averaged 72, declining one point from the previous quarter.  All three components remained well above 50 in positive territory: the component measuring small-sized remodeling projects (under $20,000) rose two points to 77, while both the component measuring moderate remodeling projects (at least $20,000 but less than $50,000) and the component measuring large remodeling projects ($50,000 or more) fell three points to 71 and 67, respectively.

Future Indicators

The Future Indicators Index is an average of two subcomponents: the current rate at which leads and inquiries are coming in and the current backlog of remodeling projects. 

In the third quarter of 2024, the Future Indicators Index was 55, down three points from the previous quarter.  Quarter-over-quarter, the component measuring the backlog of remodeling jobs fell three points to 57 and the component measuring the current rate at which leads and inquiries are coming in dropped two points to 53.

For the full set of RMI tables, including regional indices and a complete history for each RMI component, please visit NAHB’s RMI web page.

Discover more from Eye On Housing

Subscribe to get the latest posts sent to your email.


This article was originally published by a eyeonhousing.org . Read the Original article here. .


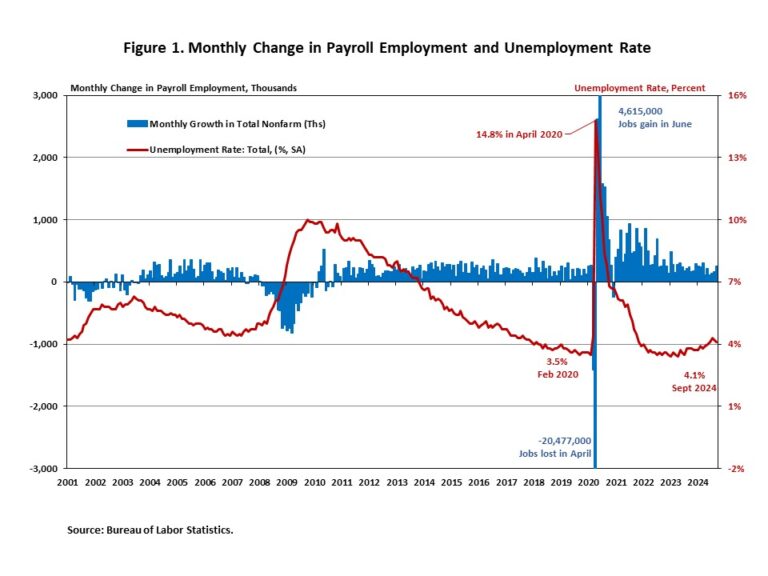
The September jobs report indicates that the U.S. labor market remains strong. Job growth accelerated, and the unemployment rate fell to a three-month low of 4.1%.  Meanwhile, job growth for the previous two months (July and August) was upwardly revised.

In September, wage growth accelerated for the second straight month. Wages grew at a 4.0% year-over-year (YOY) growth rate in September, down 0.5 percentage points from a year ago. Wage growth is outpacing inflation, which typically occurs as productivity increases.

National Employment

Total nonfarm payroll employment increased by 254,000 in September, following an upwardly revised increase of 159,000 jobs in August, as reported in the Employment Situation Summary. It marks the largest monthly job gain in the past six months. The estimates for the previous two months were revised higher. The monthly change in total nonfarm payroll employment for July was revised up by 55,000, from +89,000 to +144,000, while the change for August was revised up by 17,000 from +142,000 to +159,000. Combined, the revisions were 72,000 higher than previously reported.

In the first nine months of 2024, 1,801,000 jobs were created. Additionally, monthly employment growth averaged 200,000 per month, compared with the 251,000 monthly average gain for 2023. The Fed’s easing cycle began on September 18, marking the end of a period of restrictive monetary policy. The U.S. economy has created roughly 8 million jobs since March 2022, when the Fed enacted the first interest rate hike of this cycle.

The unemployment rate fell slightly to 4.1% in September, from 4.2% in August. The September decrease in the unemployment rate reflected the decrease in the number of persons unemployed (-281,000) and the increase in the number of persons employed (+430,000).

Meanwhile, the labor force participation rate—the proportion of the population either looking for a job or already holding a job—was 62.7% for the third consecutive month. However, for people aged between 25 and 54, the participation rate dipped slightly to 83.8%. This rate exceeds the pre-pandemic level of 83.1%. Meanwhile, the overall labor force participation rate is still below its pre-pandemic levels when it stood at 63.3% at the beginning of 2020.

In September, employment continued to trend up in food services and drinking places (+69,000), health care (+45,000), government (+31,000), social assistance (+27,000), and construction (+25,000).

Construction Employment

Job gains in the overall construction sector continued in September, averaging 20,000 per month over the past 12 months. While residential construction gained 7,800 jobs, non-residential construction employment added 17,900 jobs for the month.

Residential construction employment now stands at 3.4 million in September, broken down as 952,000 builders and 2.4 million residential specialty trade contractors. The 6-month moving average of job gains for residential construction was 3,450 a month. Over the last 12 months, home builders and remodelers added 60,500 jobs on a net basis. Since the low point following the Great Recession, residential construction has gained 1,393,800 positions.

In September, the unemployment rate for construction workers rose to 4.9% on a seasonally adjusted basis. The unemployment rate for construction workers has remained at a relatively lower level, after reaching 15.3% in April 2020 due to the housing demand impact of the COVID-19 pandemic.

Discover more from Eye On Housing

Subscribe to get the latest posts sent to your email.


This article was originally published by a eyeonhousing.org . Read the Original article here. .


Consumer confidence fell to a 3-month low in September due to growing concerns about the job market, despite the labor market remaining healthy. Recent job growth revisions showed fewer jobs were added in 2023 than initially reported. However, the unemployment rate remained at a relatively low level and wage growth continued to outpace inflation. This suggests the labor market is cooling from its red-hot pace but remains steady. 

The Consumer Confidence Index, reported by the Conference Board, is a survey measuring how optimistic or pessimistic consumers feel about their financial situation. This index fell from 105.6 to 98.7 in September, the largest monthly decline since August 2021. The Consumer Confidence Index consists of two components: how consumers feel about their present situation and about their expected situation. The Present Situation Index decreased 10.3 points from 134.6 to 124.3, and the Expectation Situation Index fell 4.6 points from 86.3 to 81.7, but still remained above the 80 threshold. Historically, an Expectation Index reading below 80 often signals a recession within a year.

Consumers’ assessment of current business conditions turned negative in September. The share of respondents rating business conditions “good” decreased by 2.3 percentage points to 18.8%, while those claiming business conditions as “bad” rose by 2.9 percentage points to 20.2%. Consumers’ assessments of the labor market worsened as well. The share of respondents reporting that jobs were “plentiful” decreased by 1.8 percentage points to 30.9%, while those who saw jobs as “hard to get” increased by 1.5 percentage points to 18.3%.

Consumers were also less optimistic about the short-term outlook. The share of respondents expecting business conditions to improve fell from 19.1% to 18.5%, while those expecting business conditions to deteriorate rose from 14.5% to 16.6%. Similarly, expectations of employment over the next six months were less positive. The share of respondents expecting “more jobs” increased by 0.1 percentage points to 16.4%, and those anticipating “fewer jobs” climbed by 1.3 percentage points to 18.3%.

The Conference Board also reported the share of respondents planning to buy a home within six months. The share of respondents planning to buy a home rose to 5.7% in September. Of those, respondents planning to buy a newly constructed home increased slightly to 0.7%, while those planning to buy an existing home decreased to 2.4%.

Discover more from Eye On Housing

Subscribe to get the latest posts sent to your email.


This article was originally published by a eyeonhousing.org . Read the Original article here. .


The total market share of non-site built single-family homes (modular and panelized) was just 3% of single-family homes in 2023, according to completion data from the Census Bureau Survey of Construction data and NAHB analysis. This is a slight increase from the 2% share in 2022. This share has been steadily declining since the early-2000s despite the high-level of interest for non-site built construction. This low market share in fact runs counter to some media commentary on off-site construction suggesting recent gains. Nonetheless, there exists potential for market share gains in the years ahead due to the need to increase productivity in the residential construction sector.

In 2023, there were 27,000 total single-family units built using modular (12,000) and panelized/pre-cut (15,000) construction methods, out of a total of 999,000 single-family homes completed. It is worth noting that the Census definitions of off-site construction are relatively narrow. In a separate survey, the Home Innovation Research Labs Survey of U.S. Home Builders has a higher share for panelized construction (5-12%) due to a wider definition of “panelized” construction.

While the Census-measured market share is small, there exists potential for expansion. This 3% market share for 2023 represents a decline from years prior to the Great Recession. In 1998, 7% of single-family completions were modular (4%) or panelized (3%). This marked the largest share for the 1992-2023 period.

One notable regional concentration is found in the Northeast and Midwest. These two regions tie for the highest market share of homes built using non-site build construction methods. In the Northeast, 5% (4,000 homes) of the region’s 61,000 housing units were completed using non-site built construction methods. At the same time, in the Midwest, 5% market share (6,000 homes) of the region’s 126,000 housing units were completed using non-site build construction methods.

With respect to multifamily construction, approximately 7% of multifamily buildings (properties, not units) were built using modular and panelized methods, marking the highest level in the last two decades. This is significantly higher than the 2% share in 2022 and 1% share in 2018-2021. It is notable that modular construction methods accounted for 5% of this share, whereas in previous years it was only panelized construction methods that made up the small share of non-site build methods in multifamily construction.  Prior to last year, the highest levels of modular and panelized methods share in multifamily construction was in 2000 and 2011, where 5% of multifamily buildings were constructed with modular (1%) or panelized construction methods (4%).

Discover more from Eye On Housing

Subscribe to get the latest posts sent to your email.


This article was originally published by a eyeonhousing.org . Read the Original article here. .


NAHB’s featured topic for the second quarter HBGI reveals that 17.5% of single-family and 8.6% of multifamily construction takes place in second home areas. Recent NAHB analysis found that the total count of second homes across the US was 6.5 million, which accounts for 4.6% of the total housing stock. For this analysis, a second home area is a county that has a second home share greater than 10.3% of the county’s total housing stock (these counties fall within the 75th and above percentile of the second home stock share distribution).  There are 788 counties that are considered a second home area based on this definition.

Single-family

Single-family permit data shows that the market share for construction in second home areas has grown by over four percentage points in the past nine years. The earliest data, which is the fourth quarter of 2015, shows that second home areas had a market share of 13.2%. As of the second quarter of 2024, the market share for this geography increased to 17.5%. However, this latest reading is down from a peak of 18.3% in the first quarter of 2023.  

The peak growth rate in construction for second homes areas was at 38.5% in the third quarter of 2021. The first recorded decline in the growth rate occurred in the third quarter of 2022. This downward growth rate was followed by five quarters of declines until the first quarter of 2024.   Second home areas have averaged a growth rate of 9.1% between the fourth quarter of 2015 and the second quarter of 2024, while non-second home areas averaged single-family a growth rate of 5.1% over the same period.  

Multifamily

Although smaller, the market share for second home areas has also grown for multifamily construction. The market share was 5.5% in the fourth quarter of 2015 and is now 8.6%, a 3.1 percentage point increase. This increase in market share has been more volatile than single-family, as growth in construction has not been as consistent for multifamily in second home areas. 

There have been three periods where construction growth for multifamily experienced declines in these areas, such as in 2017 and early 2021. The third period of decline is ongoing, as there have been two consecutive quarters where the growth rate has been negative to start 2024. The latest growth rate is a11.8% decline. This is down from a peak of 53.1% in the third quarter of 2022, as multifamily construction has slowed nationwide. 

Discover more from Eye On Housing

Subscribe to get the latest posts sent to your email.


This article was originally published by a eyeonhousing.org . Read the Original article here. .

Pin It