Tag

macroeconomics

Browsing


Owners’ equity share of household real estate assets remained above 70% for the tenth straight quarter, continuing to mark the highest levels of this share since the late 1950s. The share in the second quarter of 2024 was 72.7%, up from a year ago when it stood at 71.4%. Notably, this is the highest reading of owners’ equity share since the fourth quarter of 1958, when it was 73.3%.

Household real estate assets represent all types of owner-occupied housing including farm houses and mobile homes, as well as second homes that are not rented, vacant homes for sale, and vacant land at current market value. Household real estate liabilities represent all outstanding residential mortgages as well as loans made under home equity lines of credit and home equity loans secured by junior liens. Owners’ equity is the difference between the current market value of the household’s property and the existing debt secured by the property (assets – liabilities).

The market value of household real estate assets rose from $46.4 trillion to $48.2 trillion in the second quarter of 2024 according to the most recent release of U.S. Federal Reserve Z.1 Financial Accounts. Over the year, household real estate assets were 7.7% higher in the second quarter following a 9.2% increase in the first quarter.

Household real estate secured liabilities, i.e. mortgages, home equity loans, and HELOCs, increased 0.8% over the second quarter to $13.1 trillion. This level is 2.6% higher than the second quarter of 2023, the same as the increase in the first quarter of 2.6%.

Discover more from Eye On Housing

Subscribe to get the latest posts sent to your email.


This article was originally published by a eyeonhousing.org . Read the Original article here. .

After its first post-COVID rate hike enacted more than two years ago, the Fed’s Federal Open Market Committee (FOMC) announced at the conclusion of its September meeting a significant reduction for the short-term federal funds rate. Tight monetary policy was undertaken to fight the worst bout of inflation in four decades. Today’s policy action marks the beginning of a series of rate decreases necessary to normalize interest rates and to rebalance monetary policy risks between inflation (risks decreasing) and concerns regarding the health of the labor market (risks rising).

The FOMC reduced its top target rate by 50 basis points from 5.5% (where it has been for more than a year) to a “still restrictive” 5%. This was a larger cut than our forecast projected. In its statement explaining the change of policy, the FOMC noted:

“Recent indicators suggest that economic activity has continued to expand at a solid pace. Job gains have slowed, and the unemployment rate has moved up but remains low. Inflation has made further progress toward the Committee’s 2 percent objective but remains somewhat elevated.”

With the above-noted progress for inflation, today’s action is the beginning of a series of federal funds rate cuts, which ultimately should decrease the top target rate to approximately 3% in the coming quarters, as the rate of inflation moves closer to the target rate of 2%.

The pace of these future expected cuts is somewhat open to debate. Fed Chair Powell noted in his press conference that if weakening conditions require it, the Fed can move quickly. The central bank can also move more slowly if inflation and macro conditions require a more gradual transition.

The Fed’s policy statement declared, “The economic outlook is uncertain, and the Committee is attentive to the risks to both sides of its dual mandate.” The Fed also noted, “In considering additional adjustments to the target range for the federal funds rate, the Committee will carefully assess incoming data, the evolving outlook, and the balance of risks.”

As stated, today’s policy move reflects that the Fed has shifted from a primary policy focus of reducing inflation to balancing the goals of both price stability and maximum employment (with perhaps a greater concern being the labor market). This is due to the fact that inflation continues to moderate. Keep in mind, inflation does not need to be reduced to the central bank’s target of a 2% growth rate for the Fed to cut further. Rather, inflation just needs to be on the path to reaching that goal (likely in late 2025 or early 2026).

The Fed also published an update to its economic projections. The central bank is forecasting a slowing economy but no recession in the coming quarters, with GDP growth rates of 2% for 2025 and 2026 (measured as fourth quarter over prior fourth-quarter growth rates). The unemployment rate is expected to rise but average a nonetheless relatively low level of 4.4% in 2025 before declining slightly in 2026.

The economic projections imply an additional 50 basis points of rate cuts for 2024 (perhaps 25 in November and 25 in December), followed by 150 more in 2025 and 2026. This FOMC projection implies a terminal federal funds rate for this cycle of approximately 3%, consistent with our forecast for the medium-term outlook.

While markets have priced-in a good deal of the current, expected monetary policy path into long-term interest rates, including mortgage rates (which have fallen from 6.7% to 6.2% in the last six weeks), the more immediate effect for housing of today’s rate reduction will be seen in builder and land developer loan conditions. Interest rates for such loans should move lower by approximately 25 to 50 basis points in the coming weeks.

A reduction for the cost of builder and developer loans is a bullish sign for housing affordability. The pace of overall inflation has remained higher than expected in recent quarters due to the growth of housing costs and elevated measures of shelter inflation, which can only be tamed in the long-run by increases in housing supply. Chair Powell noted it will take some time for rent cost growth to slow.

We have argued that higher short-term interest rates have prevented needed construction by increasing the cost and limiting the availability of builder and developer loans, thus harming shelter inflation. However, as Chair Powell himself stated, there are other factors holding back housing, including a lack of efficient zoning and other issues that are limiting supply, and the Fed cannot fix those issues. But I continue to argue that lower rates for builder loans will help, as homebuyers, renters and other housing stakeholders wait on state, local and federal governments to enact more effective regulatory policies.

Discover more from Eye On Housing

Subscribe to get the latest posts sent to your email.


This article was originally published by a eyeonhousing.org . Read the Original article here. .


Inflation eased further in August, reaching a new 3-year low despite persistent elevated housing costs. This inflation report is seen as the final key piece of data before the Fed’s meeting next week. The headline reading provides another dovish signal for future monetary policy, after recent signs of weakness in job reports.

Although shelter costs have been trending downward since peaking in early 2023, they continue to exert significant upward pressure on inflation, contributing over 70% of the total 12-month increase in core inflation. As consistent disinflation and a cooling labor market bring the economy into better balance, the Fed is likely to further solidify behind the case for rate cuts, which could help ease some pressure on the housing market.

Though shelter remains the primary driver of inflation, the Fed has limited ability to address rising housing costs, as these increases are driven by a lack of affordable supply and increasing development costs. Additional housing supply is the primary solution to tame housing inflation. However, the Fed’s tools for promoting housing supply are constrained.

In fact, further tightening of monetary policy would hurt housing supply because it would increase the cost of AD&C financing. This can be seen on the graph below, as shelter costs continue to rise at an elevated pace despite Fed policy tightening. Nonetheless, the NAHB forecast expects to see shelter costs decline further in the coming months, as an additional apartment supply reaches the market.  This is supported by real-time data from private data providers that indicate a cooling in rent growth.

The Bureau of Labor Statistics reported that the Consumer Price Index (CPI) rose by 0.2% in August on a seasonally adjusted basis, the same increase as in July. Excluding the volatile food and energy components, the “core” CPI increased by 0.3% in August, after a 0.2% increase in July.

The price index for a broad set of energy sources fell by 0.8% in August, with declines in electricity (-0.7%), gasoline (-0.6%) and natural gas (-1.9%). Meanwhile, the food index rose 0.1%, after a 0.2% increase in July. The index for food away from home increased by 0.3% while the index for food at home remained unchanged.

The index for shelter (+0.5%) continued to be the largest contributor to the monthly increase in all items index. Other top contributors that rose in August include indexes for airline fares (+3.9%) and motor vehicle insurance (+0.6%). Meanwhile, the top contributors that experienced a decline include indexes for used cars and trucks (-1.0%), household furnishings and operations (-0.3%), medical care (-0.1%) and communication (-0.1%). The index for shelter makes up more than 40% of the “core” CPI. The index saw a 0.5% rise in August, following an increase of 0.4% in July. The indexes for owners’ equivalent rent (OER) increased by 0.5% and rent of primary residence (RPR) rose by 0.4% over the month. These gains have been the largest contributors to headline inflation in recent months.

During the past twelve months, on a non-seasonally adjusted basis, the CPI rose by 2.5% in August, following a 2.9% increase in July. This was the slowest annual gain since February 2021. The “core” CPI increased by 3.2% over the past twelve months, the same increase as in July. The food index rose by 2.1%, while the energy index fell by 4.0%, ending five consecutive months of year-over-year increases for the energy index since February 2024.

NAHB constructs a “real” rent index to indicate whether inflation in rents is faster or slower than overall inflation. It provides insight into the supply and demand conditions for rental housing. When inflation in rents is rising faster than overall inflation, the real rent index rises and vice versa. The real rent index is calculated by dividing the price index for rent by the core CPI (to exclude the volatile food and energy components).

In August, the Real Rent Index rose by 0.1%, after a 0.3% increase in July. Over the first eight months of 2024, the monthly growth rate of the Real Rent Index averaged 0.1%, slower than the average of 0.2% in 2023.

Discover more from Eye On Housing

Subscribe to get the latest posts sent to your email.


This article was originally published by a eyeonhousing.org . Read the Original article here. .
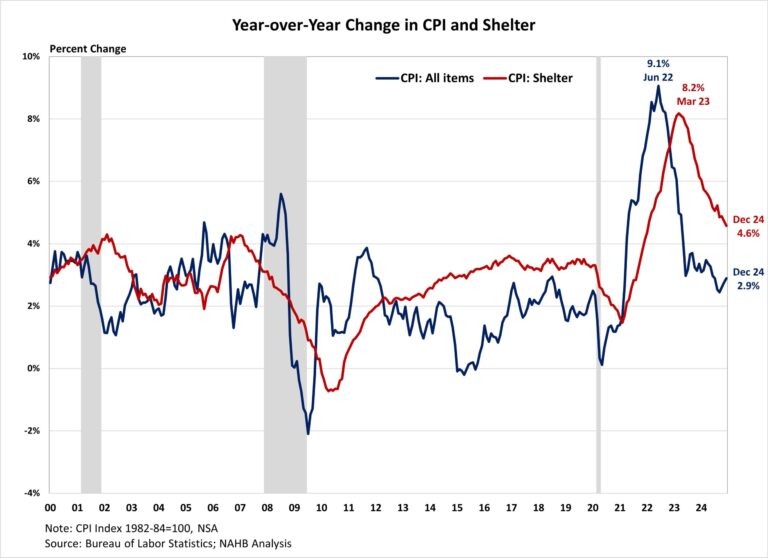

Inflation dropped below a 3% annualized growth rate for the first time since March 2021 even though housing costs continue to climb. Nonetheless, the headline reading is another dovish signal for future monetary policy, following signs of weakness in the most recent job report.   

Despite a slowdown in the year-over-year increase, shelter costs continue to exert significant upward pressure on inflation, contributing nearly 90% of the monthly increase in overall inflation and over 70% of the total 12-month increase in core inflation. As consistent disinflation and a cooling labor market bring the economy into better balance, the Fed is likely to further solidify behind the case for rate cuts, which could help ease some pressure on the housing market.

The Fed’s ability to address rising housing costs is limited because increases are driven by a lack of affordable supply and increasing development costs. Additional housing supply is the primary solution to tame housing inflation. However, the Fed’s tools for promoting housing supply are constrained. In fact, further tightening of monetary policy would hurt housing supply because it would increase the cost of AD&C financing. This can be seen on the graph below, as shelter costs continue to rise despite Fed policy tightening. Nonetheless, the NAHB forecast expects to see shelter costs decline further in the coming months.  This is supported by real-time data from private data providers that indicate a cooling in rent growth.

The Bureau of Labor Statistics reported that the Consumer Price Index (CPI) rose by 0.2% in July on a seasonally adjusted basis, after declining 0.1% in June. Excluding the volatile food and energy components, the “core” CPI increased by 0.2% in July, after a 0.1% increase in June.

The price index for a broad set of energy sources remained flat in July, with increases in electricity (+0.1%) and fuel oil (+0.9%) offsetting a decline in natural gas (-0.7%). The natural gas index was unchanged in July. Meanwhile, the food index rose 0.2%, as it did in June. The index for food away from home increased by 0.2% and the index for food at home rose 0.1%.

In July, the index for shelter (+0.4%) continued to be the largest contributor to the monthly increase in all items index. Among other top contributors that rose in July include indexes for motor vehicle insurance (+1.2%) as well as household furnishings and operations (+0.3%). Meanwhile, the top contributors that experienced a decline in July include indexes for used cars and trucks (-2.3%), medical care (-0.2%), airline fares (-1.6%), and apparel (-0.4%). The index for shelter makes up more than 40% of the “core” CPI. The index saw a 0.4% rise in July, following an increase of 0.2% in June. The indexes for owners’ equivalent rent (OER) increased by 0.4% and rent of primary residence (RPR) rose by 0.5% over the month. These gains have been the largest contributors to headline inflation in recent months. 

During the past twelve months, on a non-seasonally adjusted basis, the CPI rose by 2.9% in July, following a 3.0% increase in June. The “core” CPI increased by 3.2% over the past twelve months, following a 3.3% increase in June. This was the slowest annual gain since April 2021. Over the past twelve months, the food index rose by 2.2%, and the energy index increased by 1.1%. This marks the fifth consecutive month of year-over-year increases for the energy index since February 2024.

NAHB constructs a “real” rent index to indicate whether inflation in rents is faster or slower than overall inflation. It provides insight into the supply and demand conditions for rental housing. When inflation in rents is rising faster than overall inflation, the real rent index rises and vice versa. The real rent index is calculated by dividing the price index for rent by the core CPI (to exclude the volatile food and energy components). In July, the Real Rent Index rose by 0.3%, after a 0.2% increase in June. Over the first seven months of 2024, the monthly growth rate of the Real Rent Index averaged 0.1%, slower than the average of 0.2% in 2023.

Discover more from Eye On Housing

Subscribe to get the latest posts sent to your email.


This article was originally published by a eyeonhousing.org . Read the Original article here. .

According to the Federal Reserve Board’s July 2024 Senior Loan Officer Opinion Survey (SLOOS), lending standards were essentially unchanged for all residential real estate (RRE) categories in the second quarter of 2024.  However, demand for RRE loans remained modestly weaker across all categories in the quarter.  Lending conditions were significantly tighter, and loan demand modestly was weaker across all commercial real estate (CRE) loan categories.  Nevertheless, language from the most recent Federal Open Market Committee (FOMC) suggest that cuts to the federal funds rate are imminent which will be welcomed relief for the real estate market and will help stimulate future loan activity.

Residential Real Estate (RRE)

Four of the seven RRE categories (GSE-eligible, non-Qualified Mortgage or QM jumbo, Non-QM non-jumbo, and Subprime)recorded a net share of banks reported tighter lending standards in Q2 2024 as neutral (i.e., 0%) . The other three categories, which included government (i.e., issued by FHFA, Department of Veteran Affairs, USDA, etc.), QM jumbo, and QM non-jumbo non-GSE eligible recorded a negative reading which means that more banks reported looser rather than tighter conditions.

Six of the seven categories of RRE loans showed a decrease in net tightening from Q1 2024 to Q2 2024, with the only exception being GSE-eligible which increased 1.8 percentage points.  The largest drop in the net tightening percentage occurred for Non-QM jumbo which fell 9.8 percentage points (pp) from 9.8% in Q1 2024 to 0% in Q2 2024.

All RRE categories reported net weaker demand in Q2 2024.  The survey has shown that banks have indicated weaker demand for at least 12 consecutive quarters for all RRE categories going back to Q2 2021 (Subprime leads all RRE categories at 16 consecutive quarters).

Commercial Real Estate (CRE)

Banks reported significantly tighter lending conditions for both multifamily as well as all CRE construction & development loans in Q2 2024.  However, both categories showed less net tightening than they did a quarter before, most noticeably multifamily falling 11.7 percentage points.  Nevertheless, it has been 10 consecutive quarters of tighter lending conditions for construction & development and 9 consecutive quarters for multifamily.

For multifamily, 17.5% of banks reported net weakening of demand for loans which is 16.4 percentage points lower compared to Q1 2024.  As for construction & development loans, 15.9% of banks reported net weakening of demand for loans which was little changed from the previous quarter.  Weaker demand has persisted for roughly the last two years for construction & development (10 consecutive quarters) and multifamily (8 consecutive quarters).

Special Questions

The Federal Reserve included a set of special questions this quarter which asked banks “to describe the current level of lending standards at your bank relative to the range of standards that has prevailed between 2005 and the present.”  Effectively, they are asking banks to think about the median lending standards over the last two decades and determine where do conditions today rank on this continuum.  On balance, banks indicated that the current level of lending standards is located at the tighter end of this range for all loan categories, including CRE and RRE loans.

Discover more from Eye On Housing

Subscribe to get the latest posts sent to your email.


This article was originally published by a eyeonhousing.org . Read the Original article here. .

The Federal Reserve’s monetary policy committee once again held constant the federal funds rate at a top target of 5.5% at the conclusion of its July meeting. In its statement, the Federal Open Market Committee (FOMC) noted:

“Recent indicators suggest that economic activity has continued to expand at a solid pace. Job gains have moderated, and the unemployment rate has moved up but remains low. Inflation has eased over the past year but remains somewhat elevated. In recent months, there has been some further progress toward the Committee’s 2 percent inflation objective.“

Compared to the Fed’s June commentary, the current statement upgraded “modest further progress” from last month to “some further progress” with respect to achieving the central bank’s 2% inflation target. This change in wording moves the Fed closer to reducing interest rates. Importantly, the July policy statement also noted:

“The Committee judges that the risks to achieving its employment and inflation goals continue to move into better balance.”

This text, previewed by various Federal Reserve officials in recent weeks, makes it clear that the Fed has now moved from a primary policy focus of reducing inflation to balancing the goals of both price stability and maximum employment. Raising the goal of maximum employment up with inflation means that the Fed is now in position to lower the fed funds rate. However, the FOMC’s statement also noted (consistent with its commentary in May and June):

The Committee does not expect it will be appropriate to reduce the target range until it has gained greater confidence that inflation is moving sustainably toward 2 percent.

This wording is a reminder that the Fed remains data-dependent. Thus, while a reduction for the federal funds rate is in view, the timing will be data-dependent on forthcoming inflation and labor market estimates. Also keep in mind, inflation does not need to be reduced to a 2% growth rate for the Fed to cut. Rather, it just needs to be on the path to reaching that goal (likely in late 2025 or early 2026).

When will the Fed cut? If the incoming inflation yield no upside surprises, a rate cut in September now appears possible, if not likely. However, the NAHB forecast remains for rate cuts to begin in December. This is a conservative outlook given the upside surprise to inflation at the start of the year and the possibility of a disappointing inflation report before the Fed’s September meeting. Fed officials have repeatedly warned that they would prefer to cut somewhat too late, rather than move too early and undermine long-term inflation expectations and central bank credibility. Nonetheless, a rate cut before the end of the calendar year seems all but certain.

This eventual easing of interest rates is coming later than most forecasters expected a year ago. This is due to an uptick in inflation at the start of 2024 and ongoing elevated measures of shelter inflation, which can only be tamed in the long-run by increases in housing supply.

Given the focus on inflation and shelter costs, higher interest rates are ironically preventing more construction by increasing the cost and limiting the availability of builder and developer loans necessary to construct new housing. With more than half of the overall gains for consumer inflation due to shelter over the last year, increasing attainable housing supply is a key anti-inflationary strategy, one that is complicated by higher short-term rates, which increase builder financing costs and hinder home construction activity. For these reasons, policy action in other areas, such as zoning reform and streamlining permitting, can be important ways for other elements of the government to fight inflation.

Discover more from Eye On Housing

Subscribe to get the latest posts sent to your email.


This article was originally published by a eyeonhousing.org . Read the Original article here. .
Pin It