Tag

macroeconomics

Browsing


Real gross domestic product (GDP) increased in 45 states and the District of Columbia in the third quarter of 2024 compared to the second quarter of 2024 according to the U.S. Bureau of Economic Analysis (BEA). Iowa reported no change during this time. The percent change in real GDP ranged from a 6.9 percent increase at an annual rate in Arkansas to a 2.3 percent decline in North Dakota.

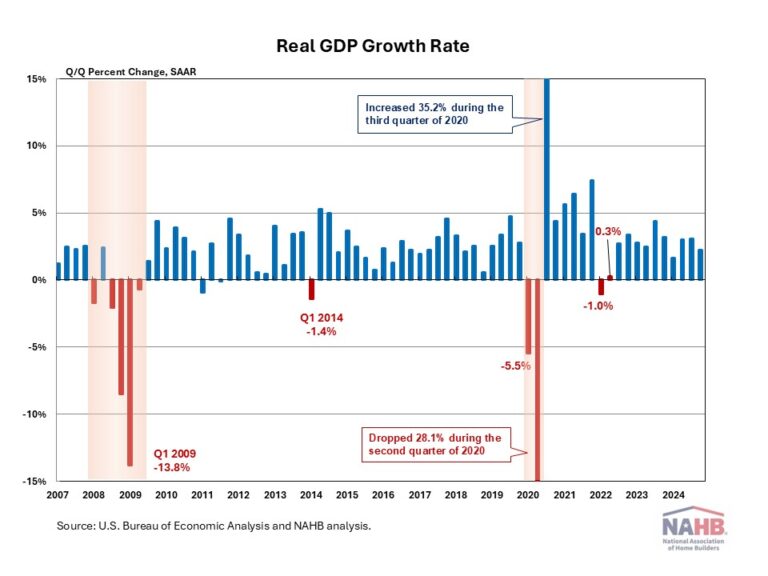
Nationwide, growth in real GDP (measured on a seasonally adjusted annual rate basis) increased 3.1 percent in the third quarter of 2024, which is roughly the same as the second quarter level of 3.0 percent. Retail trade, health care and social assistance, and information were the leading contributors to the increase in real GDP across the country.

Regionally, real GDP growth increased in all eight regions between the second and the third quarter. The percent change in real GDP ranged from a 3.9 percent increase in the Southwest region (Arizona, New Mexico, Oklahoma, and Texas) to a 1.4 percent increase in the Plains region (Iowa, Kansas, Minnesota, Missouri, Nebraska, North Dakota, and South Dakota).

At the state level, Arkansas posted the highest GDP growth rate (6.9 percent) followed by Alabama (6.0 percent) and Mississippi (5.1 percent). On the other hand, three out of the seven states that makes up and Plains region, South Dakota (-0.8 percent), Nebraska (-1.4 percent), and North Dakota (-2.3 percent) along with Montana (-0.1 percent) posted an economic contraction in the third quarter of 2024.

The agriculture, forestry, fishing, and hunting industry increased in 25 states, was the leading contributor to growth in five states including Arkansas, Alabama, and Mississippi, the states with the largest increases in real GDP. In contrast, this industry was the leading offset to growth in 14 states including North Dakota, Nebraska, South Dakota, and Montana, the only states with declines in real GDP.

Discover more from Eye On Housing

Subscribe to get the latest posts sent to your email.


This article was originally published by a eyeonhousing.org . Read the Original article here. .

State & local tax revenue from property taxes paid reached $203.9 billion in the third quarter of 2024 (seasonally adjusted), according to the Census Bureau’s quarterly summary of state & local tax revenue. This marks a 2.8% increase from the revised $198.3 billion in the second quarter of 2024 and also marks the first quarter where property tax revenue topped $200 billion for state & local governments. Year-to-date, total state & local tax revenue was $1.56 trillion. This was 5.4% higher than the $1.48 trillion through the first three quarters of 2023.

The 2.8% quarterly increase in the property tax revenue was up from the previous quarter of 2.6%. Property tax revenues have grown at an average rate of 0.87% from 2009 to 2024.  This quarter marks the fourth consecutive quarter of above average growth.

Year-over-year, property tax revenue was 11.2% higher, a notable uptick from the 8.0% increase in the previous quarter. The average year-over-year growth rate from 2010 to 2024 is 3.60%. The last time yearly growth was below the average was the 1.1% decline in the third quarter of 2022.

Of total state & local collections in the third quarter, property tax made up the largest share at 38.2%, followed by sales tax at 27.3%. Individual income tax represented 26.0% of tax revenue, while corporate tax made up the remaining 8.5% for state & local revenues in the third quarter of 2024.

Over the past decade, state & local governments have been most reliant on property taxes for revenue. Sales tax has had an increased importance since 2023, when the share of sales tax of total revenues grew above individual income tax shares. See the chart below for the trends of total state & local government tax revenue shares.

Discover more from Eye On Housing

Subscribe to get the latest posts sent to your email.


This article was originally published by a eyeonhousing.org . Read the Original article here. .


The U.S. trade deficit in goods was at $112 billion in the month of October, according to the Census Bureau’s Foreign Trade data. Compared to last year, the level has increased 13.3%, rising from $99 billion.

Total goods imported was valued at $289 billion while the exports were valued at $177 billion in October. The import value represents the price paid for goods at the foreign port, excluding U.S. import duties, freight, insurance, and other charges. This value includes all merchandise, whether it is sold directly into the U.S. market or re-exported to another country. The export value represents the selling price of the goods plus inland/domestic freight, insurance and other charges at the U.S. port, excluding post-export charges.

As shown above, the U.S. trade deficit in goods has continued to climb higher since 2014 when it was $59 billion. Focusing on October 2024 data, the Census reports that of the 229 countries the U.S. traded goods in October, the U.S. had a trade deficit with 102 (meaning the U.S. imported more than exported to specific country). The countries that the U.S. had the largest trade deficit with in October were China ($28.0 billion), Mexico ($16.4 billion) and Vietnam ($11.6 billion). Shown below are five countries that have the highest average trade deficit with the U.S. since 2014.

Tracking the dashed trend lines above, the trade deficit with China has moved lower since peaking in 2018. Despite this recent decline, the trade deficit between China and U.S. remains significantly higher than any other country. In October, it was almost double the size of the deficit with Mexico, the second largest. The trade deficit with Mexico and the U.S. has trended upward as trade policy in the U.S. has shifted away from China. The total value of imports from Mexico in October was $45.5 billion, while imports from China stood at $41.5 billion. There also exists a notable increase in the trade deficit with Vietnam. In January 2014, the level stood at only $2 billion, well below other main exporters to the U.S. like Japan and Germany. This level has only continued to rise, caused again by a shift away from trade with China.

The top countries in October that the U.S. held a trade surplus with were Netherlands ($4.5 billion), United Kingdom ($1.7 billion) and the Hong Kong ($1.6 billion). While these were the highest surplus counties in October, the values are substantially lower than the trade deficit levels shown above. The graph below displays five countries that the U.S. has the largest average trade surplus with over the past 10 years. The surplus with the Netherlands has jumped far higher than any nation since 2022. Trade with Hong Kong historically had the highest until 2018-2019.

While the U.S. has consistently held a trade deficit since 2014, the composition of the deficit is continuing to undergo a transition. Despite a U.S. trade policy that is shifting away from China, the trade deficit with China remains by far the largest the U.S. has with any country. Expansion of trade with Mexico and Vietnam has a seen a rise in trade deficits with both nations, as the U.S. attempts to decouple with China. The data shows that both economies are still very connected, with the U.S. remaining a top destination of exportation from China and U.S. consumers needs for goods from China.

Discover more from Eye On Housing

Subscribe to get the latest posts sent to your email.


This article was originally published by a eyeonhousing.org . Read the Original article here. .

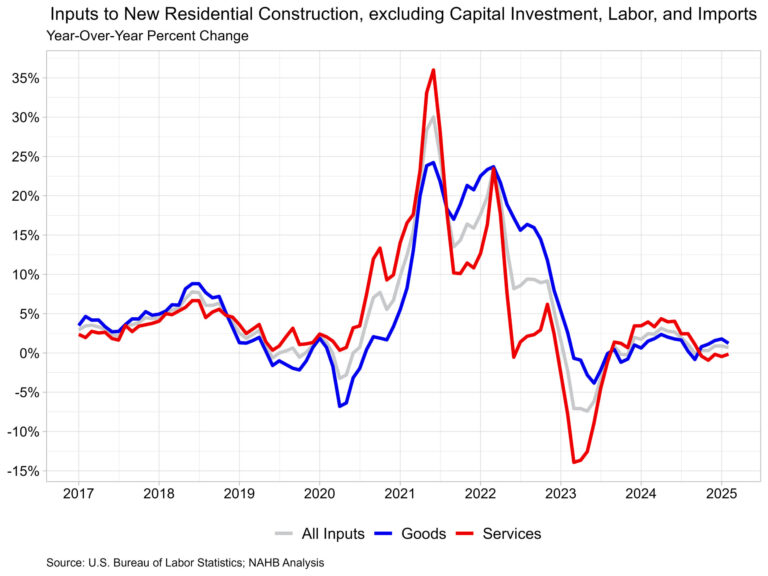
Prices for inputs to new residential construction—excluding capital investment, labor, and imports—were unchanged in November according to the most recent Producer Price Index (PPI) report published by the U.S. Bureau of Labor Statistics. Compared to a year ago, this index was up 0.7% in November after rising 0.3% in October.

The inputs to the new residential construction price index can be broken into two components­—one for goods and another for services. The goods component increased 1.2% over the year, while services decreased 0.3%. For comparison, the total final demand index increased 3.0% over the year in November, with final demand with respect to goods up 1.1% and final demand for services up 3.9% over the year.

Goods

The goods component has a larger importance to the total residential construction inputs price index, representing around 60%. The price of input goods to new residential construction was unchanged in November from October. The input goods to residential construction index can be further broken down into two separate components, one measuring energy inputs with the other measuring goods less energy inputs. The latter of these two components simply represents building materials used in residential construction, which makes up around 93% of the goods index.

Prices for inputs to residential construction, goods less energy, were up 2.3% in November compared to a year ago. This year-over-year increase was larger than in October (2.0%) and was the largest year-over-year increase since June earlier this year. The growth rate in November 2023 was 1.2%. The index for inputs to residential construction for energy fell 10.9% year-over-year in November, the fourth straight yearly decline in input energy prices.  

The graph below focuses on the data since the start of 2023 for residential goods inputs. Energy prices have continued to fall over the past year, with only two periods of growth in 2024.

At the individual commodity level, excluding energy, the five commodities with the highest importance for building materials to the new residential construction index were as follows: ready-mix concrete, general millwork, paving mixtures/ blocks, sheet metal products, and wood office furniture/store fixtures. Across these commodities, there was price growth across the board compared to last year. Ready-mix concrete was up 3.9%, wood office furniture/store fixtures up 3.4%, general millwork up 2.8%, paving mixtures/blocks up 1.6% and sheet metal products up 0.5%. Unsurprisingly, given how energy prices have trended this year, the input commodity that had the largest fall in price over the year was No. 2 diesel, which was down 20.6%.

Among lumber and wood products, the commodities with the highest importance to new residential construction were general millwork, prefabricated structural members, softwood veneer/plywood, softwood lumber (not edge worked) and hardwood veneer/plywood. The input commodity in residential construction that had the highest year-over-year percent change (across all input goods) in November was softwood lumber (not edge worked), which was 13.7% higher than November 2023. This is of particular note because none of the other top wood commodities had a year-over-year change above 3% in November. Lumber supplies have been driving prices higher over the past month as the sawmill industry continues to adjust to the mill closures that occurred earlier this year. Higher lumber demand as residential construction rebounds due to lower interest rates is likely to continue to increase lumber prices.

Services

Prices of inputs to residential construction for services, were unchanged in November from October. The price index for service inputs to residential construction can be broken out into three separate components: a trade services component, a transportation and warehousing services component, and a services excluding trade, transportation and warehousing component. The most significant component is trade services (around 60%), followed by services less trade, transportation and warehousing (around 29%), and finally transportation and warehousing services (around 11%). The largest component, trade services, compared to last year was down 1.2% in November after declining 1.5% in October.

Discover more from Eye On Housing

Subscribe to get the latest posts sent to your email.


This article was originally published by a eyeonhousing.org . Read the Original article here. .

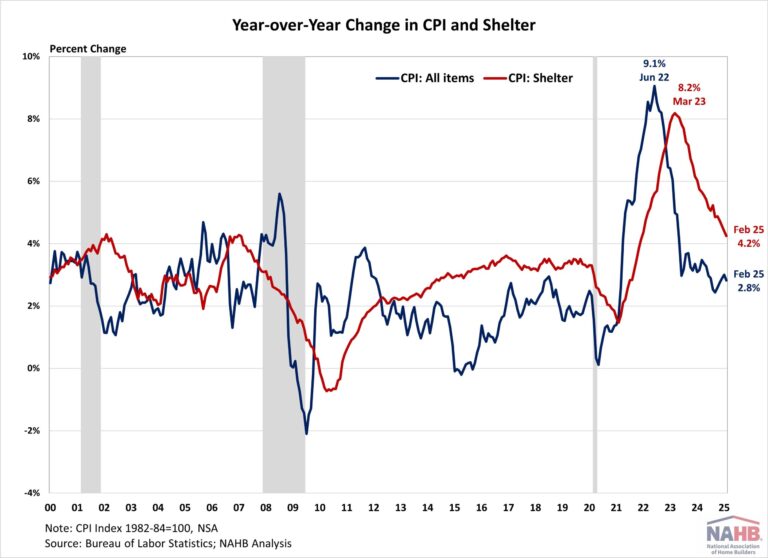
Inflation picked up to 2.7% in November, while matching expectations, the last mile to the Fed’s 2% target proves to be the most challenging. Shelter costs continued to be the main driver of inflation, contributing nearly 40% of the monthly increase. However, the year-over-year change in the shelter index remained below 5% for a third straight month and posted its lowest annual gain since February 2022, suggesting moderation in housing inflation.

While the Fed’s interest rate cuts could help ease some pressure on the housing market, its ability to address rising housing costs is limited, as these increases are driven by a lack of affordable supply and increasing development costs. In fact, tight monetary policy hurts housing supply because it increases the cost of AD&C financing. This can be seen on the graph below, as shelter costs continue to rise at an elevated pace despite Fed policy tightening. Additional housing supply is the primary solution to tame housing inflation.

Furthermore, the election result has put inflation back in the spotlight and added some downside risks to the economic outlook. Proposed tax cuts and tariffs could increase inflationary pressures, suggesting a more gradual easing cycle with a slightly higher terminal federal funds rate. Given the housing market’s sensitivity to interest rates, this could extend affordability crisis and constrain housing supply as builders continue to grapple with lingering supply chain challenges.

During the past twelve months, on a non-seasonally adjusted basis, the Consumer Price Index (CPI) rose by 2.7% in November, according to the Bureau of Labor Statistics’ report. This followed a 2.6% year-over-year increase in October. Excluding the volatile food and energy components, the “core” CPI increased by 3.3% over the past twelve months, the same increase as in the previous two months. The component index of food rose by 2.4%, while the energy component index fell by 3.2%.

On a monthly basis, the CPI rose by 0.3% in November on a seasonally adjusted basis, after a 0.2% increase in October. The “core” CPI increased by 0.3% in November, the same increase as in the past three months.

The price index for a broad set of energy sources rose by 0.2% in November, with declines in electricity (-0.4%) offset by increases in gasoline (+0.6%), natural gas (+1.0%) and fuel oil (+0.6%). Meanwhile, the food index rose 0.4%, after a 0.2% increase in October. The index for food away from home increased by 0.3% and the index for food at home rose by 0.5%.

The index for shelter (+0.3%) was the largest contributor to the monthly increase in all items index, accounting for nearly 40% of the total increase. Other top contributors that rose in November include indexes for used cars and trucks (+2.0%), household furnishings and operations (+0.6%), medical care (+0.3%) and new vehicles (+0.6%). Meanwhile, the index for communication (-1.0%) was among the few major indexes that decreased over the month.

The index for shelter makes up more than 40% of the “core” CPI, rose by 0.3% in November after a 0.4% in October. Both indexes for owners’ equivalent rent (OER) and rent of primary residence (RPR) increased by 0.2% over the month. For the rent index, it was the smallest monthly increase since April 2021 and July 2021. Despite the moderation, shelter costs remained the largest contributors to headline inflation. 

NAHB constructs a “real” rent index to indicate whether inflation in rents is faster or slower than overall inflation. It provides insight into the supply and demand conditions for rental housing. When inflation in rents is rising faster than overall inflation, the real rent index rises and vice versa. The real rent index is calculated by dividing the price index for rent by the core CPI (to exclude the volatile food and energy components).

In November, the Real Rent Index fell by 0.1%, marking its first negative reading since December 2021. Over the first eleven months of 2024, the monthly growth rate of the Real Rent Index averaged 0.1%, slower than the average of 0.2% in 2023.

Discover more from Eye On Housing

Subscribe to get the latest posts sent to your email.


This article was originally published by a eyeonhousing.org . Read the Original article here. .

Inflation picked up again in October, showing the last mile to the 2% target will be the hardest. Shelter costs remained the main driver of inflation, accounting for over 65% of the 12-month increase in the all items less food and energy index. However, the year-over-year change in the shelter index has been below 5% for the second consecutive month, signaling some moderation in housing inflation.

While the Fed’s interest rate cuts could help ease some pressure on the housing market, its ability to address rising housing costs is limited, as these increases are driven by a lack of affordable supply and increasing development costs. In fact, tight monetary policy hurts housing supply because it increases the cost of AD&C financing. This can be seen on the graph below, as shelter costs continue to rise at an elevated pace despite Fed policy tightening. Additional housing supply is the primary solution to tame housing inflation.

Furthermore, the 2024 election result has put inflation back in the spotlight and added some downside risks to the economic outlook. Proposed tax cuts and tariffs could increase inflationary pressures, suggesting a more gradual easing cycle with a slightly higher terminal federal funds rate. Given the housing market’s sensitivity to interest rates, this could extend affordability crisis and constrain housing supply as builders continue to grapple with lingering supply chain challenges.

The Bureau of Labor Statistics reported that the Consumer Price Index (CPI) rose by 0.2% in October on a seasonally adjusted basis, the same increase seen over the previous three months. Excluding the volatile food and energy components, the “core” CPI increased by 0.3% in October, the same increase as in August and September.

The price index for a broad set of energy sources remained unchanged in October, with declines in gasoline (-0.9%) and fuel oil (-4.6%) offset by increases in electricity (+1.2%) and natural gas (+0.3%). Meanwhile, the food index rose 0.2%, after a 0.4% increase in September. The index for food away from home increased by 0.2% and the index for food at home rose by 0.1%.

The index for shelter (+0.4%) was the largest contributor to the monthly increase in all items index, accounting for over 50% of the total increase. Other top contributors that rose in October include indexes for used cars and trucks (+2.7%), airline fares (+3.2%), medical care (+0.3%) and recreation (+0.4%). Meanwhile, the top contributors that experienced a decline include indexes for apparel (-1.5%), communication (-0.6%) and household furnishings and operations (-0.1%).

The index for shelter makes up more than 40% of the “core” CPI. The index saw a 0.4% rise in October, following an increase of 0.2% in September. The indexes for owners’ equivalent rent (OER) and rent of primary residence (RPR) increased by 0.4% and 0.3% over the month. These gains have been the largest contributors to headline inflation in recent months. 

During the past twelve months, on a non-seasonally adjusted basis, the CPI rose by 2.6% in October, following a 2.4% increase in September. The “core” CPI increased by 3.3% over the past twelve months, the same increase as in September. The food index rose by 2.1%, while the energy index fell by 4.9%.

NAHB constructs a “real” rent index to indicate whether inflation in rents is faster or slower than overall inflation. It provides insight into the supply and demand conditions for rental housing. When inflation in rents is rising faster than overall inflation, the real rent index rises and vice versa. The real rent index is calculated by dividing the price index for rent by the core CPI (to exclude the volatile food and energy components).

In October, the Real Rent Index remained unchanged for the second consecutive month. Over the first ten months of 2024, the monthly growth rate of the Real Rent Index averaged 0.1%, slower than the average of 0.2% in 2023.

Discover more from Eye On Housing

Subscribe to get the latest posts sent to your email.


This article was originally published by a eyeonhousing.org . Read the Original article here. .

Housing’s share of the economy fell 0.1 percentage points to 16.2% in the third quarter of 2024 according to the advance estimate of GDP produced by the Bureau of Economic Analysis. The share was revised upwards for both the first and second quarter of 2024 to 16.3%.

The more cyclical home building and remodeling component – residential fixed investment (RFI) – was 4.0% of GDP, slightly lower than the 4.1% in the second quarter. RFI subtracted 21 basis points from the headline GDP growth rate in the third quarter of 2024, the second consecutive quarter where RFI negatively contributed to GDP growth.

In the third quarter, housing services added 18 basis points (bps) to GDP growth while the share grew to 12.2% of GDP. Among household expenditures for services, housing services contributions were the third-highest contributor to headline GDP growth behind health care (30 bps) and food service and accommodations (19 bps), while above other services (12 bps) and transportation services (10 bps). The graph above stacks the nominal shares for housing services and RFI, resulting in housing’s total share of the economy.

Overall GDP increased at a 2.8% annual rate, down from a 3.0% increase in the second quarter of 2024, but up from a 1.6% increase in the first quarter of 2024.

Housing-related activities contribute to GDP in two basic ways:

The first is through residential fixed investment (RFI). RFI is effectively the measure of home building, multifamily development, and remodeling contributions to GDP. RFI consists of two specific types of investment, the first is residential structures. This investment includes construction of new single-family and multifamily structures, residential remodeling, production of manufactured homes, brokers’ fees and some types of equipment that are built into the structure. RFI’s second component, residential equipment, includes investment such as furniture or household appliances that are purchased by landlords for rental to tenants.

For the third quarter, RFI was 4.0% of the economy, recording a $1.175 trillion seasonally adjusted annual pace. RFI shrank 5.1% at an annual rate in the third quarter after falling 2.8% in the second. Among the two types of RFI, real investment in residential structures fell 5.3% while for residential equipment it rose 2.2%. Investment in residential structures stood at a seasonally adjusted annual pace of $1.153 trillion, making its share of residential investment far greater than that of residential equipment, which was at seasonally adjusted annual pace of $21.5 billion.

The second impact of housing on GDP is the measure of housing services. Similar as we saw with RFI, housing services consumption can be broken out into two components. The first component, housing, includes gross rents paid by renters, owners’ imputed rent (an estimate of how much it would cost to rent owner-occupied units), rental value of farm dwellings and group housing. The inclusion of owners’ imputed rent is necessary from a national income accounting approach, because without this measure, increases in homeownership would result in declines in GDP. The second component, household utilities, is composed of consumption expenditures on water supply, sanitation, electricity, and gas.

For the third quarter, housing services represented 12.2% of the economy or $3.581 trillion on a seasonally adjusted annual basis. Housing services grew 1.5% at an annual rate in the third quarter. Real personal consumption expenditures for housing grew 1.4% while household utilities expenditures grew 1.7%. At current dollar expenditure level, housing expenditures was $3.124 trillion and household utility expenditures stood at $456.6 billion in seasonally adjusted annual rates.

Housing service growth is much less volatile when compared to RFI due to the cyclical nature of RFI. Historically, RFI has averaged roughly 5% of GDP while housing services have averaged between 12% and 13%, for a combined 17% to 18% of GDP. These shares tend to vary over the business cycle. However, the housing share of GDP lagged during the post-Great Recession period due to underbuilding, particularly for the single-family sector.

Discover more from Eye On Housing

Subscribe to get the latest posts sent to your email.


This article was originally published by a eyeonhousing.org . Read the Original article here. .


The U.S. economy grew at a solid pace in the third quarter of 2023, boosted by strong consumer spending and government spending. According to the “advance” estimate released by the Bureau of Economic Analysis (BEA), real gross domestic product (GDP) expanded at an annual rate of 2.8% in the third quarter of 2024, following a 3.0% gain in the second quarter of 2024. This quarter’s growth matched NAHB’s forecast.

Furthermore, the data from the GDP report suggests that inflation is cooling. The GDP price index rose 1.8% for the third quarter, down from a 2.5% increase in the second quarter of 2024. The Personal Consumption Expenditures Price (PCE) Index, which measures inflation (or deflation) across various consumer expenses and reflects changes in consumer behavior, rose 1.5% in the third quarter. This is down from a 2.5% increase in the second quarter of 2024.

This quarter’s increase in real GDP primarily reflected increases in consumer spending, exports, and federal government spending.

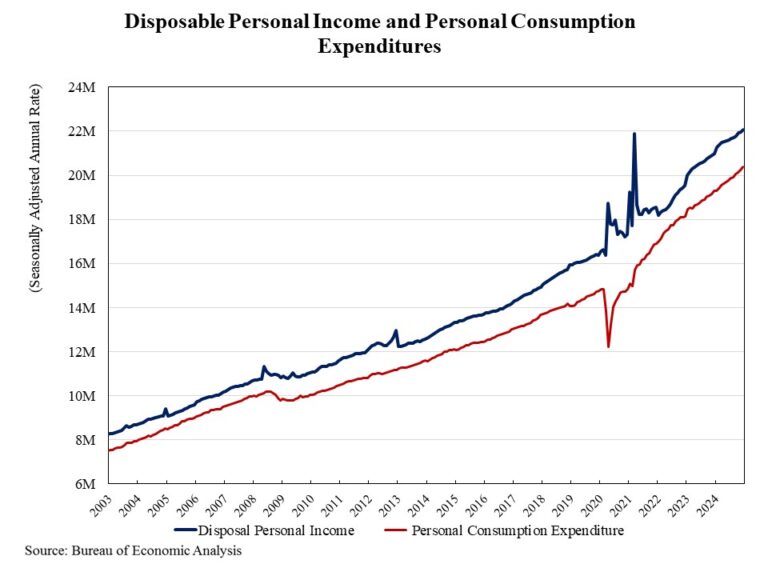
Consumer spending, the backbone of the U.S. economy, rose at an annual rate of 3.7% in the third quarter. It marks the highest annual growth rate since the first quarter of 2023. The increase in consumer spending reflected increases in both goods and services. While goods spending increased at a 6.0% annual rate, expenditures for services increased 2.6% at an annual rate.

The U.S. trade deficit increased in the third quarter, as imports increased more than exports. A wider trade deficit shaved 0.56 percentage points off GDP. Imports, which are a subtraction in the calculation of GDP, increased 11.2%, while exports rose 8.9%.

In the third quarter, federal government spending increased 9.7%, led by a 14.9% surge in national defense outlays.

Nonresidential fixed investment increased 3.3% in the third quarter. Increases in equipment and intellectual property products were partly offset by a decrease in structures. Meanwhile, residential fixed investment decreased 5.1% in the third quarter and dragged down the contribution to real GDP by 0.21 percentage points. Within residential fixed investment, single-family structures declined 16.1% at an annual rate, multifamily structures decreased 8.7%, while improvements rose 13.9%.

For the common BEA terms and definitions, please access bea.gov/Help/Glossary.

Discover more from Eye On Housing

Subscribe to get the latest posts sent to your email.


This article was originally published by a eyeonhousing.org . Read the Original article here. .


Inflation continued to ease in September and remained at a 3-year low as shelter costs continued to moderate. Shelter costs, the main driver of inflation since early 2023, saw their annual growth rate fall below 5% for the first time since February 2022. With the Fed beginning its easing cycle with a half-point cut last month, lower interest rates could help ease some pressure on the housing market.

Though shelter remains the primary driver of inflation, the Fed has limited ability to address rising housing costs, as these increases are driven by a lack of affordable supply and increasing development costs. Additional housing supply is the primary solution to tame housing inflation. However, the Fed’s tools for promoting housing supply are constrained.

In fact, tight monetary policy hurts housing supply because it increases the cost of AD&C financing. This can be seen on the graph below, as shelter costs continue to rise at an elevated pace despite Fed policy tightening. Nonetheless, with the Fed shifting to a more dovish stance, along with additional apartment supply supported by real-time private data, NAHB expects to see shelter costs to continue decline in the coming months.

The Bureau of Labor Statistics reported that the Consumer Price Index (CPI) rose by 0.2% in September on a seasonally adjusted basis, the same increase as in July and August. Excluding the volatile food and energy components, the “core” CPI increased by 0.3% in September, the same increase as in August.

The price index for a broad set of energy sources fell by 1.9% in September, with declines in gasoline (-4.1%) and fuel oil (-6.0%) offset by increases in electricity (+0.7%) and natural gas (+0.7%). Meanwhile, the food index rose 0.4%, after a 0.1% increase in August. The index for food away from home increased by 0.3% and the index for food at home rose by 0.4%.

The index for shelter (+0.2%) and food (+0.4%) were the largest contributors to the monthly increase in all items index, accounting for over 75% of the total increase. Other top contributors that rose in September include indexes for motor vehicle insurance (+1.2%), medical care (+0.4%), apparel (+1.1%) and airline fares (+3.2%). Meanwhile, the top contributors that experienced a decline include indexes for recreation (-0.4%) and communication (-0.6%).

The index for shelter makes up more than 40% of the “core” CPI. The index saw a 0.2% rise in September, following an increase of 0.5% in August. Both the indexes for owners’ equivalent rent (OER) and rent of primary residence (RPR) increased by 0.3% over the month. These gains have been the largest contributors to headline inflation in recent months. 

During the past twelve months, on a non-seasonally adjusted basis, the CPI rose by 2.4% in September, following a 2.5% increase in August. This was the slowest annual gain since February 2021. The “core” CPI increased by 3.3% over the past twelve months, following a 3.2% increase in August. The food index rose by 2.3%, while the energy index fell by 6.8%.

NAHB constructs a “real” rent index to indicate whether inflation in rents is faster or slower than overall inflation. It provides insight into the supply and demand conditions for rental housing. When inflation in rents is rising faster than overall inflation, the real rent index rises and vice versa. The real rent index is calculated by dividing the price index for rent by the core CPI (to exclude the volatile food and energy components).

In September, the Real Rent Index remained unchanged after a 0.1% increase in August. Over the first nine months of 2024, the monthly growth rate of the Real Rent Index averaged 0.1%, slower than the average of 0.2% in 2023.

Discover more from Eye On Housing

Subscribe to get the latest posts sent to your email.


This article was originally published by a eyeonhousing.org . Read the Original article here. .

Real gross domestic product (GDP) increased in 49 states and the District of Columbia in the second quarter of 2024 compared to the last quarter of 2023 according to the U.S. Bureau of Economic Analysis (BEA). Alaska reported an economic contraction during this time. The percent change in real GDP ranged from a 5.9 percent increase at an annual rate in Idaho to a 1.1 percent decline in Alaska.

Nationwide, growth in real GDP (measured on a seasonally adjusted annual rate basis) increased 3.0 percent in the second quarter of 2024, which is higher than the first quarter level of 1.6 percent. Nondurable-goods manufacturing; finance and insurance; and health care and social assistance were the leading contributors to the increase in real GDP across the country.

Regionally, real GDP growth increased in all eight regions between the first and the second quarter. The percent change in real GDP ranged from a 3.7 percent increase in the Rocky Mountain region (Colorado, Idaho, Montana, Utah, and Wyoming) to a 2.2 percent increase in the New England region (Connecticut, Maine, Massachusetts, New Hampshire, Rhode Island, and Vermont).

At the state level, Idaho posted the highest GDP growth rate (5.9 percent) followed by Kansas (5.6 percent) and Nebraska (5.3 percent). On the other hand, Alaska posted an economic contraction in the second quarter of 2024. The agriculture, forestry, fishing, and hunting industry was the leading contributor to growth in 11 states including Idaho, Kansas, Nebraska, and the states with the highest increases in real GDP, respectively. Mining, which declined in 33 states, was the leading contributor to the decrease in real GDP in Alaska, the only state with a decline in real GDP.

Discover more from Eye On Housing

Subscribe to get the latest posts sent to your email.


This article was originally published by a eyeonhousing.org . Read the Original article here. .
Pin It