Tag

macroeconomics

Browsing


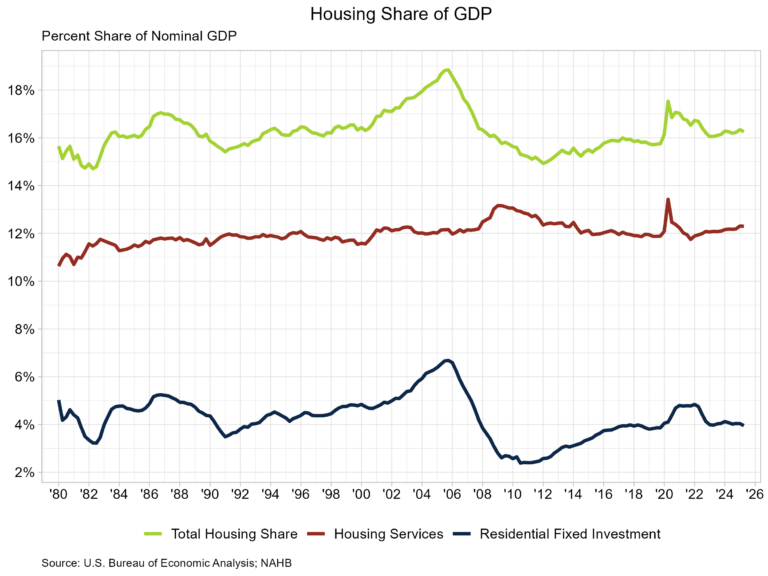
Housing’s share of the economy registered 16.3% in the second quarter of 2025, according to the advance estimate of GDP produced by the Bureau of Economic Analysis. This reading is unchanged from a revised level of 16.3% in the first quarter and is the same as the share one year ago.

The more cyclical home building and remodeling component – residential fixed investment (RFI) – was 4.0% of GDP, level from 4.0% in the previous quarter. The second component – housing services – was 12.3% of GDP, also unchanged from the previous quarter. The graph below plots the nominal shares for housing services and RFI along with housing’s total share of GDP.  

Housing service growth is much less volatile when compared to RFI due to the cyclical nature of RFI. Historically, RFI has averaged roughly 5% of GDP, while housing services have averaged between 12% and 13%, for a combined 17% to 18% of GDP. These shares tend to vary over the business cycle. However, the housing share of GDP lagged during the post-Great Recession period due to underbuilding, particularly for the single-family sector.

In the second quarter, RFI subtracted 19 basis points to the headline GDP growth rate, marking the second straight quarter of negative contributions. RFI was 4.0% of the economy, recording a $1.2 trillion seasonally adjusted annual pace. Among the two segments of RFI, private investment in structures shrunk 4.5%, while residential equipment fell 7.9%.

Breaking down the components of residential structures, single-family RFI fell 12.9%, while multifamily RFI fell 1.3%. RFI for multifamily structures has contracted for eight consecutive quarters. Permanent site structure RFI, which is made up of single-family and multifamily RFI, fell 10.2%. The other structures RFI category rose 0.6% in the second quarter.

The second impact of housing on GDP is the measure of housing services. Similar to the RFI, housing services consumption can be broken out into two components. The first component, housing, includes gross rents paid by renters, owners’ imputed rent (an estimate of how much it would cost to rent owner-occupied units), rental value of farm dwellings, and group housing. The inclusion of owners’ imputed rent is necessary from a national income accounting approach, because without this measure, increases in homeownership would result in declines in GDP. The second component, household utilities, is composed of consumption expenditures on water supply, sanitation, electricity, and gas.

For the second quarter, housing services represented 12.3% of the economy or $3.7 trillion on a seasonally adjusted annual basis. Housing services expenditures fell 0.2% at an annual rate in the second quarter. Real personal consumption expenditures for housing grew 1.2%, while household utilities expenditures fell 9.2%.

Personal consumption expenditures (PCE) for housing services are the largest component of PCE, making up 18.1% in the second quarter. The second largest component of PCE is health care services, at 17.0%. Expenditures on services totaled $14.2 trillion on a seasonally adjusted annual basis in the second quarter, more than double expenditures on goods ($6.4 trillion).

Discover more from Eye On Housing

Subscribe to get the latest posts sent to your email.


This article was originally published by a eyeonhousing.org . Read the Original article here. .

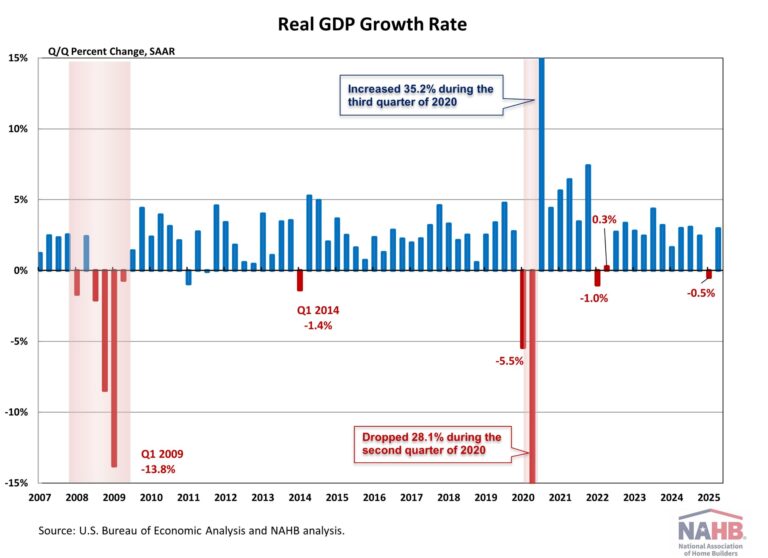
At the conclusion of its July meeting, the Federal Reserve’s monetary policy committee once again held the federal funds rate constant at a top rate of 4.5%. However, two members of the committee dissented from the decision (Fed Board Governors Waller and Bowman), the largest number of dissenting votes since 1993.

Moreover, some economic data – including a slowing housing market – are pointing to a need to resume normalizing the federal funds rate from its current, restrictive stance. In particular, Chair Powell noted in his press conference that the “housing market remains weak” and policy is “modestly restrictive.” NAHB is forecasting two rate reductions before the end of the year, including one at the next Fed meeting in September. President Trump has made it clear that he believes the central bank needs to cut again. All that said, except for the presence of dissenting votes in today’s decision, the Fed’s statement did not appear to be more dovish than those of prior months, which is indicative that the Fed remains data dependent.

While the Fed pointed to moderating growth, including a soft first quarter, “elevated uncertainty” about the outlook continues to be cited by the central bank. It is the case that evolving tariff policy, and trade negotiations in general, represent an uncertainty risk (although some, like Governor Waller, argue that tariff effects will represent a one-time effect on prices, not a source of ongoing inflation).

However, the combination of a quick move for cuts at the end of 2024 and the subsequent long, ongoing pause in 2025 is itself a source of uncertainty, particularly for businesses in sectors like residential construction whose financing costs are tied to short-term lending rates controlled by the Federal Reserve. The continued decline for service sector inflation points to moderating overall inflation, which when combined with softening job openings data and growing specifics about trade policy, provides justification for a resumption of continued monetary policy easing.

While a reduction in the federal funds rate would help the supply-side of the housing market via builder financing costs, long-term rates like mortgage interest rates are determined by investors and the bond market, not the Fed. So, while the economy would benefit from a resumption of monetary policy easing, impactful reductions for long-term interest rates depends on declines for inflation expectations, improvement of the government’s deficit outlook, and gains for productivity for the economy.

Discover more from Eye On Housing

Subscribe to get the latest posts sent to your email.


This article was originally published by a eyeonhousing.org . Read the Original article here. .

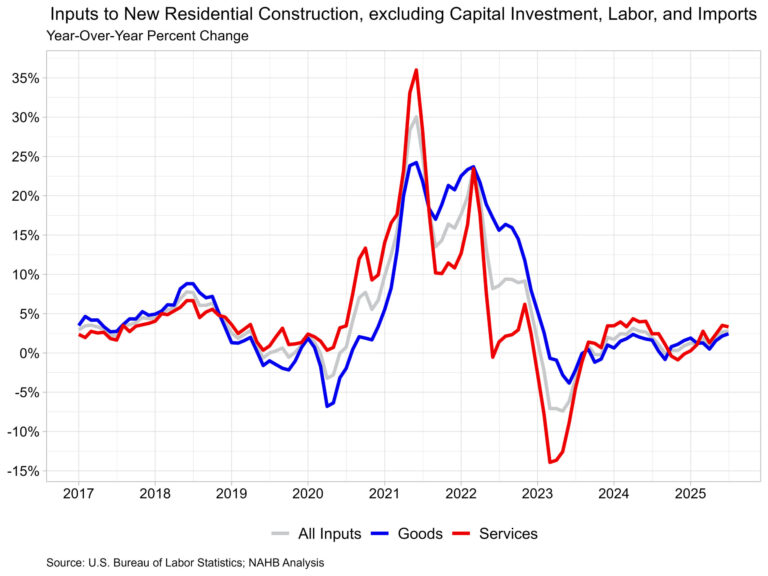
Residential building material prices rose in June, driven primarily by higher construction machinery and equipment part prices. Metal commodities also experienced significant increases, following recently implemented tariffs on steel and aluminum.  Meanwhile, price growth for services used in construction continues to outpace both domestic and imported goods. 

Prices for inputs to new residential construction—excluding capital investment, labor, and imports—rose 0.7% in June, following a (revised) flat change in May. These figures are taken from the most recent Producer Price Index (PPI) report published by U.S. Bureau of Labor Statistics. The PPI measures prices that domestic producers receive for their goods and services; this differs from the Consumer Price Index which measures what consumers pay and includes both domestic products as well as imports.  

The inputs to the New Residential Construction Price Index grew 2.6% from June of last year. The index can be broken into two components—the goods component increased 2.1% over the year, while services increased 3.3%. For comparison, the total final demand index, which measures all goods and services across the economy, increased 2.3% over the year, with final demand with respect to goods up 1.7% and final demand for services up 2.7%. 

Input Goods

The goods component has a larger importance to the total residential construction inputs price index, representing around 60%. On a monthly basis, the price of input goods to new residential construction was up 0.2% in June.  

The input goods to residential construction index can be further broken down into two separate components, one measuring energy inputs with the other measuring remaining goods. The latter of these two components simply represents building materials used in residential construction, which makes up around 93% of the goods index.  

Energy input prices were up 0.9% between May and June but were 7.4% lower than one year ago. Building material prices were up 0.1% between May and June and up 2.9% compared to one year ago.  

Tariffs on building materials do not directly show up in the PPI data because the PPI measures prices for domestically produced goods and services. In fact, tariffs and taxes are explicitly excluded from the PPI. Despite this, price changes in reaction to tariffs are included in the PPI, meaning price increases to pass on increased costs of materials will show up in this pricing data. Announced tariffs in recent months have resulted in material increases across a few different goods, specifically certain metal products and equipment.

In June, the largest year-over-year price increase was for construction machinery and equipment parts, reporting a 24.2% increase over the year. Meanwhile, metal molding and trim prices were up 15.1%, fabricated steel plate prices were up 13.6%, ornamental and architectural metal work prices were up 9.0%, and fabricated structural metal prices were up 9.0% compared to last year. Metal commodities have been the primary targets of tariffs, with 50% tariffs in effect on steel and aluminum products and a potential 50% tariff on copper products coming this August.

Input Services

Prices for service inputs to residential construction reported an increase of 1.5% in June. On a year-over-year basis, service input prices are up 3.3%. The price index for service inputs to residential construction can be broken out into three separate components: a trade services component, a transportation and warehousing services component, and a services excluding trade, transportation and warehousing component (other services).

The most significant component is trade services (around 60%), followed by other services (around 29%), and finally transportation and warehousing services (around 11%). The largest component, trade services, was up 4.7% from a year ago. The other services component was up 1.1% over the year. Lastly, prices for transportation and warehousing services advanced 2.1% compared to June of last year.

Inputs to New Construction Satellite Data

Within the PPI that BLS publishes, new experimental data was recently published regarding inputs to new construction. The data expands existing inputs to industry indexes by incorporating import prices with prices for domestically produced goods and services. With this additional data, users can track how industry input costs are changing among domestically produced products and imported products. This data focuses on new construction, but the complete dataset includes indices across numerous industries that can be on the BLS website.

New construction input prices are primarily influenced by domestically produced goods and services, with domestic products accounting for 90% of the weight of the industry index for new construction. Imported goods make up the remaining 10% of the index.  

The latest available data, for April 2025, showed that domestically produced goods have experienced faster price growth compared to imported goods used in new construction. On a year-over-year basis, the index for domestic goods increased 0.4%, while prices for imported goods fell 0.1% over the same period. Comparatively, service prices have risen more than good prices over the past year, rising 3.1% year-over-year. Across the three indexes, all inputs remain at higher levels compared to pre-pandemic prices.  

Discover more from Eye On Housing

Subscribe to get the latest posts sent to your email.


This article was originally published by a eyeonhousing.org . Read the Original article here. .
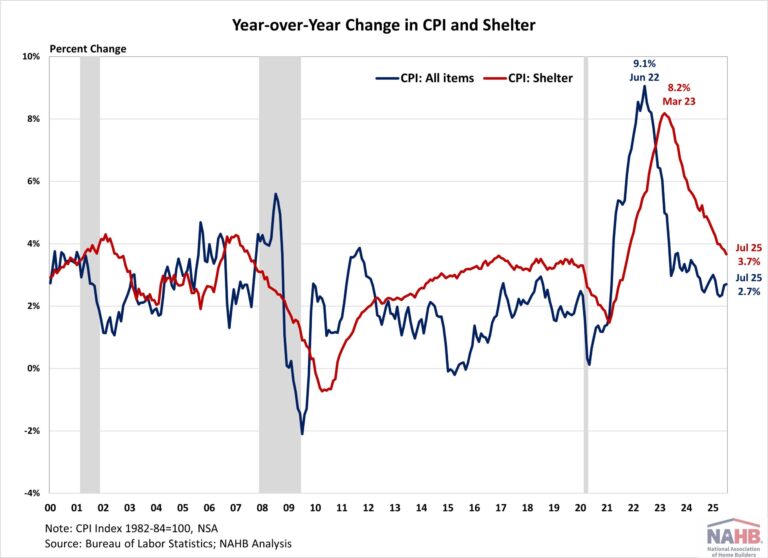

Inflation rose to a 4-month high in June as consumer prices began to reflect tariff policy. The Consumer Price Index increased from 2.4% in May to 2.7% in June year-over-year, according to the Bureau of Labor Statistics’ report. Despite the increase, core inflation came in softer than expected, suggesting full tariff impacts will likely push inflation even higher in the coming months. Meanwhile, housing inflation continued to show signs of cooling and matched the lowest level since November 2021.

During the past twelve months, on a non-seasonally adjusted basis, the Consumer Price Index rose by 2.7% in June, the highest since February 2025. Excluding the volatile food and energy components, the “core” CPI increased by 2.9% over the past twelve months. A large portion of the “core” CPI is the housing shelter index, which increased 3.8% over the year, the lowest reading since November 2021.  Meanwhile, the component index of food rose by 3.0%, and the energy component index fell by 0.8%.

On a monthly basis, the CPI rose by 0.3% in June (seasonally adjusted), after a 0.1% increase in May. The “core” CPI increased by 0.2% in June.

The price index for a broad set of energy sources rose by 0.9% in June, with increases across all components including fuel oil (+1.3%), gasoline (+1.0%), electricity (+1.0%) and natural gas (+0.5%). Meanwhile, the food index rose by 0.3%, the same increase in May. The index for food away from home increased by 0.4% and the index for food at home rose by 0.3%.

The index for shelter (+0.2%) was the largest contributor to the monthly increase in all items index. Other top contributors that rose in June include indexes for household furnishings and operations (+0.1%), medical care (+0.5%), recreation (+0.4%), apparel (+0.4%) as well as personal care (+0.3%). Meanwhile, the index for used cars and trucks (-0.7%), new vehicles (-0.3%), and airline fares (-0.1%) were among the few major indexes that decreased over the month.

The index for shelter makes up more than 40% of the “core” CPI, rising by 0.2% in June, following an increase of 0.3% in May. The index for owners’ equivalent rent (OER) rose by 0.3% and index for rent of primary residence (RPR) increased by 0.2% over the month. Despite the moderation, shelter costs remained the largest contributors to headline inflation. 

While the Fed rate cuts could ease some housing market pressure, its ability to address rising housing costs is limited, as these increases are driven by a lack of affordable supply and increasing development costs. Tight monetary policy actually hurts housing supply by increasing AD&C financing costs. This can be seen on the graph below, as shelter costs continued rising despite Fed policy tightening in 2022. Additional housing supply is the primary solution to tame housing inflation and overall inflation. This emphasizes why the cost of construction, including the cost of building materials, matters not just for housing but also the inflation outlook and the path of future monetary policy.

NAHB constructs a “real” rent index to indicate whether inflation in rents is faster or slower than core inflation. It provides insight into the supply and demand conditions for rental housing. When inflation in rents is rising faster than core inflation, the real rent index rises and vice versa. The real rent index is calculated by dividing the price index for rent by the core CPI (to exclude the volatile food and energy components). In June, the Real Rent Index remained unchanged. Over the first six months of 2025, the average monthly growth rate held steady at 0.1%, unchanged from the same period in 2024.

Discover more from Eye On Housing

Subscribe to get the latest posts sent to your email.


This article was originally published by a eyeonhousing.org . Read the Original article here. .

Real gross domestic product (GDP) increased in ten states in the first quarter of 2025 compared to the last quarter of 2024, according to the U.S. Bureau of Economic Analysis (BEA). Thirty-nine states reported real GDP declines, while the District of Columbia and Delaware reported no change during this time. The percent change in real GDP ranged from a 1.7 percent increase at an annual rate in South Carolina to a 6.1 percent decline in Iowa and Nebraska.

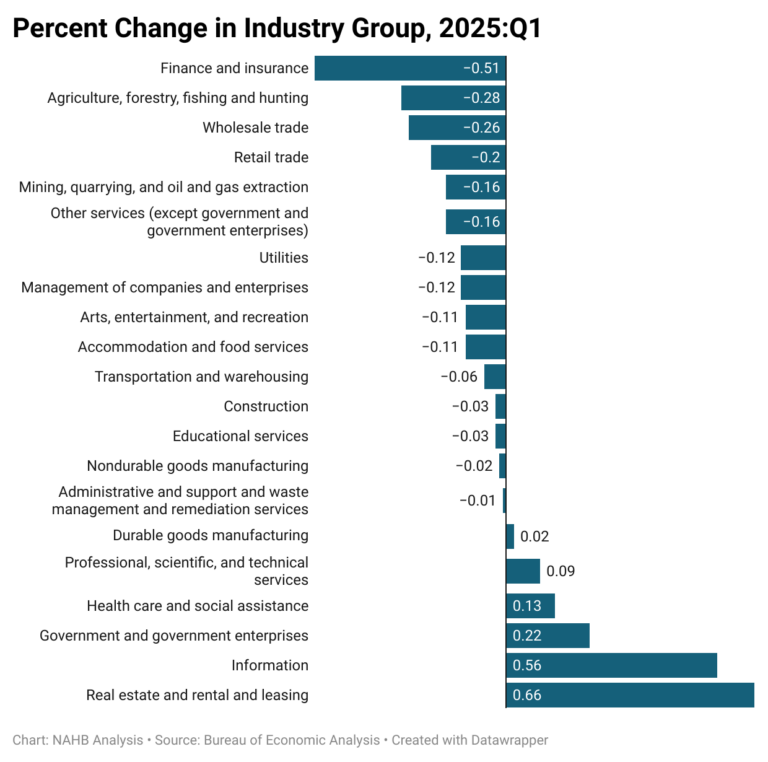
Nationwide, growth in real GDP (measured on a seasonally adjusted annual rate basis) declined 0.5 percent in the first quarter of 2025. This is the first decline in quarterly real GDP levels in three years. The leading contributors to the decrease in real GDP across the country were finance and insurance; agriculture, forestry, fishing and hunting; and wholesale trade.

Regionally, real GDP growth declined in seven out of the eight regions between the last quarter of 2024 and the first quarter of 2025. The Southeast region was the only territory to post a meager 0.3 percent increase. The percent change in real GDP declines ranged from a 0.3 percent decline in the Southwest and Far West regions, to a 3.3 percent decline in the Plains region.

At the state level, South Carolina posted the highest GDP growth rate (1.7 percent), followed by Florida (1.4 percent) and Alabama (1.0 percent). The percent increase in real GDP ranged from a 1.7 percent increase in South Carolina to a 0.1 percent increase in Georgia. On the other hand, 39 states reported real GDP declines ranging from a 0.1 percent decline in New Hampshire, Ohio, and Texas, to a 6.1 percent decline in Iowa and Nebraska for the first quarter of 2025.

Looking at industry contributions to GDP across states, the “real estate and rental and leasing industry” was the leading contributor to growth in all 50 states and the District of Columbia. In contrast, the agriculture, forestry, fishing, and hunting industry led a decrease in 39 states, and was the leading contributor to economic contraction in 11 states.

Discover more from Eye On Housing

Subscribe to get the latest posts sent to your email.


This article was originally published by a eyeonhousing.org . Read the Original article here. .


After a strong rebound in May, consumer confidence resumed its downward trend in June. Consumers remain concerned about the economy and labor market amid ongoing uncertainty, especially around tariffs. This month’s decline erased almost half of last month’s sharp gain, suggesting continued volatility in consumer sentiment.

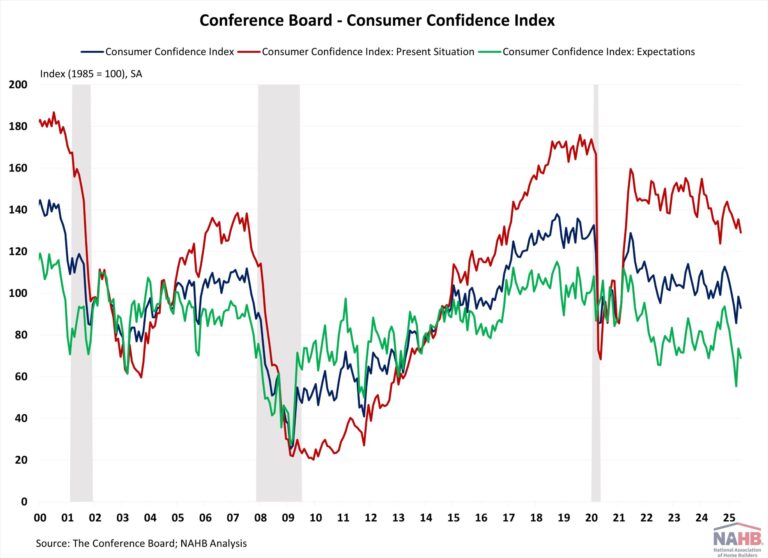
The Consumer Confidence Index, reported by the Conference Board, is a survey measuring how optimistic or pessimistic consumers feel about their financial situation. This index fell from 98.4 to 93.0 in June, the second lowest level since February of 2021. The Consumer Confidence Index consists of two components: how consumers feel about their present situation and their expected situation. In June, the Present Situation Index decreased 6.4 points from 135.5 to 129.1, the lowest since October 2024; and the Expectation Situation Index dropped 4.6 points from 73.6 to 69.0. This is the fifth consecutive month that the Expectation Index has been below 80, a threshold that often signals a recession within a year.

Consumers’ assessment of current business conditions turned negative in June. The share of respondents rating business conditions “good” decreased by 2.4 percentage points to 19.0%, while those claiming business conditions as “bad” rose by 1.6 percentage points to 15.3%. Meanwhile, consumers’ assessments of the labor market cooled somewhat in June. The share of respondents reporting that jobs were “plentiful” fell by 1.9 percentage points at 29.2%; meanwhile, those who saw jobs as “hard to get” decreased by only 0.3 percentage points to 18.1%.

Consumers were more pessimistic about the short-term outlook. The share of respondents expecting business conditions to improve fell from 19.9% to 16.7%, while those expecting business conditions to deteriorate declined from 25.4% to 24.0%. Similarly, expectations of employment over the next six months were more negative. The share of respondents expecting “more jobs” decreased by 3.2 percentage points to 15.4%, and those anticipating “fewer jobs” fell by 0.3 percentage points to 25.9%.

The Conference Board also reported the share of respondents planning to buy a home within six months. The share of respondents planning to buy a home fell slightly to 5.9% in June. Of those, respondents planning to buy a newly constructed home decreased to 0.2%, and those planning to buy an existing home dropped to 3.2%. The remaining 2.0% were planning to buy a home but were undecided between new or existing homes.

Discover more from Eye On Housing

Subscribe to get the latest posts sent to your email.


This article was originally published by a eyeonhousing.org . Read the Original article here. .


Lumber cost uncertainty has risen from the start of the year, driven in part by potential higher tariffs, particularly on Canadian softwood lumber. Despite the continued use and threat of tariffs, U.S. sawmill and wood preservation firms have not increased production to a level that replaces imports. In fact, utilization rates continue to fall, meaning they have the capacity to produce more lumber but are simply not operating at that level.

As these firms produce at lower levels, their employment has fallen over the past few quarters. At the same time, reduced foreign competition and artificially higher prices have lessened the incentive for firms to expand output, even as demand remains high. As a result, U.S. mills remain unable to meet the nation’s full lumber consumption needs.

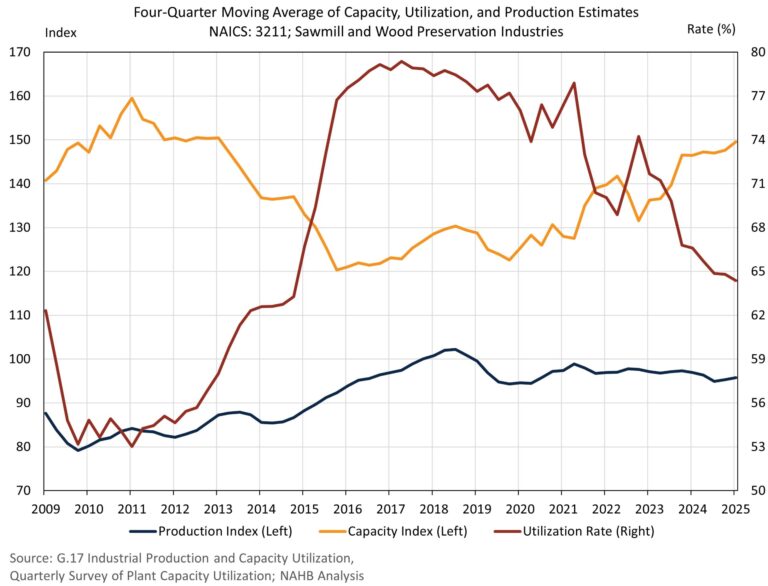
In the first quarter of 2025, sawmill and wood preservation firms continued to report lower capacity utilization coupled with stagnant production. The utilization rate, a ratio of actual production and potential production, was 64.4% in the first quarter on a four-quarter moving average basis. The utilization rate has continued to drop since 2017, as capacity (or the capability to produce) has increased, but production has remained lower than in 2018.

By combining the Federal Reserve’s production index and the Census Bureau’s utilization rate, we can compose a rough index estimate of what the current production capacity is for U.S. sawmills and wood preservation firms. Shown below is a quarterly estimate of the calculated production capacity index with production index and utilization rate estimates.  

Based on the data above, sawmill capacity has increased from 2015 but remains lower than peak levels in 2011. Most of the recent capacity gains took place in 2023, followed by little gain over the course of 2024. As evident above, there is ample room to increase production of domestic lumber, but current production levels remain much unchanged over the past several years. Looking at the Producer Price Index, lumber prices remain higher than 2024. At current pricing levels, producers may see no benefit of increasing output, as it would push prices lower since demand has fallen from the start of the year. Notably, even when prices were historically high in 2021 and 2022, producers were unable to increase their production significantly during these periods, potentially due to supply chain disruptions.

Employment at sawmills and wood preservations firms fell again in the first quarter to 88,533 workers. This marks the third consecutive quarter where employment fell in this industry. Tariff policies to protect the U.S. lumber industry have been in place since 2017 in the form of antidumping/countervailing duties. Tariff policies are typically intended to provide stability to the industry and increase employment but here, we are seeing the opposite effect.

These policies specifically place duties on imports of Canadian softwood lumber, where nearly a quarter of the U.S. softwood lumber supply originates. The current AD/CVD rates on Canadian softwood lumber are expected to double this fall to over 30%. Due to U.S. lumber production remaining level since the initial tariff policies were enacted in 2017, doubling these duty costs will likely not increase supply but simply increase costs.

Discover more from Eye On Housing

Subscribe to get the latest posts sent to your email.


This article was originally published by a eyeonhousing.org . Read the Original article here. .


The market value of household real estate assets fell from $48.1 trillion to $47.9 trillion in the first quarter of 2025, according to the most recent release of U.S. Federal Reserve Z.1 Financial Accounts. The value of household real estate assets declined for three consecutive quarters after peaking at $48.8 trillion in the second quarter of 2024 but remains 2.1% higher over the year.

Real estate secured liabilities of households’ balance sheets, i.e. mortgages, home equity loans, and HELOCs, increased 0.3% over the first quarter to $13.4 trillion. This level is 2.9% higher compared to the first quarter of 2024.

Owners’ equity share of real estate assets was 72.0% in the first quarter, marking a small decline in owners’ equity share which matches the decline in the market value of households real estate assets. The share in the first quarter of 2024 was 72.2%.

Discover more from Eye On Housing

Subscribe to get the latest posts sent to your email.


This article was originally published by a eyeonhousing.org . Read the Original article here. .

Despite inflationary pressure from tariffs, inflation in May rose slightly but came in softer than expected. The Consumer Price Index increased from 2.3% in April to 2.4% in May year-over-year, according to the Bureau of Labor Statistics’ report. While this report reflected consumer prices after Liberation Day, it showed little sign of tariff impact as most reciprocal tariffs were paused for 90 days and many businesses had frontloaded imports ahead of tariffs. This preemptive action contributed a drag on the first quarter GDP growth.

Additionally, the Bureau of Labor Statistics reduced its CPI collection sample starting in April due to staffing shortages, raising potential data quality concerns. Given these factors, it may be too early to gauge the impact of tariffs, as tariff-driven price increases have not yet materialized. Meanwhile, housing inflation remains elevated, though it continues to ease gradually.

During the past twelve months, on a non-seasonally adjusted basis, the Consumer Price Index rose by 2.4% in May. Excluding the volatile food and energy components, the “core” CPI increased by 2.8% over the past twelve months. A large portion of the “core” CPI is the housing shelter index, which increased 3.9% over the year, the lowest reading since November 2021.  Meanwhile, the component index of food rose by 2.9%, and the energy component index fell by 3.5%.

On a monthly basis, the CPI rose by 0.1% in May (seasonally adjusted), after a 0.2% increase in April. The “core” CPI increased by 0.1% in May.

The price index for a broad set of energy sources fell by 1.0% in May, with increases in electricity (0.9%) and fuel oil (0.9%) offset by declines in gasoline (-2.6%) and natural gas (-1.0%). Meanwhile, the food index rose by 0.3%, after a 0.1% decrease in April. Both food away from home and food at home increased by 0.3%.

The index for shelter (+0.3%) was the largest contributor to the monthly increase in all items index. Other top contributors that rose in May include indexes for medical care (+0.3%), motor vehicle insurance (+0.7%), household furnishings and operations (+0.3%), personal care (+0.5%), as well as education (+0.3%). Meanwhile, the index for airline fares (-2.7%) and used cars and trucks (-0.5%) were among the few major indexes that decreased over the month.

The index for shelter makes up more than 40% of the “core” CPI, rising by 0.3% in May, following an increase of 0.3% in April. The index for owners’ equivalent rent (OER) rose by 0.3% and index for rent of primary residence (RPR) increased by 0.2% over the month. Despite the moderation, shelter costs remained the largest contributors to headline inflation. 

While the Fed rate cuts could ease some housing market pressure, its ability to address rising housing costs is limited, as these increases are driven by a lack of affordable supply and increasing development costs. Tight monetary policy actually hurts housing supply by increasing AD&C financing cost. This can be seen on the graph below, as shelter costs continued rising despite Fed policy tightening in 2022. Additional housing supply is the primary solution to tame housing inflation and overall inflation. This emphasizes why the cost of construction, including the cost of building materials, matters not just for housing but also the inflation outlook and the path of future monetary policy.

NAHB constructs a “real” rent index to indicate whether inflation in rents is faster or slower than core inflation. It provides insight into the supply and demand conditions for rental housing. When inflation in rents is rising faster than core inflation, the real rent index rises and vice versa. The real rent index is calculated by dividing the price index for rent by the core CPI (to exclude the volatile food and energy components).

In May, the Real Rent Index rose by 0.1%. Over the first five months of 2025, the average monthly growth rate held steady at 0.1%, unchanged from the same period in 2024.

Discover more from Eye On Housing

Subscribe to get the latest posts sent to your email.


This article was originally published by a eyeonhousing.org . Read the Original article here. .

Single-family construction growth slowed substantially across all markets in the first quarter of 2025, according to the Home Building Geography Index (HBGI).  Multifamily construction growth remained negative in the largest markets but reported significant expansion in lower population density areas. The HBGI tracks single-family and multifamily permits across seven population density delineated geographies in the United States.  

Single-Family

Among the HBGI geographies, the highest growth in the first quarter of 2025 was registered in small metro core counties, which increased 3.2% year-over-year on a four-quarter moving average basis (4QMA). The market with the largest decline in growth between the fourth quarter and first quarter was large metro core counties, which saw its four-quarter moving average growth rate fall from 9.4% to 1.3% (-8.1 pp). Two geographies, large metro outlying areas and non metro/micro counties, reported declines in the first quarter, down 0.2% and 0.4% respectively.

In terms of market share, single-family construction took place primarily in small metro core county areas, representing 29.2% of single-family construction. The smallest single-family construction market remained non metro/micro county areas, with a 4.2% market share. Single-family construction market share have been stable since the first quarter of 2024, with the largest gain being 0.4 percentage points in small metro core counties over the year.  

Multifamily

Multifamily construction expanded 33.2% in large metro outlying areas in the first quarter, the highest growth (4QMA) since the second quarter of 2022 when this geography grew 71.8%. Growth was present in three other geographies, with micro counties up 29.3%, small metro outlying counties up 18.5%, and non metro/micro counties up 3.7%.

Because of the notable increase in multifamily construction occurring in smaller markets, market shares have shifted over the past two years. Large metro core counties, where a plurality of construction takes place, saw a 4.8 percentage point drop in market share between Q1 of 2024 and 2025. The largest construction gains have been in low population density areas, with the combined market share for small metro outlying counites, micro counties and non metro/micro counties growing 2.2 percentage points from 7.8% to 10.0% between Q1 2024 and 2025.

The first quarter of 2025 HBGI data along with an interactive HBGI map can be found at http://nahb.org/hbgi.

Discover more from Eye On Housing

Subscribe to get the latest posts sent to your email.


This article was originally published by a eyeonhousing.org . Read the Original article here. .
Pin It