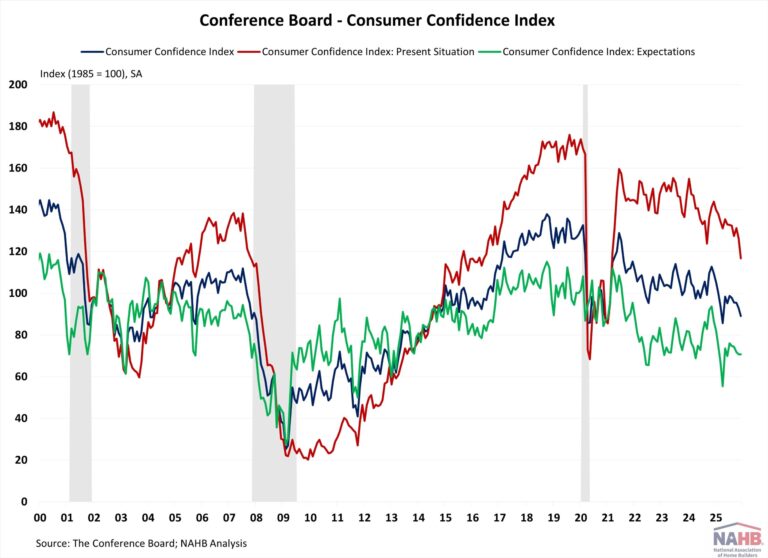
Consumer confidence in December fell to the lowest level since April’s tariff implementation, reflective of growing concerns about reignited inflation and a weakening labor market affecting personal finances. The labor market differential, which measures the gap between consumers viewing job as plentiful and hard-to-get, continued to narrow and is now at its lowest level since February 2021. This is consistent with recent job reports showing fewer job openings and slower hiring. The decline in confidence stands in contrast to the recent solid GDP report for the third quarter.
The Consumer Confidence Index, reported by the Conference Board, is a survey measuring how optimistic or pessimistic consumers feel about their financial situation. This index fell from 92.9 to 89.1 in December, the lowest level since April. The Consumer Confidence Index consists of two components: how consumers feel about their present situation and their expected situation. In September, the Present Situation Index decreased 9.5 points from 126.3 to 116.8, the largest monthly decline since September 2024; the Expectation Situation Index dropped remained unchanged at 70.7. This is the eleventh consecutive month that the Expectation Index has been below 80, a threshold that often signals a recession within a year.
Consumers’ assessment of current business conditions deteriorated in December. The share of respondents rating business conditions “good” decreased by 2.3 percentage points to 18.7%, while those claiming business conditions as “bad” rose by 3.3 percentage points to 19.1%. Meanwhile, consumers’ assessments of the labor market cooled further in December. The share of respondents reporting that jobs were “plentiful” fell by 1.5 percentage points to 26.7%, the lowest level since March 2021; meanwhile, those who saw jobs as “hard to get” rose by 0.7 percentage points to 20.8%, the highest since February 2021.
Consumers were more pessimistic about the short-term outlook. The share of respondents expecting business conditions to improve fell from 18.1% to 18.0%, while those expecting business conditions to deteriorate declined from 25.1% to 21.8%. Similarly, expectations of employment over the next six months were more negative. The share of respondents expecting “more jobs” remained unchanged at 16.5%, and those anticipating “fewer jobs” rose by 0.6 percentage points to 27.4%.
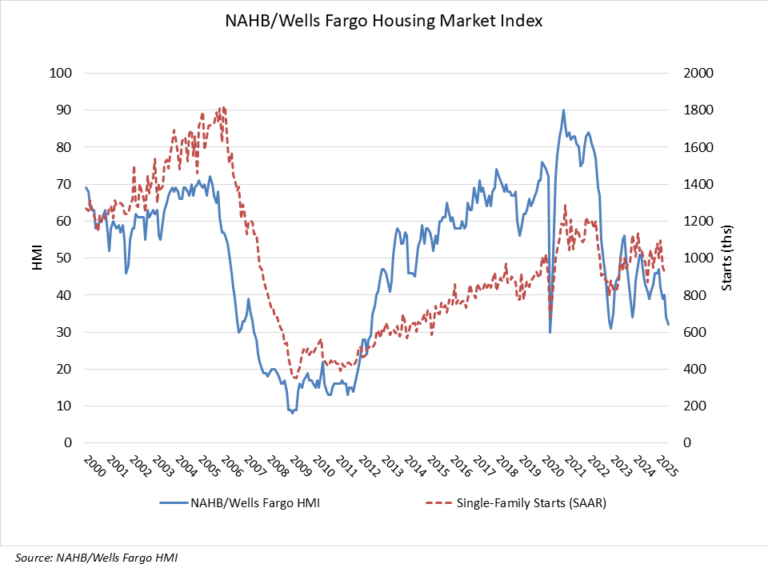
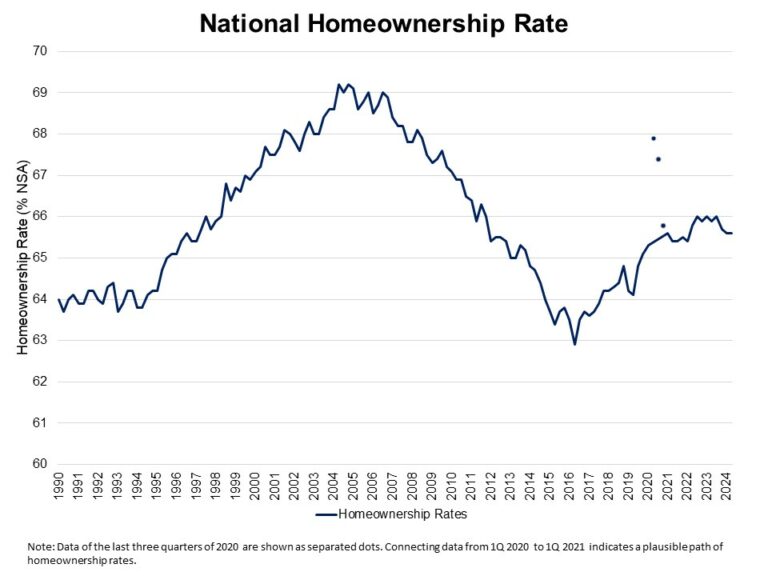
The Conference Board also reported the share of respondents planning to buy a home within six months. The share of respondents planning to buy a home fell slightly to 5.7% in December, the lowest level since August. Of those, respondents planning to buy a newly constructed home fell to 0.5%, and those planning to buy an existing home was unchanged at 2.4%. The remaining 2.8% were planning to buy a home but were undecided between new or existing homes.
This article was originally published by a eyeonhousing.org . Read the Original article here. .
