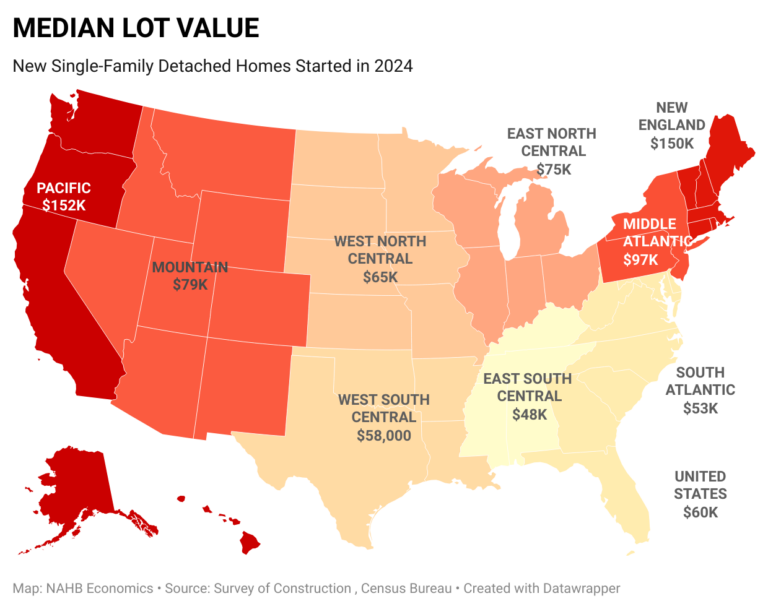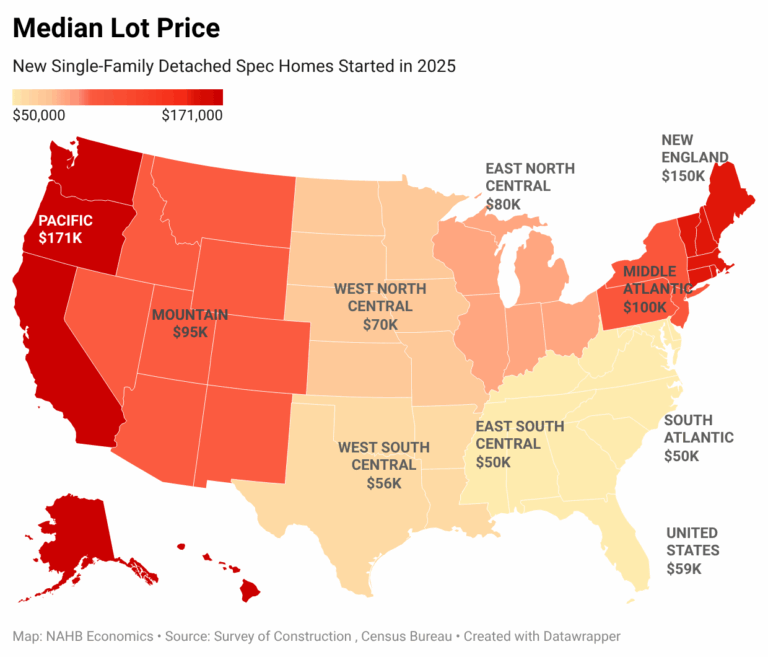
Following a multi-year run of record highs, the national median lot value for single-family detached spec homes largely stabilized in 2025. According to NAHB’s analysis of the Census Bureau’s Survey of Construction (SOC), the U.S. median lot value for homes started in 2025 was $59,000, compared with $60,000 a year earlier. While this represents the first year since 2019 without a new national high, the overall trend masks considerable regional variation. In fact, the Pacific, Mountain, Middle Atlantic, and East North Central Census Divisions all reached new record highs.
In real (inflation-adjusted) terms, national median lot values declined by roughly 4% in 2025, as inflation continued to rise while nominal lot values stabilized. Inflation-adjusted lot values remain well below the peaks reached during the 2005-2006 housing boom. At that time, the national median was $43,000, equivalent to roughly $68,700 in 2025 dollars.
Although the current national median lot value is below its inflation-adjusted peak, it reflects a very different mix of lots compared to the housing boom years or even a decade ago. As our earlier analysis has shown, new single-family spec homes are increasingly being built on smaller lots. Lots smaller than one-fifth of an acre accounted for 48% of spec home starts in 2005, compared with 65% in 2024 and 64% in 2025.
The persistence of high lot values, even as lot sizes shrink, reflects ongoing challenges builders face in securing buildable lots. Although lot shortages are less widespread than they were in 2021, they remain a significant constraint. According to the May 2025 NAHB/Wells Fargo Housing Market Index (HMI) survey, 64% of builders rated the supply of developed lots as low or very low. The more recent June 2026 HMI survey found that lot availability remains uneven across markets, with 42% of respondents rating it as poor and 17% describing it as good.
Consistent with the HMI survey findings on market differences, the SOC data reveal substantial variation across U.S. regions. While the national upward trend in lot values paused, values continued to rise and reached new record highs in the Pacific, Mountain, Middle Atlantic, and East North Central Census Divisions. As with all SOC-based estimates, divisional figures rest on considerably smaller samples than the national estimate and carry wider margins of error, so year-over-year swings at the division level are best read as directional rather than precise.
New England and the Pacific remain the two Census divisions with the most expensive lots. In New England, half of all single-family detached (SFD) spec homes started in 2025 were built on lots valued at or above $150,000. The region is known for restrictive local zoning regulations that often require low-density development. As a result, the median lot size for SFD spec homes in New England was roughly twice the national median in 2025, making it unsurprising that the region continues to rank among the nation’s most expensive markets for residential lots.
Lot size alone, however, cannot explain the wide regional variation in lot values. The Pacific division, where developable land is especially scarce, has some of the nation’s smallest lots. Even so, its median lot value climbed to a record $171,000 in 2025, the highest of any Census division for the second consecutive year, further widening its lead over New England.
The Middle Atlantic also reached a new record in 2025, marking its second consecutive annual high, with a median lot value of $100,000 and retaining its position as the nation’s third most expensive division. Meanwhile, the Mountain division posted the largest year-over-year increase of any region, with its median lot value rising to a record $95,000.
Despite several years of appreciation and a new high of $50,000 in 2025, the East South Central division remains home to some of the nation’s least expensive lots for SFD spec homes. At the same time, its lots are substantially larger than the national median, resulting in some of the lowest lot values per acre in the country. The South Atlantic division, by contrast, retreated from its 2024 record but remained above its 2023 level. With a median lot value of $50,000, it tied East South Central for the lowest among the Census divisions and remained well below the national median of $59,000.
Median lot values in the West South Central division, which includes Texas, have risen dramatically over the past decade despite easing for a second consecutive year to $56,000 in 2025. In 2012, the division’s median lot value was just $30,000, meaning today’s typical lot is nearly twice as expensive.
This analysis includes only single-family detached speculatively built homes, classified by year started and with reported sales prices. The SOC does not report land values for custom homes built on an owner’s land, whether the owner or a builder serves as the general contractor. Consequently, custom homes are excluded from this analysis.
Median lot values are used throughout this analysis because they are less sensitive to extreme observations than averages. This approach is particularly appropriate for the public-use Survey of Construction data, where the Census Bureau often top-codes or masks extreme lot values, making it difficult to calculate averages precisely, but medians remain unaffected by these procedures.
This article was originally published by a eyeonhousing.org . Read the Original article here. .