Tag

Local

Browsing


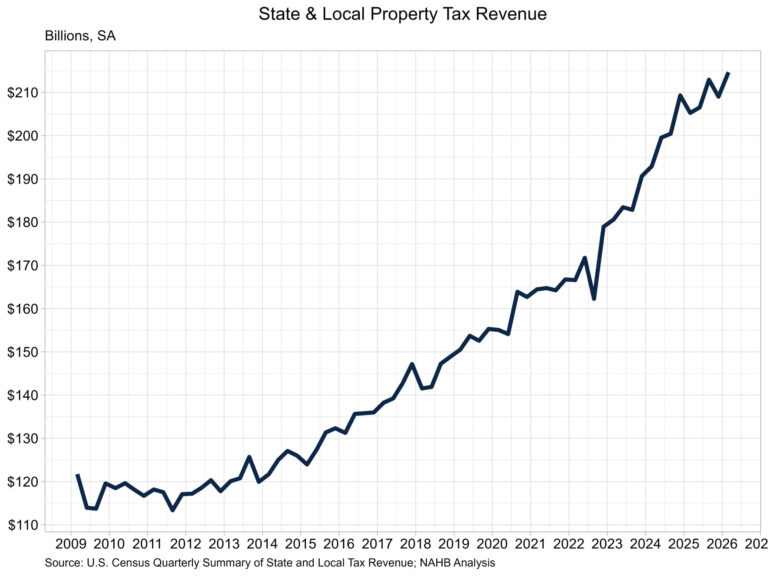
Property tax revenue collected by state and local governments was higher in the first quarter of 2026 according to the Census Bureau’s quarterly summary of state and local tax revenue. Total tax revenue for state and local governments increased 1.5% over the quarter, with individual income tax revenue up 1.4%, sales tax revenue down 0.3%, and corporate income tax revenue up 2.1%. Property tax revenue rose the most over the quarter, up 2.7%.

Property tax collections totaled $214.6 billion in the first quarter, an increase from a revised $209.0 billion estimate in the fourth quarter. Property tax collections were up 4.6% from one year ago. The share of property tax revenue as a share of total revenue was 37.5% in the first quarter. This share has been relatively stagnant at 37% over the past three years.

Property taxes typically make up the largest share of the total tax revenue for state and local governments, with most property tax collected by local governments. The second largest revenue generator was shared between income tax and sales tax, totaling $154.8 billion (27.1%). Corporate income tax rounded out the remaining 8.2% at $47.1billion.


This article was originally published by a eyeonhousing.org . Read the Original article here. .


Nationally, house prices continued to rise at a modest pace in the third quarter of 2025, as mentioned in our previous quarterly house prices post. However, this national trend masks significant variation across local markets. While many metro areas continued to see house price appreciation, others experienced notable declines following several years of rapid growth.

Since the onset of the COVID-19 pandemic, house prices have surged nationwide. Between the first quarter of 2020 and the third quarter of 2025, national house prices climbed 54.9%. Local markets saw broad gains as well, with cumulative appreciation ranging from 18.3% to 88.4%, and 159 metro areas reached their highest recorded house prices in the third quarter of 2025.

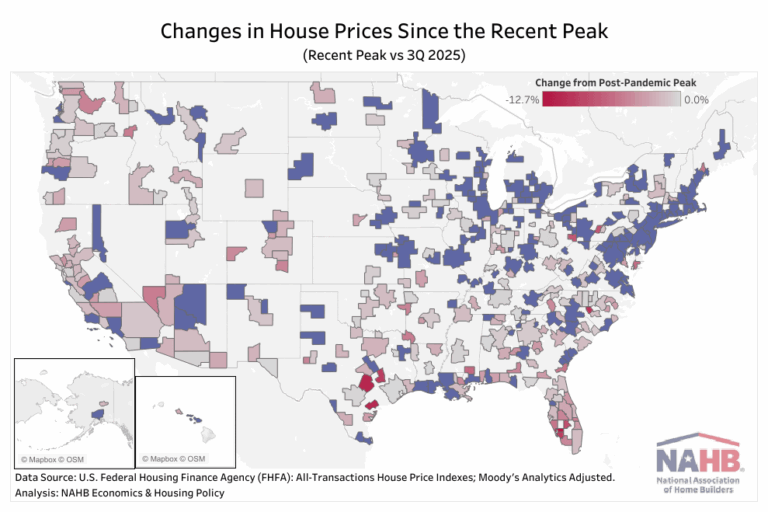
Yet despite these increases, more than half of metro areas have now experienced at least some decline from their recent price peak. These declines range from a slight 0.1% dip to a more substantial 12.7% decline, with most of the downward trends beginning in last 2024 or early 2025.

House price declines have been most widespread in the West and South, regions that saw some of the fastest appreciation during the pandemic boom.  Several markets stand out for their significant corrections:

Punta Gorda, FL has experienced the sharpest decline, with prices falling 12.7% since its peak in the fourth quarter of 2022.

Austin–Round Rock–San Marcos, TX, one of the nation’s hottest markets during the pandemic, has seen prices drop 11.3% since reaching a peak in the second quarter of 2022.

Victoria, TX reached its peak more recently in the fourth quarter of 2024 and has since seen prices decline 11.0% over the past three quarters.

In contrast, many metro areas in the Midwest and Northeast have avoided significant price declines. These regions continue to see slower but steady price growth, supported by persistent inventory shortages and solid demand. Their more moderate appreciation during the pandemic has also helped limit the risk of sharp price corrections. Here are some examples (listed in no particular order):

York–Hanover, PA recorded a 6.0% year-over-year increase in house prices in the third quarter of 2025, reflecting stable demand and limited housing supply.

Worcester, MA continues to experience price growth, slowing from the rapid 18.0% growth in the third quarter of 2021 to a still-solid 4.4% year-over-year gain in the third quarter of 2025.

Wausau, WI experienced a robust 9.5% year-over-year increase in home prices, standing out as one of the strongest and most resilient housing markets in the region.

Milwaukee-Waukesha, WI continue to see rising house prices, with growth easing from a peak of 16.7% growth in the second quarter of 2022 to a more sustainable 5.6% year-over-year increase in the third quarter of 2025.

This article was originally published by a eyeonhousing.org . Read the Original article here. .


In the first quarter of 2025, state and local governments experienced an increase in property tax revenue growth. On a seasonally adjusted basis, state and local government property tax revenue grew 1.1% over the quarter, according to the Census Bureau’s quarterly summary of state and local tax revenue. Meanwhile, total tax revenue for state and local governments grew 1.3% over the quarter, with corporate income tax revenue up 6.6%, sales tax revenue up 0.9% and individual income tax revenue up 0.2%.

Property tax revenue stood at $203.4 billion in the first quarter, a slight increase from $201.1 billion in the fourth quarter. While this does show growth over the quarter, growth has notably slowed over the past year. The quarterly growth in the first quarter of 2024 was almost double (2.1%) the current rate. On a year-over-year basis, property tax revenue was 5.2% higher, up from $193.3 billion.

Property taxes typically make up the largest share of the total tax revenue for state and local governments, accounting for over one-third at 37.8% in the first quarter. The second highest revenue source was sales tax at 27.7%, totaling $148.9 billion, followed closely by individual income tax at 26.1% ($140.5 billion). Corporate income tax rounded out the remaining 8.4% at $45.4 billion.

Discover more from Eye On Housing

Subscribe to get the latest posts sent to your email.


This article was originally published by a eyeonhousing.org . Read the Original article here. .


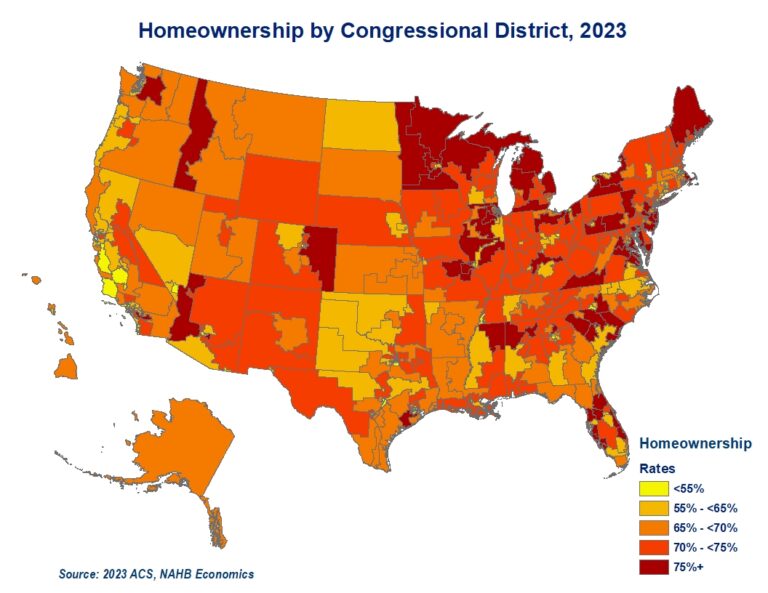
With housing being a key issue for the 2024 election cycle, it is worth analyzing distinct characteristics as well as similarities that housing markets in congressional districts share. The differences start with a substantial variation in homeownership rates across congressional districts.

While the 2023 American Community Survey (ACS) reports that close to two thirds of US households (65.2%) are home owners, there are forty congressional districts where renter households represent the majority. In twelve of these districts, renters account for more than two thirds of households. This list includes eight urban high-density congressional districts in New York, three districts in California and New Jersey’s 8th congressional district. The pattern of urban congressional districts registering lower home ownership rates repeats across the country.

At the other end of the spectrum, there are seven congressional districts with home owners representing over 80% of households. These include three districts in Michigan, two in New York, and one in both Maryland, and Minnesota.

New York stands out with simultaneous congressional districts with the lowest and second highest homeownership rates. Close to 84% of households in New York’s 1st district located in eastern Long Island are home owners. The only other congressional district that registers a higher homeownership rate is Michigan’s 9th congressional district located in the Thumb at 85%.   In contrast, in New York’s urban 13th and 15th districts, home owners comprise a minority of less than 16% and 13%, respectively.

California is another example of substantial variation of homeownership rates across congressional districts within a state. In California’s 41st district in Riverside County, 3 out of 4 households are home owners. At the same time, in California’s 34th district in the city of Los Angeles, only 22% of households live in a home they own. 

Population density, racial and ethnical makeup, as well as varying cost of ownership, all contribute to substantial variation in homeownership rates across the US congressional districts.

Additional housing data for your congressional district are provided by the US Census Bureau here.

Discover more from Eye On Housing

Subscribe to get the latest posts sent to your email.


This article was originally published by a eyeonhousing.org . Read the Original article here. .


State & local tax revenue from property taxes paid reached $780.9 billion in the four quarters ending in the second quarter of 2024 (seasonally adjusted), according to the Census Bureau’s estimates. This is a 1.7% increase from the revised $767.7 billion in the four quarters ending in the first quarter of 2024. Year-to-date, total state and local tax revenue was $1.05 trillion. This was 5% higher than the $995.7 billion through the first two quarters of 2023.

The 1.7% increase in the four-quarter property tax revenue was down from the previous quarter of 1.8%. Property tax revenues have continued to grow above the average rate of 0.96% since 2011, with this quarter marking the seventh consecutive quarter of above average growth.

Year-over-year, property tax revenue was 9.1% higher. Year-over-year growth in property tax revenue has consistently been above 9% for four consecutive quarters. Dating back to 2012, the average year-over-year growth is 4.0%.

The property tax share of total state & local tax collections in the second quarter stood at 37.8%, down from 37.9%. This was the first decline in the share since its recent trough in the third quarter of 2022 (33.7%).

Of total collections, property tax made up the largest share, followed by sales tax at 28.0%. Individual income tax represented 25.5% of tax revenue, while corporate tax made up the remaining 8.7% of revenues for state & local revenues in the second quarter of 2024.

Over the past decade, state & local governments have been most reliant on property taxes for revenue. Sales tax has had an increased importance since 2023, when the share of sales tax of total revenues grew above individual income tax shares. See the chart below for the trends of total tax revenues shares.

Discover more from Eye On Housing

Subscribe to get the latest posts sent to your email.


This article was originally published by a eyeonhousing.org . Read the Original article here. .

Pin It
