Tag

Levels

Browsing


The long-term shift toward building single-family detached homes on smaller lots appears to have stabilized. According to the latest Survey of Construction (SOC), the share of new homes built on smaller lots remained near record highs in 2025, following more than a decade of steadily shrinking lot sizes. While the median lot size edged up slightly in 2025, the increase was modest and did not alter the broader trend toward more compact development.

The share of smaller lots remained high in 2025, with close to two-thirds of new single-family detached homes sold occupying lots under 9,000 square feet (1/5 of an acre or less). Moreover, 38% of lots were under 7,000 square feet (or less than 1/6 of an acre). These shares are just slightly below the record highs established over the last two years.

In contrast, when the Census Bureau started tracking these series in 1999, less than half (46%) of new for-sale single-family detached homes occupied lots under 9,000 square feet. Our earlier analysis traced how new single-family detached homes have steadily shifted toward smaller lots. That analysis revealed that the trend accelerated over the last 15 years, reflecting persistent lot shortages and builders’ efforts to improve affordability.

The newly released data show that the median lot size of a new single-family detached home sold in 2025 increased slightly to 8,543 square feet, up from 8,506 square feet in 2024. Although this represents a small year-over-year increase, the typical lot remains under 1/5 of an acre and well below historical levels. It is only modestly above the record-low median of 8,177 square feet recorded in 2019. The data suggest that, after years of steady declines, lot sizes have largely leveled off while remaining historically small, under one-fifth of an acre.

While the nation’s production of spec homes shifts towards smaller lots, regional differences in lot sizes persist. Looking at single-family detached spec homes started in 2025, the median lot size in New England is double the national median.  

New England is known for strict local zoning regulations that often require very low density. Therefore, it is not surprising that single-family detached spec homes started in New England are built on some of the largest lots in the nation, with half of the lots exceeding 0.4 acres. The East South Central division is second on the list, with the median lot occupying 0.3 acres.  

At the other end of the spectrum, the Pacific division, where densities are high and developed land is scarce, has the smallest lots, with half of the lots being under 0.13 acres. The bordering Mountain division also reports typical lots smaller (0.15 acres) than the national median.  

In the South, the West South Central division stands out for starting half of single-family detached spec homes on lots under 0.15 acres. This is half the size of typical lots in the neighboring East South Central division.  

The analysis above is limited to single-family detached speculatively built homes. Custom homes built on an owner’s land with either the owner or a builder acting as the general contractor do not involve the work of a professional land developer subdividing a property. Therefore, in the case of custom homes, lots refer to an owner’s land area rather than lots in a conventional sense. Nevertheless, the SOC reports lot sizes for custom homes and shows that they tend to have larger lots. The median lot size for custom single-family detached homes started in 2025 is one acre.  

For regional analysis, the median lot size is chosen over the average because extreme outliers heavily influence averages. In addition, the Census Bureau often masks extreme lot sizes and values on the public use SOC dataset, making it difficult to calculate averages precisely, but medians (as the midpoint of a frequency distribution) remain unaffected by these procedures.


This article was originally published by a eyeonhousing.org . Read the Original article here. .


Residential demolition activity in 2025 declined 0.1% year-over-year but remained above pre-pandemic levels. According to NAHB analysis of data from Construction Monitor, permits pulled for residential demolition have been increasing since 2018, with the exception of 2020, when building-related activities broadly stalled. Demolition activity rebounded sharply in 2021 and 2022 but has since plateaued. Even with the recent stall, demolition permits in 2025 were still 34.2% higher than in 2018, underscoring the extent to which activity remains elevated relative to pre-pandemic norms.

While the data do not differentiate between partial or full demolitions, teardowns are often an indicator of redevelopment and neighborhood reinvestment, and thus, signals future construction. Previous NAHB survey analysis indicated that teardown-related construction projects made up approximately 7% of single-family starts in 2024.

At the state level, demolition activity is highly concentrated, with California, Texas, and Florida—the three most populous states—usually leading the nation in demolition permits. However, from 2023 through 2025, New Jersey ranked third in total demolition permits, surpassing Texas. New Jersey’s elevated demolition activity reflects the age of its housing stock. Approximately 73% of homes in the state were built before 1980, out of which 18% were built before 1939, leaving many properties functionally obsolete or in need of replacement. In response, several municipalities have pursued targeted redevelopment and blight reduction initiatives. For example, Trenton, the capital city, launched one of its largest blight reduction projects in 2023, aimed at revitalizing distressed neighborhoods and expanding the supply of quality housing.

In 2025, New Jersey accounted for approximately 10.4% of all residential demolition permits nationwide. Florida recorded the largest share at 14.6%, followed by California at 13.3%. Texas remained a significant contributor at 7.2%, while New York ranked fifth with about 4.1% of total activity. Collectively, the top five states accounted for nearly half of all residential demolition permits issued in 2025, highlighting the high degree of geographic concentration at the state level.

At a smaller geographic scale, the year-to-year variability is substantially higher. To account for this volatility, examining cumulative demolition permitting since 2018 provides insight into where demolition activity has been persistently concentrated over the current cycle. On this basis, Los Angeles County, CA accounted for the largest share of cumulative demolition permits (4.8%), followed by Harris County, TX (3.1%), Cuyahoga County, OH (2.6%), King County, WA (2.0%), and Miami-Dade County, FL (1.8%). Together, these five counties accounted for nearly 15% of all demolition activity nationwide over the period.


This article was originally published by a eyeonhousing.org . Read the Original article here. .
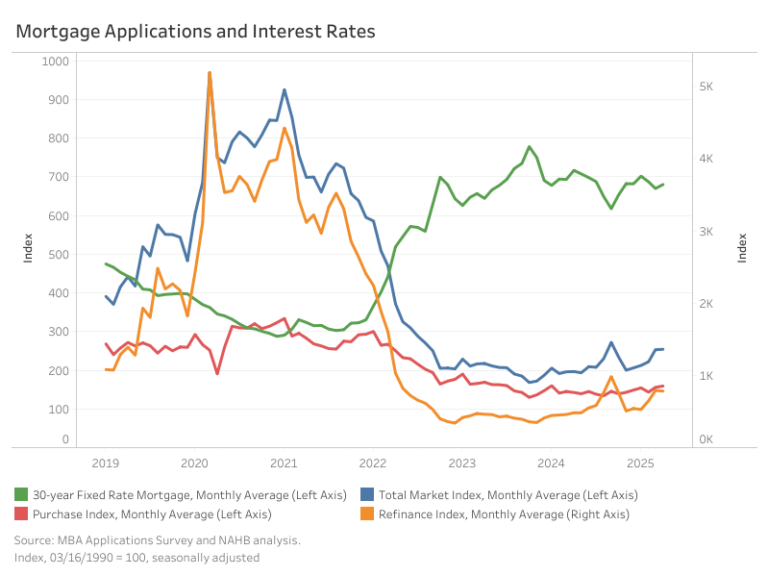

Mortgage loan applications saw little change in April, as refinancing activity decreased. The Market Composite Index, which measures mortgage loan application volume based on the Mortgage Bankers Association (MBA) weekly survey, experienced a 0.4% month-over month increase on a seasonally adjusted (SA) basis. However, year-over-year, the index is up 29.3% compared to April 2024.

The average rate for a 30-year fixed mortgage climbed 10 basis points in April, reaching 6.8%, according to the MBA survey. As rates edged higher, purchase activity posted a modest 1.9% month-over-month gain (SA), while the Refinance Index declined by 1.4% (SA). Compared to a year ago, mortgage rates are down 37 bps, and thus, purchase applications are higher by 11.2%, while refinance activity has jumped 62.0%.

Loan sizes remained relatively stable. In April, the average loan size across the total market (including purchases and refinances) held steady at $403,500, month-over-month, on a non-seasonally adjusted basis (NSA). Purchase loans sizes edged down 1.3% to $444,000, while refinance loan sizes increased 0.5% to $339,300. Notably, the average loan size for adjustable-rate mortgages (ARMs) fell 7.8%, from $1.14 million to $1.05 million.

Discover more from Eye On Housing

Subscribe to get the latest posts sent to your email.


This article was originally published by a eyeonhousing.org . Read the Original article here. .


Growing economic uncertainty stemming from tariff concerns and elevated building material costs kept builder sentiment in negative territory in April, despite a modest bump in confidence likely due to a slight retreat in mortgage interest rates in recent weeks.

Builder confidence in the market for newly built single-family homes was 40 in April, edging up one point from March, according to the National Association of Home Builders (NAHB)/Wells Fargo Housing Market Index (HMI).

The March dip in mortgage rates may have stimulated some sales activity in recent weeks. However, builders have expressed growing uncertainty over market conditions as tariffs have increased price volatility for building materials at a time when the industry continues to grapple with labor shortages and a lack of buildable lots.

Policy uncertainty is making it difficult for builders to accurately price homes and make critical business decisions. The April HMI data indicates that the tariff cost effect is already taking hold, with the majority of builders reporting cost increases on building materials due to tariffs.

When asked about the impact of tariffs on their business, 60% of builders reported their suppliers have already increased or announced increases of material prices due to tariffs. On average, suppliers have increased their prices by 6.3% in response to announced, enacted, or expected tariffs. This means builders estimate a typical cost effect from recent tariff actions at $10,900 per home.

The latest HMI survey also revealed that 29% of builders cut home prices in April, unchanged from March. Meanwhile, the average price reduction was 5% in April, the same rate as the previous month. The use of sales incentives was 61% in April, up from 59% in March.

Derived from a monthly survey that NAHB has been conducting for more than 35 years, the NAHB/Wells Fargo HMI gauges builder perceptions of current single-family home sales and sales expectations for the next six months as “good,” “fair” or “poor.” The survey also asks builders to rate traffic of prospective buyers as “high to very high,” “average” or “low to very low.” Scores for each component are then used to calculate a seasonally adjusted index where any number over 50 indicates that more builders view conditions as good than poor.

The HMI index gauging current sales conditions rose two points in April to a level of 45. The gauge charting traffic of prospective buyers increased one point to 25 while the component measuring sales expectations in the next six months fell four points to 43.

Looking at the three-month moving averages for regional HMI scores, the Northeast fell seven points in April to 47, the Midwest moved one point lower to 41, the South dropped three points to 39 and the West posted a two-point decline to 35.

The HMI tables can be found at nahb.org/hmi.

Discover more from Eye On Housing

Subscribe to get the latest posts sent to your email.


This article was originally published by a eyeonhousing.org . Read the Original article here. .
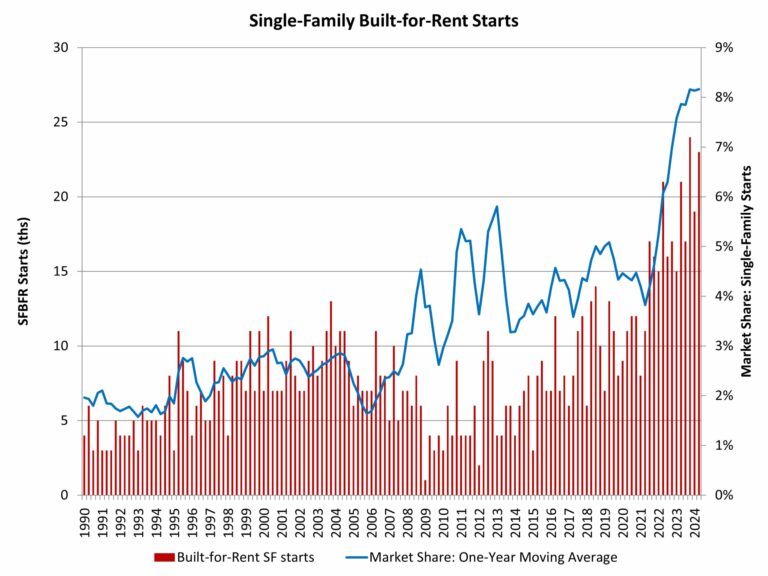

Single-family built-for-rent construction posted year-over-year gains as of the second quarter of 2024, as builders sought to add additional rental housing in a market facing ongoing, elevated mortgage interest rates.

According to NAHB’s analysis of data from the Census Bureau’s Quarterly Starts and Completions by Purpose and Design, there were approximately 23,000 single-family built-for-rent (SFBFR) starts during the second quarter of 2024. This is almost 10% higher than the second quarter of 2023. Over the last four quarters, 83,000 such homes began construction, which is a more than 20% increase compared to the 69,000 estimated SFBFR starts in the four quarters prior to that period.

The SFBFR market is a source of inventory amid challenges over housing affordability and downpayment requirements in the for-sale market, particularly during a period when a growing number of people want more space and a single-family structure. Single-family built-for-rent construction differs in terms of structural characteristics compared to other newly-built single-family homes, particularly with respect to home size. However, investor demand for single-family homes, both existing and new, has cooled with higher interest rates. Nonetheless, builders continue to build projects of built-for-rent homes for their own operation.

Given the relatively small size of this market segment, the quarter-to-quarter movements typically are not statistically significant. The current four-quarter moving average of market share (8%) is nonetheless higher than the historical average of 2.7% (1992-2012).

Importantly, as measured for this analysis, the estimates noted above include only homes built and held by the builder for rental purposes. The estimates exclude homes that are sold to another party for rental purposes, which NAHB estimates may represent another three to five percent of single-family starts based on industry surveys.

The Census data notes an elevated share of single-family homes built as condos (non-fee simple), with this share averaging more than 3% over recent quarters. Some, but certainly not all, of these homes will be used for rental purposes. Additionally, it is theoretically possible some single-family built-for-rent units are being counted in multifamily starts, as a form of “horizontal multifamily,” given these units are often built on a single plat of land. However, spot checks by NAHB with permitting offices indicate no evidence of this data issue occurring.

Nonetheless, demand by investors for single-family rental units, new and existing, has cooled in recent quarters as financial conditions remain tight. This will continue to cool some investor demand for SFBFR housing.

With the onset of the Great Recession and declines for the homeownership rate, the share of built-for-rent homes increased in the years after the recession. While the market share of SFBFR homes is small, it has clearly expanded. Given affordability challenges in the for-sale market, the SFBFR market will likely retain an elevated market share even as the sector cools in the quarters ahead.

Discover more from Eye On Housing

Subscribe to get the latest posts sent to your email.


This article was originally published by a eyeonhousing.org . Read the Original article here. .

Pin It