Tag

July

Browsing


High interest rates for construction and development loans as well as ongoing challenges regarding labor shortages and higher prices for many building materials continued to slow the building market this summer.

Overall housing starts decreased 6.8% in July to a seasonally adjusted annual rate of 1.24 million units, according to a report from the U.S. Department of Housing and Urban Development and the U.S. Census Bureau. This is the lowest pace since May 2020.

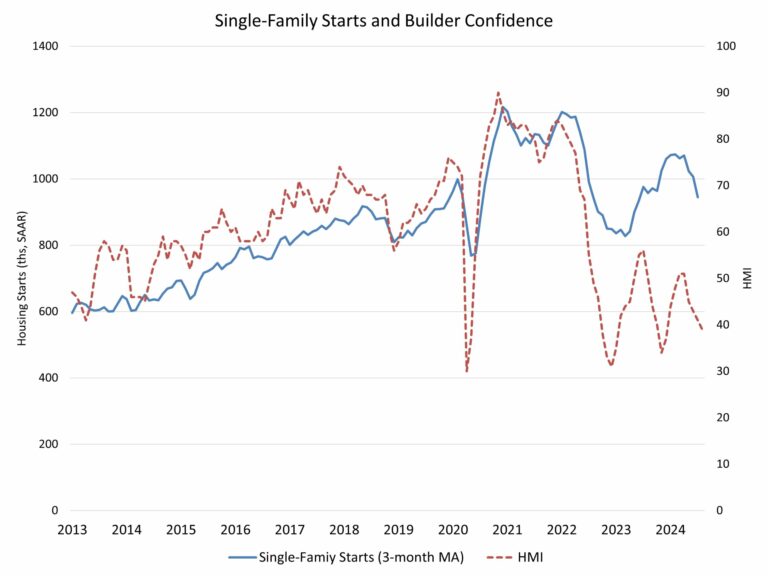
The July reading of 1.24 million starts is the number of housing units builders would begin if development kept this pace for the next 12 months. Within this overall number, single-family starts decreased 14.1% from an upwardly revised June figure to an 851,000 seasonally adjusted annual rate. However, on a year-to-date basis, single-family starts are up 11.4%.

The multifamily sector, which includes apartment buildings and condos, increased 14.5% to an annualized 387,000 pace.

The decline in new home construction mirrors our latest builder surveys (the NAHB/Wells Fargo HMI), which show that buyers remain concerned about challenging affordability conditions and builders are grappling with elevated rates for builder loans, a shortage of workers and lots, and supply chain concerns for some building materials.

Better inflation data points to the Federal Reserve moving to cut interest rates possibly as early as September, and with interest rates expected to moderate in the months ahead, this will help both buyers and builders who are dealing with tight lending conditions.

On a regional and year-to-date basis, combined single-family and multifamily starts are 1.3% lower in the Northeast, 5.1% lower in the Midwest, 5.4% lower in the South and 5.1% lower in the West.

Overall permits decreased 4.0% to a 1.40 million unit annualized rate in July. Single-family permits decreased 0.1% to a 938,000 unit rate. Multifamily permits decreased 11.1% to an annualized 458,000 pace.

Looking at regional data on a year-to-date basis, permits are 1.1% higher in the Northeast, 3.2% higher in the Midwest, 0.3% lower in the South and 4.1% lower in the West.

Single-family homes under construction fell back to a count of 653,000—down 4.1% compared to a year ago. The number of multifamily units under construction fell to an 886,000 count—down 13.2% compared to a year ago. The number of multifamily units under construction is now the lowest since July 2022.

Discover more from Eye On Housing

Subscribe to get the latest posts sent to your email.


This article was originally published by a eyeonhousing.org . Read the Original article here. .

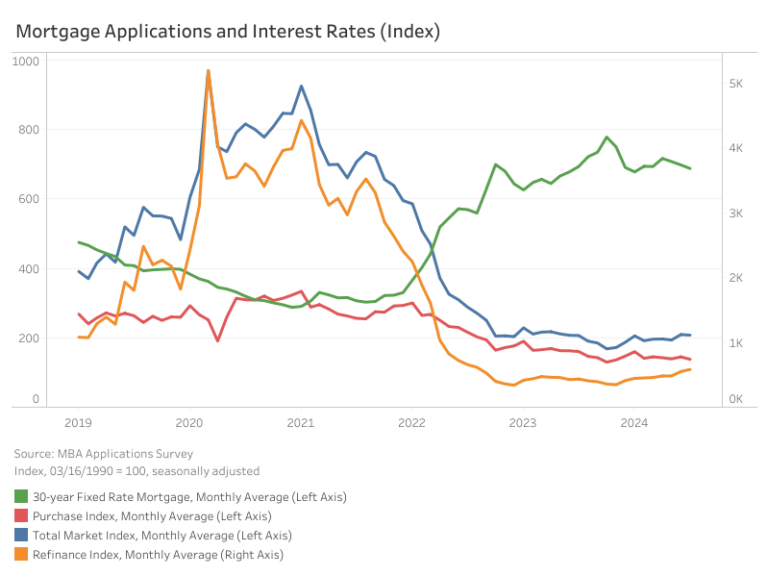
The Market Composite Index, a measure of mortgage loan application volume by the Mortgage Bankers Association’s (MBA) weekly survey, saw a slight month-over-month decline of 0.8% on a seasonally adjusted (SA) basis; compared to July 2023, the index increased by 0.5%. The Purchase Index declined by 4.8%, while the Refinance Index increased by 5.8%, month-over-month. On a yearly basis, the Purchase Index decreased by 13.9%, while the Refinance Index increased by 33.9%.

Meanwhile, the average monthly 30-year fixed mortgage rate continued to decline for three straight months with July seeing the largest decrease of 10 basis points (bps) to land an at 6.88% in July. The current rate is also lower than last July by 6 bps.

The average loan size for the total market (including purchases and refinances) is down by 1.5% from June to $367,900 on a non-seasonally adjusted (NSA) basis in July. Similarly, the month-over-month change for purchase loans decreased 1.6% to an average size of $424,200, while refinance loans increased by 2.5% to an average of $275,325. The average loan size for an adjustable-rate mortgage (ARM) decreased by 2.5% for the same period, from $1.03 million to $1.01 million.

Discover more from Eye On Housing

Subscribe to get the latest posts sent to your email.


This article was originally published by a eyeonhousing.org . Read the Original article here. .

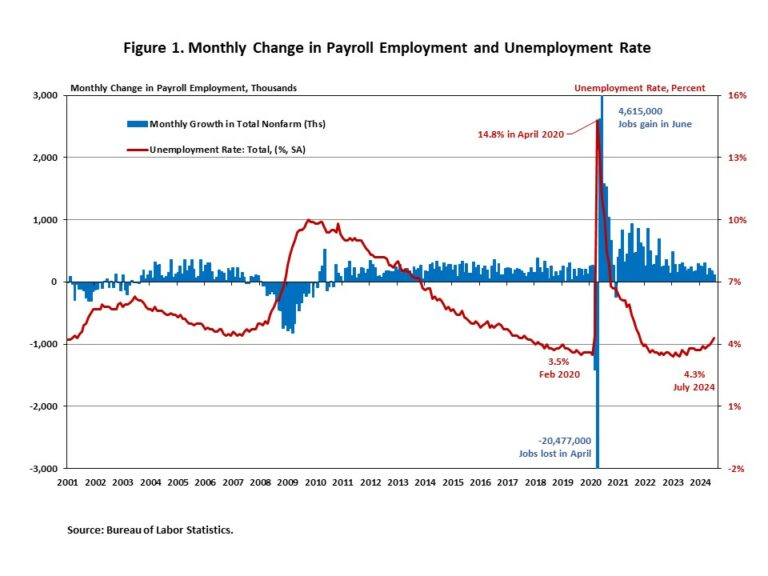
In July, job growth decelerated significantly, and the unemployment rate increased to a nearly three-year high of 4.3%. The July data indicates that the labor market is slowing, which signals monetary policy easing in the months ahead.

Additionally, wage growth slowed for the second month in a row. In July, wages grew at a 3.6% year-over-year (YOY) growth rate, down 1.0 percentage point from a year ago. This marks the lowest YOY wage gain in the past four years.

Total nonfarm payroll employment increased by 114,000 in July, following a downwardly revised increase of 179,000 jobs in June, as reported in the Employment Situation Summary. The estimates for the previous two months were revised down. The monthly change in total nonfarm payroll employment for May was revised down by 2,000, from +218,000 to +216,000, while the change for June was revised down by 27,000 from +206,000 to +179,000. Combined, the revisions were 29,000 lower than the original estimates.

Despite restrictive monetary policy, nearly 7.8 million jobs have been created since March 2022, when the Fed enacted the first interest rate hike of this cycle. In the first seven months of 2024, 1,419,000 jobs were created. Additionally, monthly employment growth averaged 203,000 per month, compared with the 251,000 monthly average gain for 2023.

In July, the unemployment rate rose for the fourth straight month to 4.3%, the highest rate since October 2021. The number of unemployed persons rose by 352,000, while the number of employed persons was barely changed.

Meanwhile, the labor force participation rate, the proportion of the population either looking for a job or already holding a job, rose 1.0 percentage point to 62.7% for July. Moreover, the labor force participation rate for people aged between 25 and 54 ticked up to 84.0%, the highest level since March 2001. While the overall labor force participation rate is still below its pre-pandemic levels at the beginning of 2020, the rate for people aged between 25 and 54 exceeds the pre-pandemic level of 83.1%.

For industry sectors, health care (+55,000), construction (+25,000), and transportation and warehousing (+14,000) have notable job gains in July, while information employment lost 20,000 jobs.

Employment in the overall construction sector increased by 25,000 in July, after 20,000 gains in June. While residential construction gained 9,100 jobs, non-residential construction employment added 16,200 jobs for the month.

Residential construction employment now stands at 3.4 million in July, broken down as 950,000 builders and 2.4 million residential specialty trade contractors. The 6-month moving average of job gains for residential construction was 6,067 a month. Over the last 12 months, home builders and remodelers added 67,600 jobs on a net basis. Since the low point following the Great Recession, residential construction has gained 1,387,400 positions.

In July, the unemployment rate for construction workers rose to 4.4% on a seasonally adjusted basis. The unemployment rate for construction workers remained at a relatively lower level, after reaching 15.3% in April 2020, due to the housing demand impact of the COVID-19 pandemic.

Discover more from Eye On Housing

Subscribe to get the latest posts sent to your email.


This article was originally published by a eyeonhousing.org . Read the Original article here. .

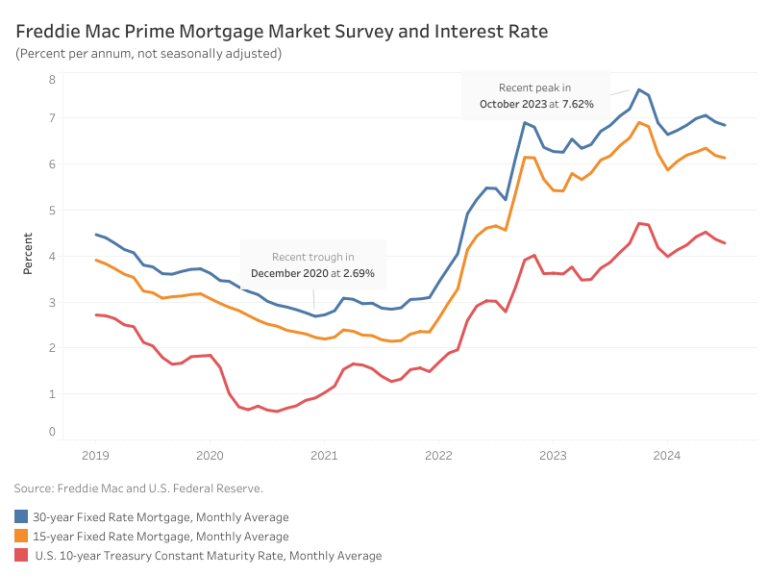
Mortgage rates continued to decrease in July, landing at an average rate of 6.85%. According to Freddie Mac, the average monthly rate fell by 7 basis points (bps) from June’s rate of 6.92%. This current rate is nearly identical to the rate from one year ago, which stood at 6.84%.

The 15-year fixed-rate mortgage also saw a decrease, dropping by 5 bps from June to 6.14%, and is now lower compared to last July by 4 bps. Additionally, the 10-year Treasury rate declined 9 bps from 4.37% in June to 4.28%.

Per the NAHB forecast, we expect 30-year mortgage rates to decline slightly to around 6.66% at the end of 2024 and eventually to decline to just under 6% by the end of 2025. The NAHB outlook anticipates the federal funds rate to be cut by 25 bps no later than the December Federal Reserve meeting and six more rate cuts in 2025 as inflation approaches the Fed’s policy target.

Discover more from Eye On Housing

Subscribe to get the latest posts sent to your email.


This article was originally published by a eyeonhousing.org . Read the Original article here. .
Pin It