Tag

July

Browsing


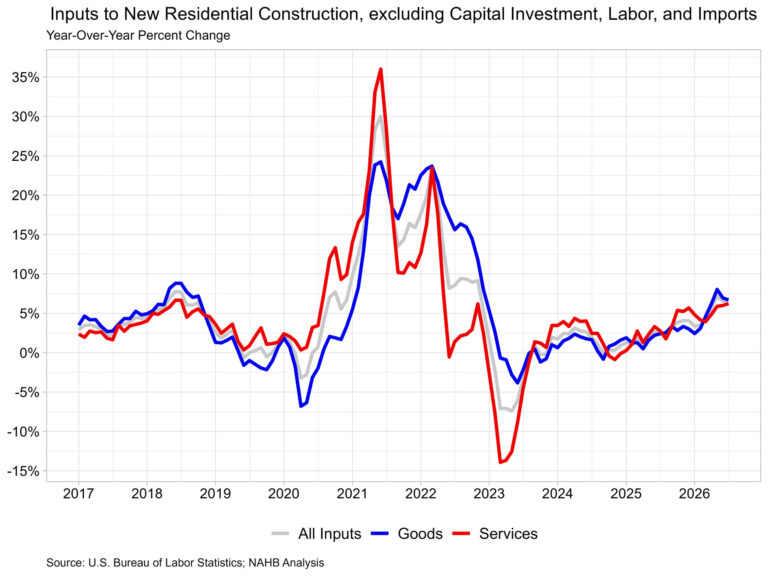
Residential building material prices, excluding energy, rose 0.4% in July and were up 5.0% from a year ago. Energy prices fell again in July but remained significantly higher than a year ago. Meanwhile, prices for services were down 0.3% over the month but were 6.2% higher than a year ago.

The Producer Price Index for final demand was unchanged in July, after falling 0.1% in June. Compared to a year ago, final demand prices were up 4.7%.  The index for final demand services rose 0.2% in July, while the index for final demand goods fell 0.7% over the month.

The price index for inputs to new residential construction fell 0.1% in July and was up 6.5% from last year. The price of goods used in new residential construction (including energy) was up 0.1% over the month and up 6.7% from last year, while the price of services was down 0.3% over the month and up 6.2% from last year.

Input Goods

The goods component has a larger importance to the inputs to residential construction price index, representing around 60% of the total. On a monthly basis, the price of input goods to new residential construction was up 0.1% in July after falling 0.7% in June.

The input goods to residential construction index can be further broken down into two separate components, one measuring energy inputs with the other measuring remaining goods. The latter of these two components simply represents building materials used in residential construction, which makes up around 93% of the goods index.

Energy input prices fell 2.4% in July but were 33.1% higher than a year ago. Building material prices were up 0.4% in July and up 5.0% compared to one year ago. The year-over-year percentage increase in building materials was the highest since December 2022.

Among building materials, softwood lumber prices rose significantly in July, as they were up 7.4% over the month. Softwood lumber prices were up 17.3% from one year ago. Ready-mix concrete prices were down 0.4% over the month and have only risen 2.2% from a year ago.

Input Services

Prices for service inputs to residential construction fell 0.3% in July. On a year-over-year basis, service input prices were up 6.2%. The price index for service inputs to residential construction can be broken out into three separate components: a trade services component, a transportation and warehousing services component, and a services excluding trade, transportation, and warehousing component (other services).

The most significant component is trade services (around 60%), followed by other services (around 29%), and finally transportation and warehousing services (around 11%). The largest component, trade services, was up 7.0% from a year ago. The price of transportation and warehousing services rose 10.9%, while prices for other services were up 2.5% over the year.


This article was originally published by a eyeonhousing.org . Read the Original article here. .


Led by declines in gasoline and diesel prices, inflation eased for the second consecutive month after reaching a three-year high in May. As energy prices moderated, shelter resumed its role as the largest driver of headline inflation, accounting for one-third of the annual increase and over two-thirds of the monthly increase. Though easing inflation and a cooling labor market reduced pressure for Fed rate hikes, renewed tensions with Iran could keep inflation elevated in coming months, complicating the Fed’s path forward.

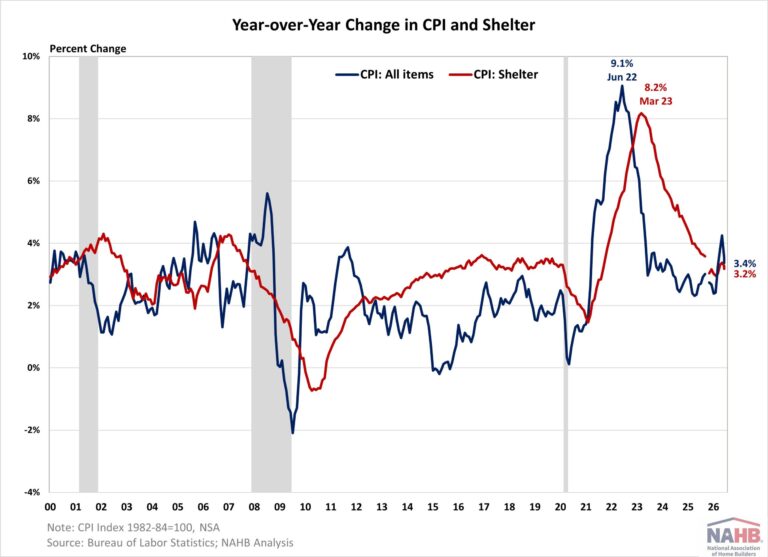
On a non-seasonally adjusted basis, the Consumer Price Index (CPI) rose by 3.4% in July from a year ago, following a 3.5% increase last month, according to the BLS latest report. The “core” CPI, excluding the volatile food and energy components, increased by 2.5% over the past twelve months, following a 2.6% increase in June. The housing shelter index, which makes up a large portion of “core” CPI, rose 3.2% over the year, following a 3.3% increase last month. Meanwhile, the component index for food rose by 3.0%, and the energy component index increased by 14.7%.

On a monthly basis, the CPI rose by 0.1% in July (seasonally adjusted), while the “core” CPI increased by 0.2%.

The price index for a broad set of energy sources decreased by 1.5% in July, as declines in gasoline (-2.9%) and fuel oil (-1.7%) were partially offset by minor increases in natural gas (+0.7%) and electricity (+0.1%). Meanwhile, food at home index decreased by 0.1% and food away from home index rose by 0.3 in July.

Outside of energy, other top contributors that rose in July included indexes for medical care (+0.4%), airline fares (+2.2%), communication (+0.6%), education (+0.5%) and recreation (+0.2%). Meanwhile, the index for motor vehicle insurance (-0.3%) was among the major indexes that decreased over the month.

The index for shelter, which makes up more than 40% of the “core” CPI, rose by 0.1% in July, matching last month as the smallest monthly increase since January 2021. Both the index for owners’ equivalent rent (OER) and rent of primary residence (RPR) increased by 0.3% over the month. NAHB constructs a “real” rent index to indicate whether inflation in rents is faster or slower than core inflation. It provides insight into the supply and demand conditions for rental housing. When inflation in rents is rising faster than core inflation, the real rent index rises and vice versa. The real rent index is calculated by dividing the price index for rent by the core CPI (to exclude the volatile food and energy components). In July, the Real Rent Index was unchanged.


This article was originally published by a eyeonhousing.org . Read the Original article here. .

Mortgage application activity slowed in July amid continuation of the war in Iran. The Mortgage Bankers Association’s (MBA) Market Composite Index, a measure of total mortgage application volume, declined 6.6% month-over-month in July on a seasonally adjusted basis. Compared to a year ago, total mortgage applications declined 1.5%, the first year-over-year decline in two years.

The market decline occurred in both major components. Purchase applications decreased 6.4% from June, while refinance applications declined 7.2%. Relative to July 2025, purchase and refinance activities were also down 2.4% and 0.1%, respectively.

The slowdown coincided with higher borrowing costs as ongoing conflict in Iran pushed the average contract rate for a 30-year fixed-rate mortgage up 11 basis points (bps) to 6.70%. Nonetheless, the rate remained 12 bps lower than its level a year ago.

By loan type, applications for adjustable-rate mortgages (ARMs) and fixed-rate mortgages (FRMs) decreased 12.5% and 6.1% month-over-month. Compared with a year earlier, ARM application volume was unchanged, while FRM applications declined 1.6%. ARMs, including both purchase and refinance loans, accounted for 7.7% of total applications on a non-seasonally adjusted basis in July. This was 0.5 percentage points lower than in June and 0.1 percentage points higher than the share recorded a year earlier. The average contract interest rate for 5/1 ARMs was 5.9% in July.

Average loan sizes declined across all categories in July. The overall loan size decreased 2.5% to $383,600. The average purchase loan size fell 2.6% to $444,600, while the average refinance loan size declined 2.2% to $296,000. The average ARM loan size edged down 0.7% to $937,600.


This article was originally published by a eyeonhousing.org . Read the Original article here. .

Existing home sales continued to slow in July as record-high home prices and elevated mortgage rates weighed on buyers. Mortgage rates resumed an upward trend after the ceasefire ended in early July. Heightened geopolitical uncertainty and an increasingly hawkish stance from the Fed pushed rates to nearly 6.7% last week, the highest level since July 2025. Recent monthly volatility reflects home buyer sensitivity to mortgage rate changes, suggesting the market would respond quickly if rates returned to near 6%.

Total existing home sales, including single-family homes, townhomes, condominiums, and co-ops, fell 1.7% to a seasonally adjusted annual rate of 4.06 million in July, according to the National Association of Realtors (NAR). On a year-over-year basis, sales were 0.7% higher than a year ago.

The existing home inventory level was 1.54 million units in July, down 1.9% from June and down 0.6% from a year ago. At the current sales rate, July unsold inventory sits at a 4.6-months’ supply, unchanged from last month and a year ago. Inventory between 4.5 to 6 months’ supply is generally considered a balanced market.

Homes stayed on the market for a median of 29 days in July, up from 28 days in the previous month and July 2025.

The first-time buyer share was 29% in July. The share was down from 33% in June but up from 28% a year ago.

The July all-cash sales share was 26% of transactions, up from 25% last month but down from 31% in July 2025. All-cash buyers are less affected by changes in interest rates.

The July median sales price of all existing homes was $434,100, up 2.0% from last year. This marks the 37th consecutive month of year-over-year increases. The median condominium/co-op price in July was up 2.2% from a year ago at $371,800. Recent gains for home inventory will put downward pressure on resale home prices in most markets in 2026.

Existing home sales in July were mixed across the four major regions. Sales fell in the South (-3.1%) and Midwest (-2.0%) but rose in the Northeast (+2.0%). Sales in the West were unchanged in July. On a year-over-year basis, sales increased in the Midwest (+2.1%) and West (+1.4%) but remained unchanged in the Northeast and the South.

The Pending Home Sales Index (PHSI) is a forward-looking indicator based on signed contracts. The PHSI rose from 76.6 to 72.5 in June, the lowest reading since January 2026. On a year-over-year basis, pending sales were 0.3% lower than a year ago, according to the National Association of Realtors’ data.


This article was originally published by a eyeonhousing.org . Read the Original article here. .


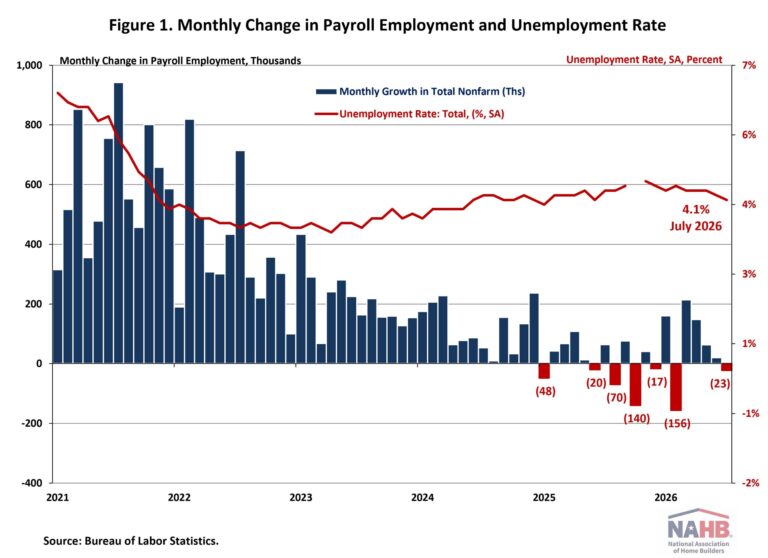
The U.S. labor market weakened in July, with nonfarm payrolls down 23,000 and downward revisions cutting another 103,000 jobs from May and June. Although the unemployment rate edged lower to 4.1%, the decline reflected a smaller labor force rather than stronger hiring, as overall participation fell to its lowest level since early 2021. July marked the 7th monthly job loss over the last year and a half.

Wage growth also cooled, with average hourly earnings rising 3.2% year-over-year in July to $37.62, down from 3.4% in June and the slowest pace of 2026. Despite the slowdown, wage gains continue to outpace inflation, consistent with productivity-supported real wage growth.

National Employment

According to the Employment Situation Summary reported by the Bureau of Labor Statistics (BLS), total nonfarm payroll employment decreased by 23,000 in July, following a downwardly revised gain of 20,000 in June. Revisions to prior months were broadly negative again this month. The change for May was revised down by 66,000, from a preliminarily reported +129,000 to +63,000, while the change for June was revised down by 37,000, from a preliminary +57,000 to +20,000. Combined, these revisions subtracted 103,000 jobs from previously reported totals, compared with the 74,000 downward revision reported in the prior month.

Job growth in 2026 has moderated further. Through July, monthly payroll gains have averaged 61,000 on the current data vintage, down from the 92,000 pace reported through June, reflecting both July’s soft print and the downward revisions to May and June. This compares with an average of just 10,000 per month in 2025 and 122,000 per month in 2024. Over the past 12 months, total nonfarm employment has grown by 316,000 in total, a considerably slower pace of expansion than earlier in the cycle.

The unemployment rate declined to 4.1% in July from 4.2% in June. The decrease was driven by a shrinking labor force rather than stronger hiring. Over the month, the number of unemployed persons fell by 178,000 to 6.9 million, while the number of employed persons declined by 87,000. Combined, the civilian labor force contracted by 264,000 in July.

Meanwhile, the labor force participation rate—the proportion of the population either looking for a job or already holding a job—fell 0.1 percentage point to 61.4% in July. This marks the lowest level since February 2021 and remains well below its pre-pandemic level of 63.3% recorded at the start of 2020. Among prime working-age individuals (aged 25 to 54), the participation rate rose 0.1 percentage point to 83.4%, partially reversing June’s sharp 0.6-point decline and suggesting that the drop in labor force participation in July was not widespread.

Industry-level results were mixed in July. Employment declined in local government education (-50,000) and retail trade (-19,000), while financial activities continued to trend down (-14,000). Health care employment continued to increase (+22,000), although at a slower pace than its average monthly gain over the prior 12 months. The July release also showed an increase in temporary layoffs, with the number of people on temporary layoff rising to 921,000.

Construction Employment

Employment in the overall construction sector rose by 22,000 jobs in July, following a gain of 5,000 in June. Within the industry, residential construction employment edged up by 2,100, its first monthly increase in four months, while non-residential construction added approximately 20,000 jobs.

Residential construction employment stood at 3.3 million in July, including 914,600 workers employed by builders and remodelers, down from 915,100 in June, and 2.3 million residential specialty trade contractors.

The six-month moving average of job gains for residential construction employment remains negative, reflecting an average monthly loss of approximately 5,350 jobs and declines in four of the past six months. Over the last 12 months, residential construction has shed a net of 44,200 jobs, marking the seventeenth consecutive month of year-over-year decline. Despite these losses, residential construction employment remains 1,281,200 positions above its post-Great Recession low, with that cushion widening modestly from 1,279,100 in June as July’s small gain offset part of the prior months’ losses.

Meanwhile, the unemployment rate for construction workers fell to 4.6% in July on a seasonally adjusted basis, down sharply from 6.2% in June. A year earlier, the construction unemployment rate stood at 4.2%. Despite the month-to-month volatility, the year-over-year comparison still points to modestly softer conditions for the trades than a year ago.


This article was originally published by a eyeonhousing.org . Read the Original article here. .


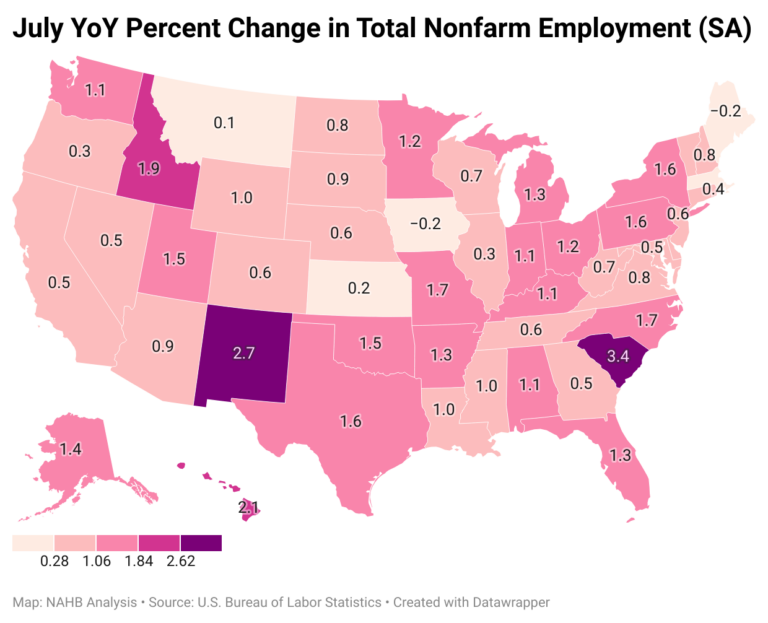
Nonfarm payroll employment increased in 30 states and the District of Columbia in July compared to the previous month, while decreasing in 20 states. According to the Bureau of Labor Statistics, nationwide total nonfarm payroll employment increased by 73,000 in July, falling short of expectations and following significant downward revisions to the previous two months’ figures.

On a month-over-month basis, employment data was most favorable in New York, which added 55,500 jobs. Missouri came in second (+17,100), followed by California (+15,000). Meanwhile, a total of 37,100 jobs were lost across 20 states, with Utah reporting the steepest job losses at 5,200. In percentage terms, employment increased the highest in Missouri at 0.6%, while Wyoming saw the largest decline at 0.5% between June and July.

Year-over-year ending in July, 1.5 million jobs have been added to the labor market, which is a 1.0% increase compared to the July 2024 level. The range of job gains spanned from 400 jobs in Montana to 232,500 jobs in Texas. Two states and the District of Columbia lost a total of 8,900 jobs in the past 12 months, with the District of Columbia reporting the steepest job losses at 4,200. In percentage terms, the range of job growth spanned 0.1% in Montana to 3.4% in South Carolina. The range of job losses in Maine, Iowa, and the District of Columbia spanned 0.2%-0.5%.

Construction Employment

Across the nation, construction sector jobs data —which includes both residential and non-residential construction—showed that 22 states reported an increase in July compared to June, while 22 states lost construction sector jobs. The six remaining states and the District of Columbia reported no change on a month-over-month basis. Colorado, with the highest increase, added 3,800 construction jobs, while California, on the other end of the spectrum, lost 3,300 jobs. Overall, the construction industry added a net 2,000 jobs in July compared to the previous month. In percentage terms, Oregon reported the highest increase at 2.6% and Wyoming reported the largest decline at 3.4%.

Year-over-year, construction sector jobs in the U.S. increased by 96,000, which is a 1.2% increase compared to the July 2024 level. Texas added 27,000 jobs, which was the largest gain of any state, while California lost 18,200 construction sector jobs. In percentage terms, New Mexico had the highest annual growth rate in the construction sector at 14.3%. During this period, New Jersey reported the largest decline of 4.9%.

Discover more from Eye On Housing

Subscribe to get the latest posts sent to your email.


This article was originally published by a eyeonhousing.org . Read the Original article here. .

Prices for residential building materials rose again in July, marking the largest year-over-year increase in over two years. The underlying price growth trend remained the same, with service prices continuing to grow at a faster pace than goods prices. Similar to last month, parts for construction machinery and metal molding/trim experienced significant price growth, as both increased over 25% compared to last year.

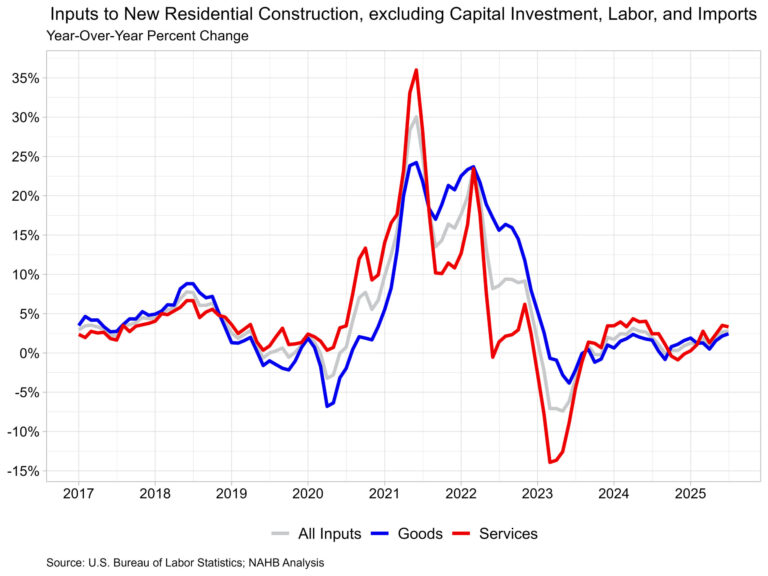
Prices for inputs to new residential construction—excluding capital investment, labor, and imports—rose 0.2% in July, following a 0.8% increase in June. These figures are taken from the most recent Producer Price Index (PPI) report published by U.S. Bureau of Labor Statistics. The PPI measures prices that domestic producers receive for their goods and services; this differs from the Consumer Price Index which measures what consumers pay and includes both domestic products as well as imports.

The inputs to the new residential construction price index grew 2.8% from July of last year. The index can be broken into two components­—the goods component increased 2.4% over the year, while services increased 3.3%. For comparison, the total final demand index, which measures all goods and services across the economy, increased 3.3% over the year, with final demand with respect to goods up 1.9% and final demand for services up 4.0%.

Input Goods

The goods component has a larger importance to the total residential construction inputs price index, representing around 60%. On a monthly basis, the price of input goods to new residential construction was up 0.4% in July.

The input goods to residential construction index can be further broken down into two separate components, one measuring energy inputs with the other measuring remaining goods. The latter of these two components simply represents building materials used in residential construction, which makes up around 93% of the goods index.

Energy input prices jumped up 3.9% between June and July but were 8.1% lower than one year ago. Building material prices were up 0.2% between June and July and up 3.3% compared to one year ago.

Tariffs on building materials do not directly show up in the PPI data because the PPI measures prices for domestically produced goods and services. In fact, tariffs and taxes are explicitly excluded from the PPI. Despite this, price changes in reaction to tariffs are included in the PPI, meaning price increases to pass on increased costs of materials will show up in this pricing data.  Announced tariffs in recent months have resulted in material increases across a few different goods, specifically certain metal products and equipment.

In July, the largest year-over-year input price increase was for construction machinery and equipment parts, reporting a 31.4% increase over the year. Meanwhile, metal molding and trim prices were up 25.6%, fabricated steel plate prices were up 14.3%, and nonferrous wire/cable up 10.5%. Metal commodities have been the primary targets of tariffs, with 50% tariffs in effect on steel and aluminum products and a 50% tariff on semifinished products of copper.

Input Services

Prices for service inputs to residential construction reported a decrease of 0.2% in July. On a year-over-year basis, service input prices are up 3.3%. The price index for service inputs to residential construction can be broken out into three separate components: a trade services component, a transportation and warehousing services component, and a services excluding trade, transportation and warehousing component (other services).

 The most significant component is trade services (around 60%), followed by other services (around 29%), and finally transportation and warehousing services (around 11%). The largest component, trade services, was up 5.2% from a year ago. The other services component was up 1.2% over the year.  Lastly, prices for transportation and warehousing services fell 0.6% compared to July of last year.

Inputs to New Construction Satellite Data

Within the PPI that BLS publishes, new experimental data was recently published regarding inputs to new construction. The data expands existing inputs to industry indexes by incorporating import prices with prices for domestically produced goods and services. With this additional data, users can track how industry input costs are changing among domestically produced products and imported products. This data focuses on new construction, but the complete dataset includes indices across numerous industries that can be found here on the BLS website.

New construction input prices are primarily influenced by domestically produced goods and services, with domestic products accounting for 90% of the weight of the industry index for new construction. Imported goods make up the remaining 10% of the index.

The latest available data, for May 2025, showed that domestically produced goods have experienced faster price growth compared to imported goods used in new construction. On a year-over-year basis, the index for domestic goods increased 1.6%, while prices for imported goods rose 0.1% over the same period. Comparatively, service prices have risen more than good prices over the past year, rising 2.7% year-over-year. Across the three indexes, all inputs remain at higher levels compared to pre-pandemic prices.

Discover more from Eye On Housing

Subscribe to get the latest posts sent to your email.


This article was originally published by a eyeonhousing.org . Read the Original article here. .

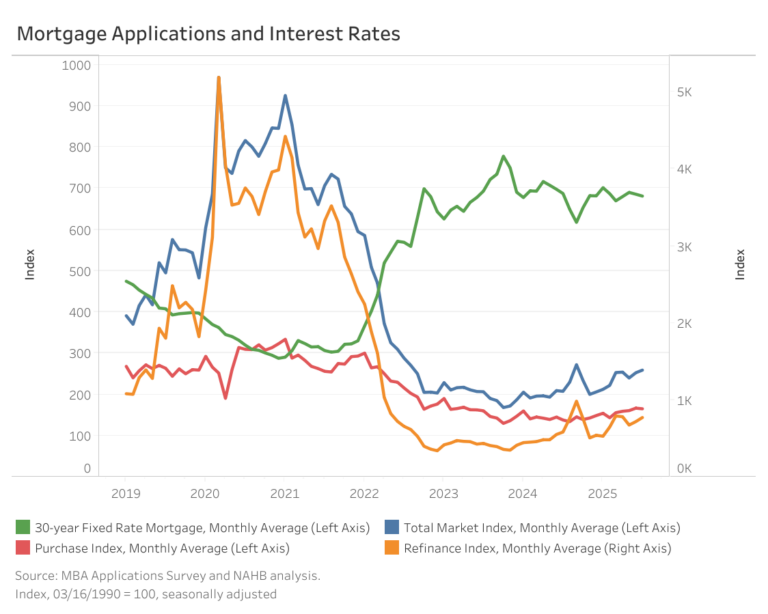
Mortgage application activity picked up in July as interest rates eased modestly. The Mortgage Bankers Association’s (MBA) Market Composite Index, which tracks mortgage application volume, rose 2.4% from June on a seasonally adjusted basis. Compared to July 2024, total applications were up 24.5%.

The average contract rate for 30-year fixed mortgages edged down by 4 basis points to 6.8%. While refinancing increased by 7.4%, purchase applications slipped 1.2% as high home prices and mortgage rates continued to keep homebuyers on the sideline. Year-over-year, the 30-year rate was 6 basis points lower, with purchase and refinance applications up 19.6% and 32.2%, respectively.

Loan sizes continued to trend downward for the third consecutive month. The average loan amount across all loan types declined 1.7% to $376,500. Purchase loan sizes fell 2.5% to $428,800, while refinance loans increased 3.0% to $299,300. Adjustable-rate mortgage (ARM) loan sizes saw the largest decline among all loan types, falling 6.6% to $957,500 from $1.03 million.   

Discover more from Eye On Housing

Subscribe to get the latest posts sent to your email.


This article was originally published by a eyeonhousing.org . Read the Original article here. .

Average mortgage rates dipped in July, according to Freddie Mac. The average 30-year fixed-rate mortgage was 6.72%, 10 basis points (bps) lower than June. Meanwhile, the 15-year rate declined 9 bps to average at 5.86%. Compared to a year ago, the 30-year rate is down 13 basis points (bps), and the 15-year rate is 28 bps lower.

The 10-year Treasury yield, a key benchmark for long-term borrowing, averaged 4.37% in July – a 6 bps decline from the previous month. Yields began the month lower but reversed course and rose steadily as investor expectations solidified that the Federal Reserve would maintain its current policy stance. These expectations were driven by economic data showing an uptick in inflation while the economy and labor market remained solid.

On July 30, the Federal Open Market Committee (FOMC) solidified market expectations by voting to keep the federal funds rate unchanged at 4.25% to 4.50%. However, just days later, the July employment report released by the Bureau of Labor Statistics on Friday, August 1, showed downward revisions to job gains in May and June. In response, yields fell to around 4.2% as investors perceived an increased likelihood of a rate cut at the Fed’s next meeting in September.

Discover more from Eye On Housing

Subscribe to get the latest posts sent to your email.


This article was originally published by a eyeonhousing.org . Read the Original article here. .

Builder confidence for future sales expectations received a slight boost in July with the extension of the 2017 tax cuts, but elevated interest rates and economic and policy uncertainty continue to act as headwinds for the housing sector.

Builder confidence in the market for newly built single-family homes was 33 in July, up one point from June, according to the National Association of Home Builders (NAHB)/Wells Fargo Housing Market Index (HMI). Builder sentiment has now been in negative territory for 15 consecutive months.

The July HMI survey revealed that 38% of builders reported cutting prices in July, the highest percentage since NAHB began tracking this figure on a monthly basis in 2022. This compares with 37% of builders who reported cutting prices in June, 34% in May and 29% in April. Meanwhile, the average price reduction was 5% in July, the same as it’s been every month since last November. The use of sales incentives was 62% in July, unchanged from June.

Consistent with ongoing weakness for the HMI, single-family housing starts will post a decline in 2025 due to ongoing housing affordability challenges per the latest NAHB forecast. Single-family permits are down 6% on a year-to-date basis and builder traffic in the HMI is at a more than two-year low.

Derived from a monthly survey that NAHB has been conducting for more than 40 years, the NAHB/Wells Fargo HMI gauges builder perceptions of current single-family home sales and sales expectations for the next six months as “good,” “fair” or “poor.” The survey also asks builders to rate traffic of prospective buyers as “high to very high,” “average” or “low to very low.” Scores for each component are then used to calculate a seasonally adjusted index where any number over 50 indicates that more builders view conditions as good than poor.

The HMI index gauging current sales conditions rose one point in July to a level of 36 while the component measuring sales expectations in the next six months increased three points to 43. The gauge charting traffic of prospective buyers posted a one-point decline to 20, the lowest reading since end of 2022.

Looking at the three-month moving averages for regional HMI scores, the Northeast increased two points to 45, the Midwest held steady at 41, the South dropped three points to 30 and the West declined three points to 25.

The HMI tables can be found at nahb.org/hmi.

Discover more from Eye On Housing

Subscribe to get the latest posts sent to your email.


This article was originally published by a eyeonhousing.org . Read the Original article here. .

Pin It