Tag

Increases

Browsing


Confidence in the market increased for multifamily developers in the second quarter of 2025, according to  the Multifamily Market Survey (MMS) released today by the National Association of Home Builders (NAHB).  The MMS produces two separate indices.  The Multifamily Production Index (MPI) was up two points year-over-year to 46.  The Multifamily Occupancy Index (MOI) had a reading of 82, up one point year-over-year.

Multifamily developer confidence experienced a slight increase compared to last year, most notably from the subsidized subcomponent.  This is due in part to optimism surrounding the expansion of federal affordable housing resources flowing from the recent congressional reconciliation bill.  However, high interest rates, rising construction costs, limited land availability and restrictive local regulations are still significant issues in certain parts of the country.  Even with these headwinds, multifamily starts are becoming less constrained as the number of apartments under construction falls and normalizes.  As a result, NAHB is forecasting starts to be modestly higher in 2025 compared to 2024, but well below levels experienced in 2023.

Multifamily Production Index (MPI)

The MMS asks multifamily developers to rate the current conditions as “good”, “fair”, or “poor” for multifamily starts in markets where they are active.  The index and all its components are scaled so that a number above 50 indicates that more respondents report conditions as good rather than poor. The MPI is a weighted average of four key market segments: three in the built-for-rent market (garden/low-rise, mid/high-rise, and subsidized) and the built-for-sale (or condominium) market.

Two components experienced year-over-year increases: the component measuring subsidized units jumped 10 points to 61 and the components measuring mid/high-rise rose seven points to 36.   The component measuring garden/low-rise and built-to-sale units both fell three points year-over-year to 50 and 35, respectively.

Multifamily Occupancy Index (MOI)

The survey also asks multifamily property owners to rate the current conditions for occupancy of existing rental apartments, in markets where they are active, as “good”, “fair”, or “poor”.  Like the MPI, the MOI and all its components are scaled so that a number above 50 indicates more respondents report that occupancy is good than report it as poor.  The MOI is a weighted average of three built-for-rent market segments (garden/low-rise, mid/high-rise and subsidized). 

Two of the three MOI components experienced year-over-year increases in the second quarter of 2025.  The component measuring subsidized units rose by five points to 90 and the garden/low-rise component increased two points to 84.  Meanwhile, the component measuring mid/high-rise units fell three points to 73.  Nevertheless, all three MOI components remain well above the break-even point of 50.

The MMS was re-designed in 2023 to produce results that are easier to interpret and consistent with the proven format of other NAHB industry sentiment surveys.  Until there is enough data to seasonally adjust the series, changes in the MMS indices should only be evaluated on a year-over-year basis.

Please visit NAHB’s MMS web page for the full report.

Discover more from Eye On Housing

Subscribe to get the latest posts sent to your email.


This article was originally published by a eyeonhousing.org . Read the Original article here. .

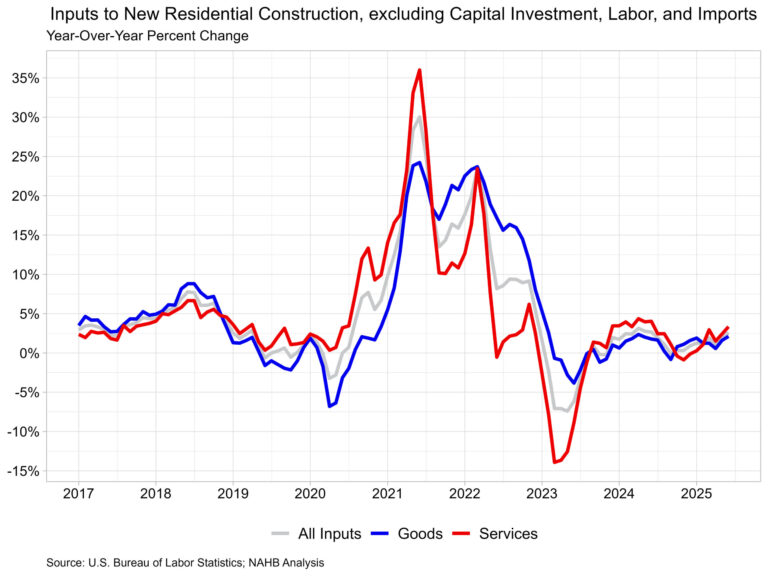
Residential building material prices rose in June, driven primarily by higher construction machinery and equipment part prices. Metal commodities also experienced significant increases, following recently implemented tariffs on steel and aluminum.  Meanwhile, price growth for services used in construction continues to outpace both domestic and imported goods. 

Prices for inputs to new residential construction—excluding capital investment, labor, and imports—rose 0.7% in June, following a (revised) flat change in May. These figures are taken from the most recent Producer Price Index (PPI) report published by U.S. Bureau of Labor Statistics. The PPI measures prices that domestic producers receive for their goods and services; this differs from the Consumer Price Index which measures what consumers pay and includes both domestic products as well as imports.  

The inputs to the New Residential Construction Price Index grew 2.6% from June of last year. The index can be broken into two components—the goods component increased 2.1% over the year, while services increased 3.3%. For comparison, the total final demand index, which measures all goods and services across the economy, increased 2.3% over the year, with final demand with respect to goods up 1.7% and final demand for services up 2.7%. 

Input Goods

The goods component has a larger importance to the total residential construction inputs price index, representing around 60%. On a monthly basis, the price of input goods to new residential construction was up 0.2% in June.  

The input goods to residential construction index can be further broken down into two separate components, one measuring energy inputs with the other measuring remaining goods. The latter of these two components simply represents building materials used in residential construction, which makes up around 93% of the goods index.  

Energy input prices were up 0.9% between May and June but were 7.4% lower than one year ago. Building material prices were up 0.1% between May and June and up 2.9% compared to one year ago.  

Tariffs on building materials do not directly show up in the PPI data because the PPI measures prices for domestically produced goods and services. In fact, tariffs and taxes are explicitly excluded from the PPI. Despite this, price changes in reaction to tariffs are included in the PPI, meaning price increases to pass on increased costs of materials will show up in this pricing data. Announced tariffs in recent months have resulted in material increases across a few different goods, specifically certain metal products and equipment.

In June, the largest year-over-year price increase was for construction machinery and equipment parts, reporting a 24.2% increase over the year. Meanwhile, metal molding and trim prices were up 15.1%, fabricated steel plate prices were up 13.6%, ornamental and architectural metal work prices were up 9.0%, and fabricated structural metal prices were up 9.0% compared to last year. Metal commodities have been the primary targets of tariffs, with 50% tariffs in effect on steel and aluminum products and a potential 50% tariff on copper products coming this August.

Input Services

Prices for service inputs to residential construction reported an increase of 1.5% in June. On a year-over-year basis, service input prices are up 3.3%. The price index for service inputs to residential construction can be broken out into three separate components: a trade services component, a transportation and warehousing services component, and a services excluding trade, transportation and warehousing component (other services).

The most significant component is trade services (around 60%), followed by other services (around 29%), and finally transportation and warehousing services (around 11%). The largest component, trade services, was up 4.7% from a year ago. The other services component was up 1.1% over the year. Lastly, prices for transportation and warehousing services advanced 2.1% compared to June of last year.

Inputs to New Construction Satellite Data

Within the PPI that BLS publishes, new experimental data was recently published regarding inputs to new construction. The data expands existing inputs to industry indexes by incorporating import prices with prices for domestically produced goods and services. With this additional data, users can track how industry input costs are changing among domestically produced products and imported products. This data focuses on new construction, but the complete dataset includes indices across numerous industries that can be on the BLS website.

New construction input prices are primarily influenced by domestically produced goods and services, with domestic products accounting for 90% of the weight of the industry index for new construction. Imported goods make up the remaining 10% of the index.  

The latest available data, for April 2025, showed that domestically produced goods have experienced faster price growth compared to imported goods used in new construction. On a year-over-year basis, the index for domestic goods increased 0.4%, while prices for imported goods fell 0.1% over the same period. Comparatively, service prices have risen more than good prices over the past year, rising 3.1% year-over-year. Across the three indexes, all inputs remain at higher levels compared to pre-pandemic prices.  

Discover more from Eye On Housing

Subscribe to get the latest posts sent to your email.


This article was originally published by a eyeonhousing.org . Read the Original article here. .


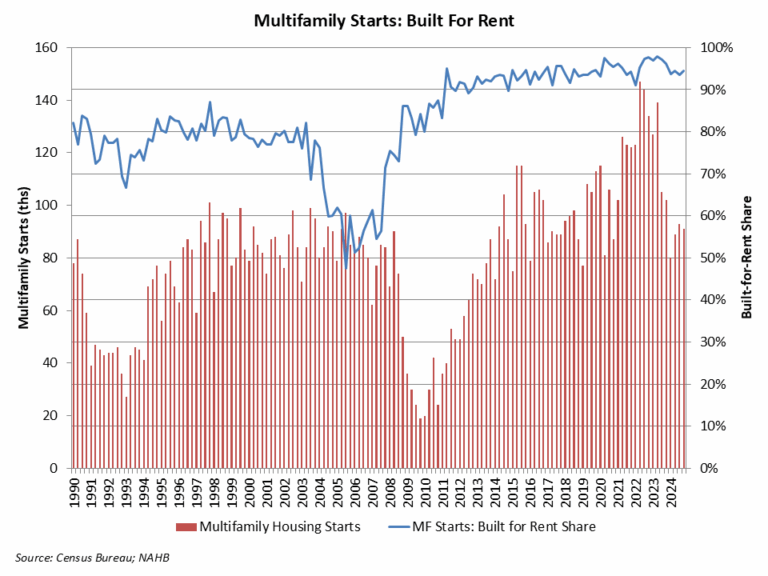
According to NAHB analysis of quarterly Census data, the count of multifamily, for-rent housing starts declined during the fourth quarter of 2024. For the quarter, 91,000 multifamily residences started construction. Of this total, 86,000 were built-for-rent. This was almost 12% lower than the fourth quarter of 2023.

The market share of rental units of multifamily construction starts ticked higher to 95% for the fourth quarter. A historical low market share of 47% for bult-for-rent multifamily construction was set during the third quarter of 2005, during the condo building boom. An average share of 80% was registered during the 1980-2002 period.

For the fourth quarter, there were 5,000 multifamily condo unit construction starts, up from 4,000 a year ago.

An elevated rental share of multifamily construction is holding typical apartment size below levels seen during the pre-Great Recession period. However, according to the fourth quarter 2024 data, the average square footage of multifamily construction starts moved higher to 1,129 square feet. The median edged up to 1,039 square feet. These are notable moves higher off of multidecade lows.

Discover more from Eye On Housing

Subscribe to get the latest posts sent to your email.


This article was originally published by a eyeonhousing.org . Read the Original article here. .

An expected impact of the virus crisis was a need for more residential space, as people used homes for more purposes including work. Home size correspondingly increased in 2021 as interest rates reached historic lows. However, as interest rates increased in 2022 and 2023, and housing affordability worsened, the demand for home size has trended lower. As markets expect some decline for long-term interest rates, will new single-family home size reverse and move higher in 2025? Data from the end of 2024 suggests this may be occurring.

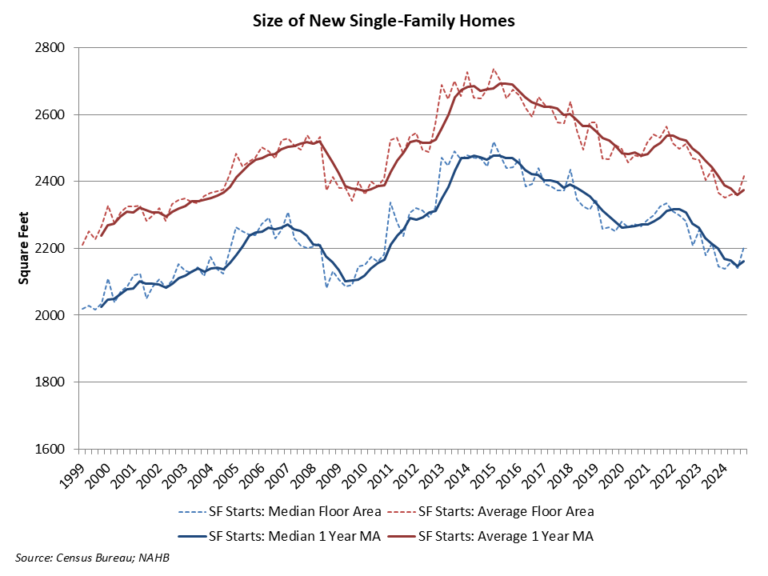
According to fourth quarter 2024 data from the Census Quarterly Starts and Completions by Purpose and Design and NAHB analysis, median single-family square floor area was 2,205 square feet, the highest reading since mid-2023. Average (mean) square footage for new single-family homes registered at 2,417 square feet.

The average size of a new single-family home, on a one-year moving average basis, trended higher to 2,373 square feet, while the median size is at 2,162 square feet.

Home size increased from 2009 to 2015 as entry-level new construction lost market share. Home size declined between 2016 and 2020 as more starter homes were developed. After a brief increase during the post-COVID building boom, home size has trended lower due to declining affordability conditions. As interest rates decline, new home size could level off and increase on a sustained basis in the quarters ahead.

Discover more from Eye On Housing

Subscribe to get the latest posts sent to your email.


This article was originally published by a eyeonhousing.org . Read the Original article here. .


Two Hands InteriorsSave Photo
Defend Your Claim to Quality

Make it clear that you place great emphasis on quality and that quality has its price. After all, you want to work with clients who appreciate good work and are willing to pay for it. This willingness on the part of your client may (or may not) become apparent early on.

Luisa Haase-Kiewning of Lu Interior Berlin, for example, started charging an extra fee several years ago. She charges for her time spent on the initial meeting as well as for travel time. This is justified as she arrives prepared and with good ideas after completing a certain amount of preparatory work prior to meeting with her clients.

And remember, if your client is not willing to pay for quality, it could be a warning sign that working together may not be smooth — or possible.

Lara Theel, managing director of Stand Out Design, recommends a similar approach. Explain to your clients, from the smallest to the largest items, how rising prices have affected the elements and materials in their project. Point out how companies that don’t pass along some of the current price increases are cutting back in other places.

Theel and her team focus on “longevity, quality and sustainability” and customers appreciate that.

Tip: Positive reviews on your Houzz profile and a visible Best of Houzz award help build trust and distinguish your excellent work from competitors.


This article was originally published by a
www.houzz.com . Read the Original article here. .


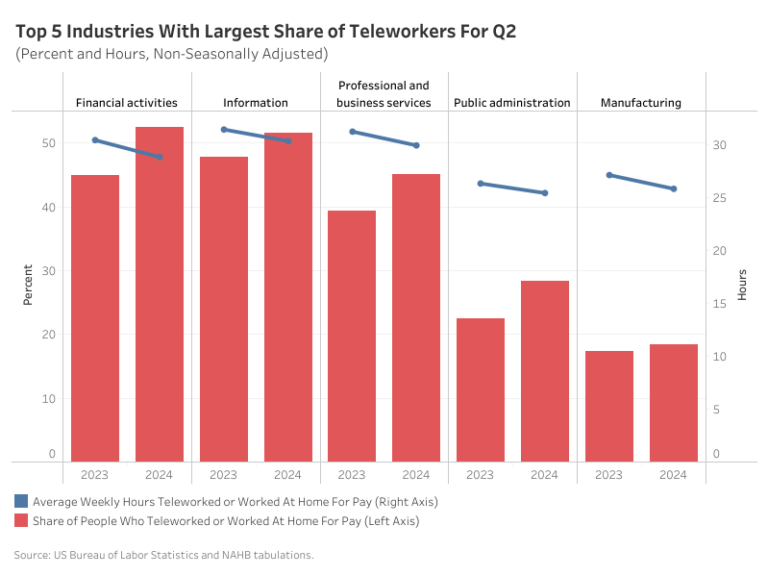
The total share of workers teleworking or working from home for pay has increased from 2023, according to the latest Telework or Work at Home for Pay Survey from the Bureau of Labor Statistics. In June 2023, 19% of the labor force teleworked on a non-seasonally adjusted basis. This share rose to 22.3% in June 2024, even though the total number of workers remained stable. However, the average weekly hours of remote work among teleworkers decreased slightly by 1.7 hours, from 28.7 to 27 hours a week. This decline is due to a shift toward hybrid work, with the proportion of people working all their hours remotely dropping from 53.2% to 48.4%.

Across all occupations, the share of teleworkers has increased, while the average weekly telework hours have declined. Management, professional, and related occupations had the highest share of teleworkers, with 37.8% working remotely in June, averaging 27.1 hours per week. In contrast, natural resources, construction, and maintenance occupations had the lowest share, with only 3.0% teleworking for an average of 21.4 hours a week.

By industry, financial activities saw the largest increase in teleworkers, rising by 7.5 percentage points from 44.9% in June 2023 to 52.4% in June 2024. Meanwhile, the average weekly telework hours for this industry decreased modestly from 30.4 hours to 28.8 hours. The information industry, previously the leader in telework, increased by 3.8 percentage points, from 47.8% to 51.6%. Its average weekly telework hours declined by 1.1 hours, from 31.4 to 30.3 hours.

The increase in teleworking has significant implications for the housing and real estate market. With more people working from home, there may be a growing demand to remodel their current homes to have dedicated office spaces. Additionally, commercial real estate could face challenges as businesses reconsider their office space needs, potentially leading to an increase in flexible workspaces or a reevaluation of leasing strategies.

There are also policy proposals that NAHB supports which aim to repurpose underused commercial spaces into residential real estate, such as the “Revitalizing Downtowns and Main Streets Act” that proposes a 20% tax credit to encourage converting vacant commercial properties into affordable housing, thereby addressing the nationwide housing shortage.

Discover more from Eye On Housing

Subscribe to get the latest posts sent to your email.


This article was originally published by a eyeonhousing.org . Read the Original article here. .
Pin It