Tag

Income

Browsing


Despite solid income gains and lower home prices, Americans still continue to face major housing affordability challenges, according to the latest data from the National Association of Home Builders (NAHB)/Wells Fargo Cost of Housing Index (CHI). The CHI results from the first quarter of 2025 show that a family earning the nation’s median income of $104,200 needed 36% of its income to cover the mortgage payment on a median-priced new home. Low-income families, defined as those earning only 50% of median income, would have to spend 72% of their earnings to pay for the same new home.

The figures track closely for the purchase of existing homes in the U.S. as well. A typical family would have to pay 35% of their income for a median-priced existing home while a low-income family would need to pay 70% of their earnings to make the same mortgage payment.

The percentage of a family’s income needed to purchase a new home fell from 38% in Q4 2024 to 36% in Q1 2025, as a result of a 6.5% rise in median family income and a 1% decline in the median price of a new home. The low-income CHI also fell from 76% to 72% over the same period.

Affordability of existing homes also edged higher for both median- and low-income families between Q4 2024 and Q1 2025. The CHI indices were 35% and 70% in the first quarter vs 37% and 74%, respectively, in the fourth quarter.  The uptick was due to the increase in median income and a 2% drop in median existing home prices.

The U.S. data for the percentage of earnings needed to purchase a new home in Q1 2025 is based on a national median new home price of $416,900 and median income of $104,200. The first quarter median new home price is down slightly from $419,200 in the fourth quarter. The corresponding price for an existing home in the first quarter is $402,300, down from the $410,100 in the previous quarter. The average 30-year mortgage rate increased from 6.72% in Q4 2024 to 6.91% in Q1 2025.

CHI is also available for 175 metropolitan areas, calculating the percentage of a family’s income needed to make the mortgage payment on an existing home based on the local median home price and median income in those markets.

In nine out of 175 markets in Q1 2025, the typical family is severely cost-burdened (must pay more than 50% of their income on a median-priced existing home). In 75 other markets, such families are cost-burdened (need to pay between 31% and 50%). There are 91 markets where the CHI is 30% of earnings or lower.

The Top 5 Severely Cost-Burdened Markets

San Jose-Sunnyvale-Santa Clara, Calif., was the most severely cost-burdened market on the CHI, where 88% of a typical family’s income is needed to make a mortgage payment on an existing home. This was followed by:

Urban Honolulu, Hawaii (74%)

San Diego-Chula Vista-Carlsbad, Calif. (68%)

Naples-Marco Island, Fla. (66%)

San Francisco-Oakland-Fremont, Calif. (64%)

Low-income families would have to pay between 128% and 176% of their income in all five of the above markets to cover a mortgage.

The Top 5 Least Cost-Burdened Markets

By contrast, Elmira, N.Y., was the least cost-burdened markets on the CHI, where typical families needed to spend just 15% of their income to pay for a mortgage on an existing home. Rounding out the least burdened markets are:

Decatur, Ill. (16%)

Peoria, Ill. (16%)

Springfield, Ill. (16%)

Davenport-Moline-Rock Island, Iowa-Ill. (17%)

Low-income families in these markets would have to pay between 31% and 35% of their income to cover the mortgage payment for a median-priced existing home.

Visit nahb.org/chi for tables and details.

Discover more from Eye On Housing

Subscribe to get the latest posts sent to your email.


This article was originally published by a eyeonhousing.org . Read the Original article here. .


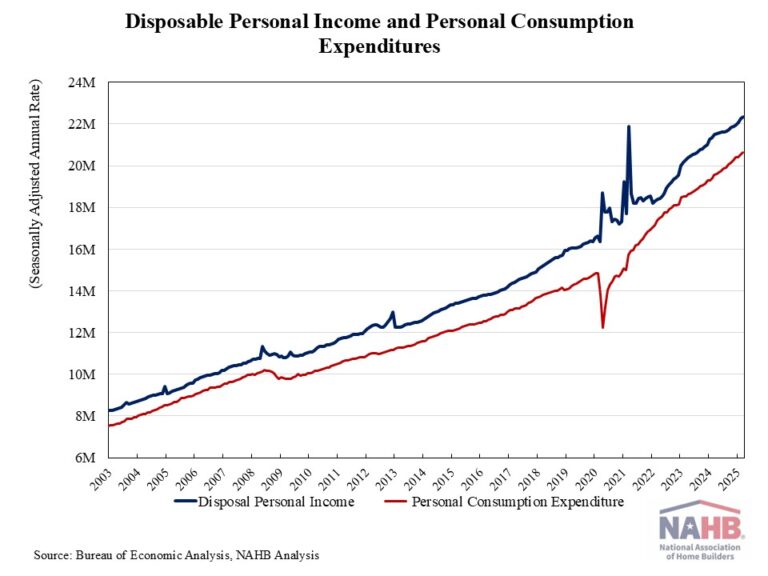
Personal income increased by 0.5% in March, following a 0.7% rise in February and a 0.6% gain in January, according to the latest data from the Bureau of Economic Analysis. The gains in personal income were largely driven by higher wages and salaries. However, the pace of personal income growth slowed from its peak monthly gain of 1.4% in January 2024.

Real disposable income, the amount remaining after adjusted for taxes and inflation, inched up 0.5% in March, following a 0.4% increase in February and 0.2% gain in January. On a year-over-year basis, real (inflation-adjusted) disposable income rose 1.7%, down from a 6.5% year-over-year peak recorded in June 2023. No adjustments were made to personal income for the federal employees’ deferred resignation program in March, as participants are still considered as employed and continue to receive compensations until their official separation from the federal government.

Meanwhile, personal consumption expenditures rose 0.7% in March, building on a 0.5% increase in February. Real spending, adjusted to remove inflation, increased 0.7% in March, with expenditures on goods climbing 1.3% and spending on services up 0.4%.

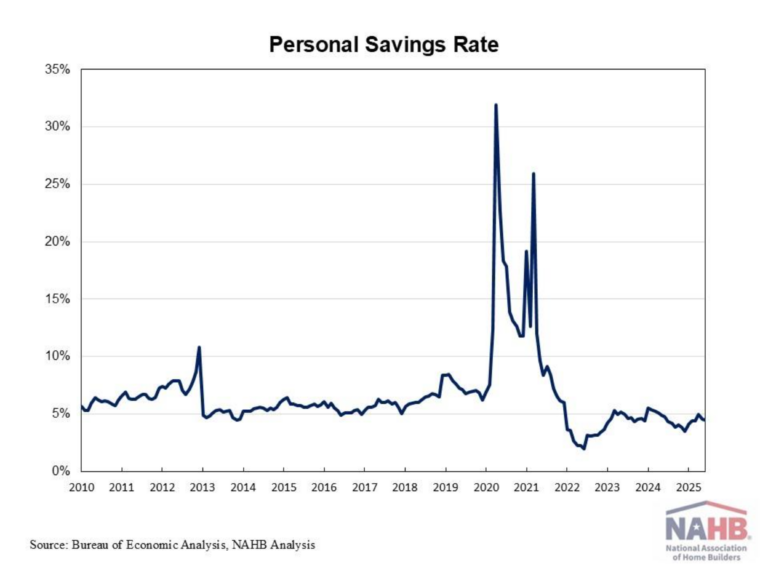
As spending outpaced personal income growth, the personal savings rate dipped to 3.9% in March. With inflation eroding compensation gains, people are dipping into savings to support spending. This trend will ultimately lead to a slowing of consumer spending.

Discover more from Eye On Housing

Subscribe to get the latest posts sent to your email.


This article was originally published by a eyeonhousing.org . Read the Original article here. .


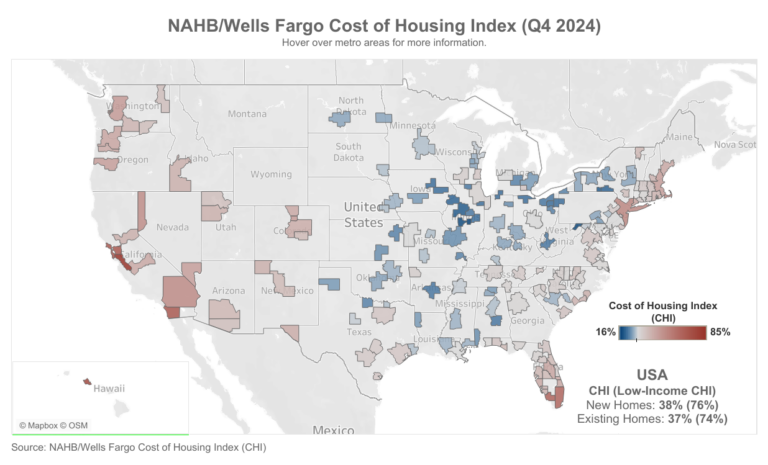
In a clear sign illustrating the housing affordability challenges facing Americans, the National Association of Home Builders (NAHB)/Wells Fargo Cost of Housing Index (CHI) found that in the fourth quarter of 2024, a family earning the nation’s median income of $97,800 needed 38% of its income to cover the mortgage payment on a median-priced new home. Low-income families, defined as those earning only 50% of the median income, would have to spend 76% of their earnings to pay for the same new home.

The figures track closely for the purchase of existing homes in the U.S. as well. A typical family would have to pay 37% of their income for a median-priced existing home, while a low-income family would need to pay 74% of their earnings to make the same mortgage payment.

There was no change in the percentage of a family’s income needed to purchase a new home (38%) between the third and fourth quarters of 2024. However, the cost burden did increase slightly for low-income families, rising from 75% to 76% of their income.

Meanwhile, the cost burden of existing homes edged lower for both median- and low-income families between the third and fourth quarter. The CHI indices were 37% and 74%, respectively, in the fourth quarter, down from 38% and 75% in the third quarter. The slight uptick in affordability was due to median existing home prices falling 2% from the third quarter to the fourth quarter of 2024.

CHI is also available for 176 metropolitan areas, calculating the percentage of a family’s income needed to make the mortgage payment on an existing home based on the local median home price and median income in those markets.

In 10 out of 176 markets in the fourth quarter, the typical family is severely cost-burdened (must pay more than 50% of their income on a median-priced existing home). In 85 other markets, such families are cost-burdened (need to pay between 31% and 50%). There are 81 markets where the CHI is 30% of earnings or lower.

The Top 5 Severely Cost-Burdened Markets

San Jose-Sunnyvale-Santa Clara, Calif., was the most severely cost-burdened market on the CHI, where 87% of a typical family’s income is needed to make a mortgage payment on an existing home. This was followed by:

Urban Honolulu, Hawaii (74%)

San Diego-Chula Vista-Carlsbad, Calif. (69%)

San Francisco-Oakland-Berkeley, Calif. (69%)

Naples-Marco Island, Fla. (65%)

Low-income families would have to pay between 129% and 174% of their income in all five of the above markets to cover a mortgage.

The Top 5 Least Cost-Burdened Markets

By contrast, Decatur, Ill., was the least cost-burdened market in the CHI, where typical families needed to spend just 16% of their income to pay for a mortgage on an existing home. Rounding out the least burdened markets are:

Cumberland, Md.-W.Va (17%)

Springfield, Ill. (17%)

Elmira, N.Y. (19%)

Peoria, Ill. (19%)

Low-income families in these markets would have to pay between 31% and 39% of their income to cover the mortgage payment for a median-priced existing home.

Visit nahb.org/chi for tables and details.

Discover more from Eye On Housing

Subscribe to get the latest posts sent to your email.



This article was originally published by a eyeonhousing.org . Read the Original article here. .


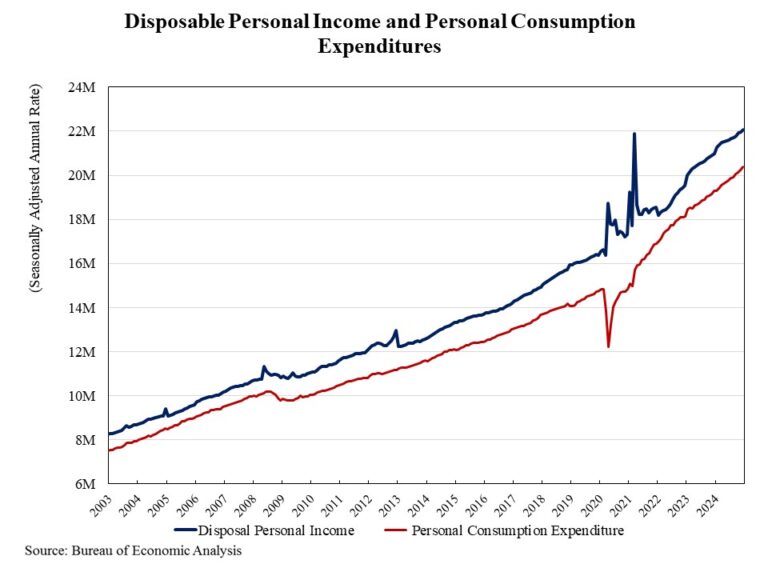
Personal income increased by 0.4% in December, following a 0.3% rise in November and a 0.7% gain in October, according to the latest data from the Bureau of Economic Analysis. The gains in personal income were largely driven by higher wages and salaries. However, the pace of personal income growth slowed from its peak monthly gain of 1.4% in January 2024.

Real disposable income, the amount remaining after adjusted for taxes and inflation, inched up 0.1% in December, matching November’s gain and following a 0.4% increase in October. On a year-over-year basis, real (inflation-adjusted) disposable income rose 2.4%, down from a 6.5% year-over-year peak recorded in June 2023.

Meanwhile, personal consumption expenditures rose 0.7% in December, building on a 0.6% increase in November and 0.5% in October. Real spending, adjusted to remove inflation, increased 0.4% in December, with expenditures on goods climbing 0.7% and spending on services up 0.3%.

As spending outpaced personal income growth, the personal savings rate dipped to 3.8% in December, down from 4.1% in November and 4.3% in October. With inflation eroding compensation gains, people are dipping into savings to support spending. This trend will ultimately lead to a slowing of consumer spending.

Discover more from Eye On Housing

Subscribe to get the latest posts sent to your email.


This article was originally published by a eyeonhousing.org . Read the Original article here. .


In another sign of America’s ongoing housing affordability crisis, the National Association of Home Builders /Wells Fargo Cost of Housing Index (CHI) found that in the third quarter of 2024, a family earning the nation’s median income of $97,800 needed 38% of their income to cover the mortgage payment on a median-priced new home. Low-income families, defined as those earning only 50% of the median income, would have to spend 75% of their earnings to pay for the same new home.

The figures track identically for the purchase of existing homes. A typical family would have to pay 38% of their income for a median-priced existing home while a low-income family would need to pay 75% of their earnings to make the same mortgage payment.

There was no change in the share of a family’s income needed to purchase a new home (38%) between the second and third quarters of 2024, but affordability did improve slightly for low-income families, with the CHI falling from 77% to 75%. 

Meanwhile, affordability of existing homes edged higher for both median- and low-income families between the second and third quarter. The Cost of Housing Indices were 38% and 75% in the third quarter vs. 39% and 79%, respectively, in the second quarter. 

CHI is also available for 176 metropolitan areas, calculating the percentage of a family’s income needed to make the mortgage payment on an existing home based on the local median home price and median income in those markets.

In 10 out of 176 markets in the third quarter, the typical family is severely cost-burdened (must pay more than 50% of their income on a median-priced existing home). In 85 other markets, such families are cost-burdened (need to pay between 31% and 50%). There are 81 markets where the CHI is 30% of earnings or lower.

The Top 5 Severely Cost-Burdened Markets

San Jose-Sunnyvale-Santa Clara, Calif., was the most severely cost-burdened market on the CHI, where 85% of a typical family’s income is needed to make a mortgage payment on an existing home. This was followed by:

Urban Honolulu, Hawaii (75%)

San Diego-Chula Vista-Carlsbad, Calif. (70%)

San Francisco-Oakland-Berkeley, Calif. (68%)

Miami-Fort Lauderdale-Pompano Beach, Fla. (63%)

Low-income families would have to pay between 127% and 170% of their income in all five of the above markets to cover a mortgage.

The Top 5 Least Cost-Burdened Markets

By contrast, Decatur, Ill., was the least cost-burdened market in the CHI, where typical families needed to spend just 16% of their income to pay for a mortgage on an existing home. Rounding out the least burdened markets are:

Cumberland, Md.-W.Va (18%)

Springfield, Ill. (18%)

Elmira, N.Y. (19%)

Peoria, Ill. (19%)

Low-income families in these markets would have to pay between 33% and 39% of their income to cover the mortgage payment for a median-priced existing home.

Visit nahb.org/chi for tables and details.

Discover more from Eye On Housing

Subscribe to get the latest posts sent to your email.


This article was originally published by a eyeonhousing.org . Read the Original article here. .


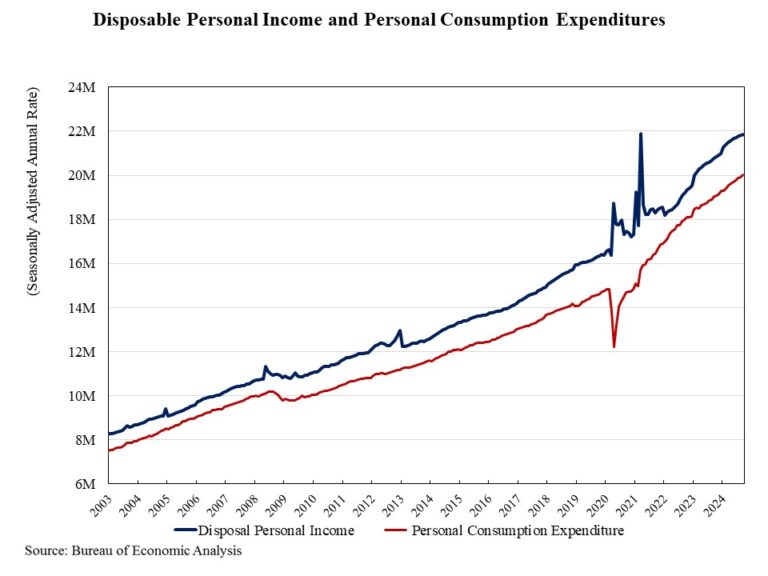
Personal income increased by 0.3% in September, following a 0.2% up in August and a 0.3% increase in July, according to the most recent data release from the Bureau of Economic Analysis. The gains in personal income were largely driven by increases in wages, salaries, and personal current transfer receipts. However, the pace of personal income growth slowed from a peak monthly gain of 1.4% seen in January 2024.

Real disposable income, income remaining after adjusted for taxes and inflation, inched up 0.1% in September. On a year-over-year basis, real (inflation adjusted) disposable income rose 3.1%. The pace of real personal income growth softened from a 6.5% year-over-year peak in June 2023.

Personal consumption expenditures  rose 0.5% in September after a 0.3% increase in August. Real spending, adjusted to remove inflation, increased 0.4% in September, with spending on goods and services each climbing 0.5%.

While spending increased more than personal income, the personal savings rate dipped to 4.6% in September, down from 4.8% in August and 4.9% in July. As inflation has almost eliminated compensation gains, people are dipping into savings to support spending. This will ultimately lead to a slowing of consumer spending.

Discover more from Eye On Housing

Subscribe to get the latest posts sent to your email.


This article was originally published by a eyeonhousing.org . Read the Original article here. .

Pin It