Tag

Inches

Browsing


Builder sentiment inched up in March even as builders continue to express affordability concerns stemming from elevated construction costs and shortages of buildable lots and labor.

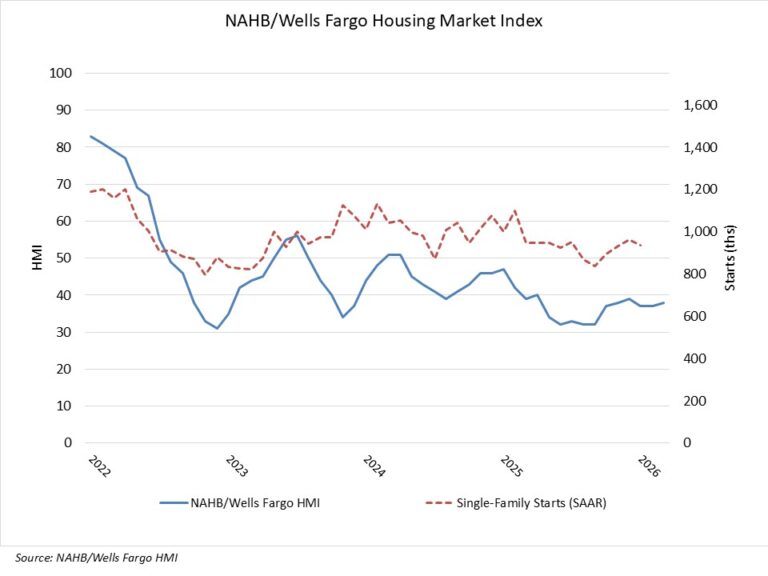
Builder confidence in the market for newly built single-family homes rose one point to 38 in March, following a revised upward one-point revision in February, according to the National Association of Home Builders (NAHB)/Wells Fargo Housing Market Index (HMI). All responses to the March survey were received after the conflict with Iran started.

Affordability for buyers and builders remains a top concern. Many buyers remain on the fence waiting for lower interest rates and due to economic uncertainty.

While the Freddie Mac 30-year fixed rate mortgage averaged 6.05% in February, the lowest since August 2022, downpayment hurdles and uncertainty from the conflict with Iran and the price of oil will be headwinds going forward. The administration’s executive orders issued last week to reduce regulatory burdens associated with home building are a positive step toward increasing attainable housing supply.

The latest HMI survey also revealed that 37% of builders cut prices in March, up slightly from 36% in February. The average price reduction remained stable at 6%. The use of sales incentives was 64% in March, down one percentage point from February, and marking the 12th consecutive month this share exceeded 60%.

Derived from a monthly survey that NAHB has been conducting for more than 40 years, the NAHB/Wells Fargo HMI gauges builder perceptions of current single-family home sales and sales expectations for the next six months as “good,” “fair” or “poor.” The survey also asks builders to rate traffic of prospective buyers as “high to very high,” “average” or “low to very low.” Scores for each component are then used to calculate a seasonally adjusted index where any number over 50 indicates that more builders view conditions as good than poor.

All three of the major HMI indices posted gains in March. The HMI index gauging current sales conditions increased one point to 42 from February to March, the index measuring future sales gained two points to 49 and the index charting traffic of prospective buyers posted a three-point increase to 25.

Looking at the three-month moving averages for regional HMI scores, the Northeast held steady at 44, the Midwest was unchanged at 43, the South held constant at 35 and the West fell two points to 31. The HMI tables can be found at nahb.org/hmi.


This article was originally published by a eyeonhousing.org . Read the Original article here. .
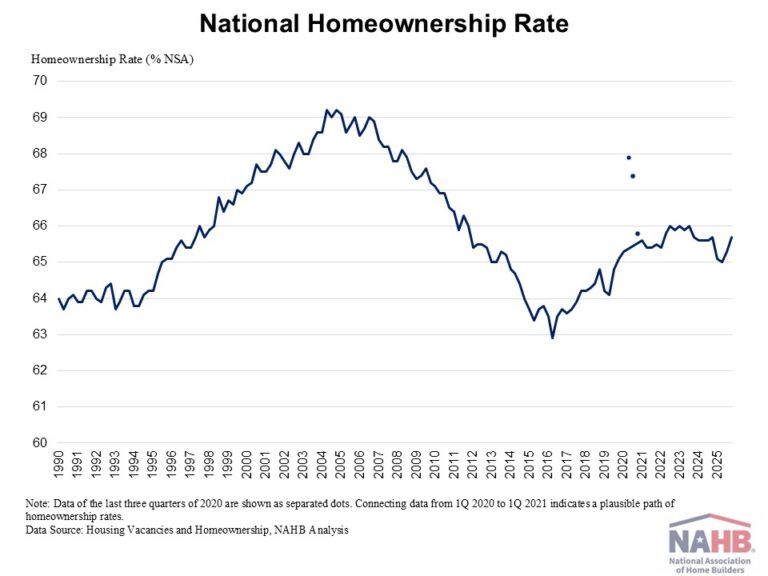

The latest homeownership rate rose to 65.7% in the last quarter of 2025, according to the Census’s Housing Vacancy Survey (HVS). While this was a modest quarterly increase, the broader picture continues to reflect significant affordability challenges. With mortgage interest rates remaining elevated, and housing supply still tight, housing affordability is at a multidecade low.

Compared to the peak of 69.2% in 2004, the homeownership rate is currently 3.5 percentage points lower and remains below the 25-year average rate of 66.3%. It is also important to note that the fourth quarter’s data comes with a higher level of uncertainty. Due to the government shutdown, the Census only collected data for the last two months of 2025.

Compared to the previous year, homeownership rates increased in only two age groups. Among younger households, the homeownership rate for those under 35 increased 1.6 percentage points to 37.9% in the last quarter of 2025. This age group is particularly sensitive to mortgage rates and the inventory of entry-level homes. Homeownership rates for householders ages 55-64 inched up by 0.4 percentage points over the same time. In contrast, several middle-aged and older groups saw declines. Householders ages 45-54 experienced the largest drop, declining  1.5 percentage points from 71.0% to 69.5%. The 35-44 age group saw a 0.5 percentage point decrease, decreasing from 61.4% to 60.9%.  Homeownership rates for householders aged 65 years and over declined 0.5 percentage points from a year ago.

The national rental vacancy rate inched up to 7.2% for the fourth quarter of 2025, on a steadily increasing trend since 2023. Meanwhile, the homeowner vacancy rate stayed at 1.2%. The upticks in both homeowner and rental vacancy rate signal an increase in the existing home supply.

The housing stock-based HVS revealed that the number of total households increased to 133.7 million in the last quarter of 2025 from 132.2 million a year ago. This increase was driven by both owner and renter household growth. The number of renter households rose by 0.46 million, while owner-occupied households increased by around 1 million over the same period.


This article was originally published by a eyeonhousing.org . Read the Original article here. .

Builder confidence inched higher to end the year but still remains well into negative territory as builders continue to grapple with rising construction costs, tariff and economic uncertainty, and many potential buyers remaining on the sidelines due to affordability concerns.

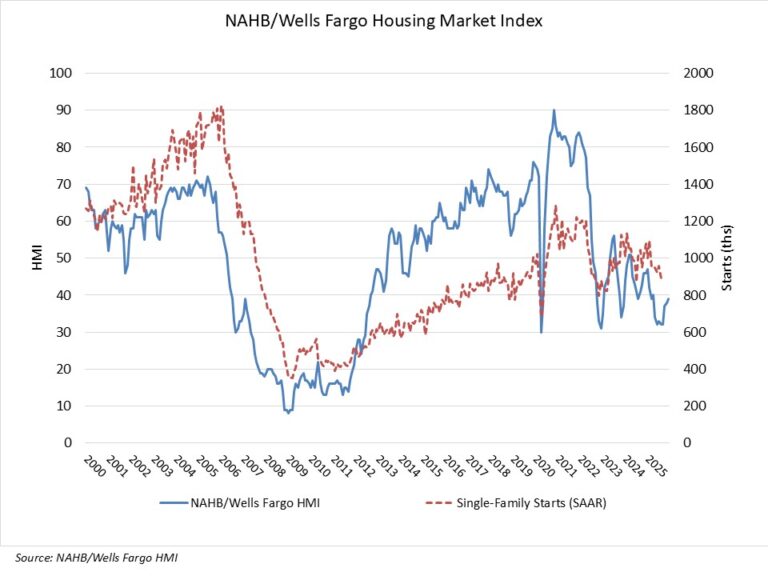
Builder confidence in the market for newly built single-family homes rose one point to 39 in December, according to the National Association of Home Builders (NAHB)/Wells Fargo Housing Market Index (HMI). Sentiment levels were below the breakeven point of 50 every month in 2025 and ranged in the high 30s in the final quarter of the year.

Market conditions remain challenging with two-thirds of builders reporting they are offering incentives to move buyers off the fence.

In positive signs for the market, builders report that future sales expectations have been above the key breakeven level of 50 for the past three months and the recent easing of monetary policy should help builder loan conditions at the start of 2026. However, builders continue to face supply-side headwinds, as regulatory costs and material prices remain stubbornly high. Rising inventory also has increased competition for newly built homes.

In a further sign of ongoing challenges for the housing market, the latest HMI survey also revealed that 40% of builders reported cutting prices in December, marking the second consecutive month the share has been at 40% or higher since May 2020. It was 41% in November. Meanwhile, the average price reduction was 5% in December, down from the 6% rate in November. The use of sales incentives was 67% in December, the highest percentage in the post-Covid period.

Derived from a monthly survey that NAHB has been conducting for more than 40 years, the NAHB/Wells Fargo HMI gauges builder perceptions of current single-family home sales and sales expectations for the next six months as “good,” “fair” or “poor.” The survey also asks builders to rate traffic of prospective buyers as “high to very high,” “average” or “low to very low.” Scores for each component are then used to calculate a seasonally adjusted index where any number over 50 indicates that more builders view conditions as good than poor.

The HMI index gauging current sales conditions increased one point to 42, the index measuring future sales rose one point to 52 and the gauge charting traffic of prospective buyers held steady at 26.

Looking at the three-month moving averages for regional HMI scores, the Northeast fell one point to 47, the Midwest rose two points to 43, the South increased two points to 36 and the West gained four points to 34.

The HMI tables can be found at nahb.org/hmi.

Editor’s Note: With the official 2026 release schedule for the Survey of Construction still unavailable from the U.S. Census Bureau, NAHB confirms the HMI for January 2026 will be released on January 16.  A schedule for the rest of the year will be available as soon as possible.


This article was originally published by a eyeonhousing.org . Read the Original article here. .
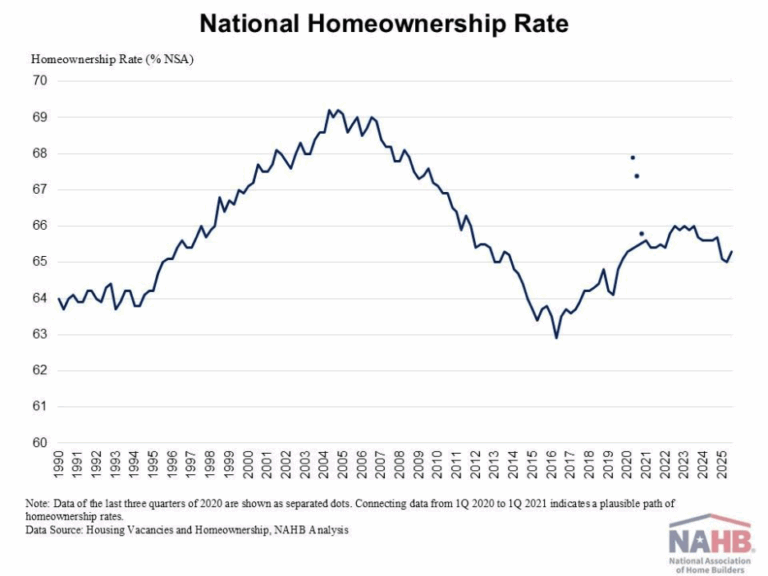

The latest homeownership rate rose to 65.3% in the third quarter of 2025, according to the Census’s Housing Vacancy Survey (HVS). Despite this quarterly increase, the trend continues to reflect significant affordability challenges. With mortgage interest rates remaining elevated, and housing supply still tight, housing affordability is at a multidecade low. Compared to the peak of 69.2% in 2004, the homeownership rate is currently 3.9 percentage points lower and remains below the 25-year average rate of 66.3%.  

Compared to the previous year, homeownership rates increased in three age groups. Among younger households, the homeownership rate for those under 35 increased 0.5 percentage points to 37.5% in the third quarter of 2025. This age group is particularly sensitive to mortgage rates and the inventory of entry-level homes. Householders ages 45-54 experienced a 0.3 percentage-point increase from 69.7% to 70%. Homeownership rates for householders aged 55-64 inched up by 0.1 percentage point over the same time. However, homeownership rates for householders aged 35-44 and those aged 65 years and over each declined 1.2 percentage points from a year ago. 

The national rental vacancy rate inched up to 7.1% for the third quarter of 2025, on steadily increasing trend since 2023. Meanwhile, the homeowner vacancy rate rose to 1.2%. These upticks in both the homeowner and rental vacancy rate signal an increase in the existing home supply. 

The housing stock-based HVS revealed that the number of total households increased to 133.1 million in the third quarter of 2025 from 132.0 million a year ago. This increase was driven by both owner and renter household growth. The number of renter households rose by 0.7 million, while owner-occupied households increased by 0.4 million over the same period.


This article was originally published by a eyeonhousing.org . Read the Original article here. .
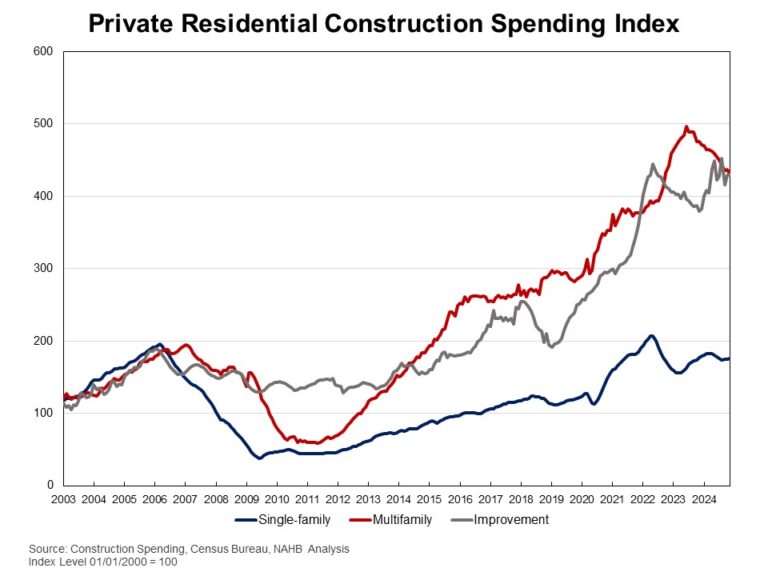

Private residential construction spending edged up by 0.1% in November 2024, according to the latest U.S. Census Construction Spending data. Year-over-year, the November report showed a 3.1% increase.

The monthly increase in total private construction spending was primarily driven by higher spending on single-family construction and residential improvements. Single-family construction spending inched up by 0.3% for the month. This marks a continuation of growth after a five-month decline from April to August, aligning with steady builder confidence seen in the Housing Market Index. However, single-family construction remained 0.7% lower than a year ago. Improvement spending rose by 0.4% in November and was 13.4% higher compared to the same period last year. In contrast, multifamily construction spending declined by 1.3% in November, following a 0.3% increase in October. Compared to a year ago, multifamily construction spending was still 9.5% lower.

The NAHB construction spending index is shown in the graph below. The index illustrates how   spending on single-family construction has slowed since early 2024 under the pressure of elevated interest rates. Multifamily construction spending growth has also slowed down after the peak in July 2023. Meanwhile, improvement spending has increased its pace since late 2023.

Spending on private nonresidential construction was up 1.7% over a year ago. The annual private nonresidential spending increase was mainly due to higher spending for the class of manufacturing ($23.4 billion), followed by the power category ($6.1 billion).

Discover more from Eye On Housing

Subscribe to get the latest posts sent to your email.


This article was originally published by a eyeonhousing.org . Read the Original article here. .
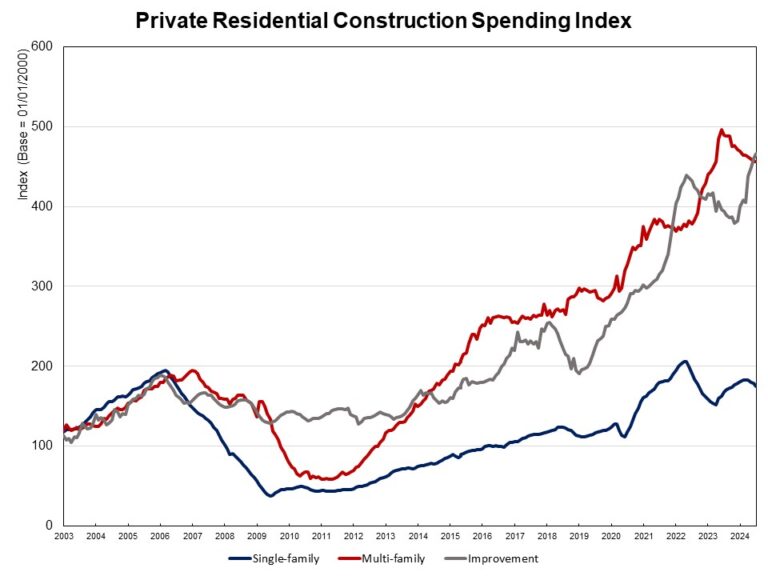

Private residential construction spending fell 0.4% in July, according to the Census Construction Spending data. Nevertheless, spending remained 7.7% higher compared to a year ago. The monthly decline in total private construction spending for July was largely due to reduced spending on single-family construction. Spending on single-family construction plunged by 1.9% in July, following a dip of 1.1% in June. This marks the fourth consecutive monthly decrease. Elevated mortgage interest rates have cooled the housing market, dampening home builder confidence and new home starts. Despite these challenges, spending on single-family construction was still 4% higher than it was a year earlier.

Multifamily construction spending stayed flat in July after a dip of 0.6% in June. Year-over-year, spending on multifamily construction declined 6.7%, as an elevated level of apartments under construction is being completed. Private residential improvement spending increased 1.2% in July and was 18.3% higher compared to a year ago.

The NAHB construction spending index is shown in the graph below (the base is January 2000). The index illustrates how spending on single-family construction has slowed down the pace since early 2024 under the pressure of elevated interest rates. Multifamily construction spending growth slowed down after the peak in July 2023, while improvement spending increased its pace since late 2023.

Spending on private nonresidential construction was up 4.5% over a year ago. The annual private nonresidential spending increase was mainly due to higher spending for the class of manufacturing ($39.7 billion), followed by the power category ($1 billion).

Discover more from Eye On Housing

Subscribe to get the latest posts sent to your email.


This article was originally published by a eyeonhousing.org . Read the Original article here. .

Pin It