Tag

housing

Browsing


Single-family built-for-rent construction fell back in the second quarter, as a higher cost of financing crowded out development activity.

According to NAHB’s analysis of data from the Census Bureau’s Quarterly Starts and Completions by Purpose and Design, there were approximately 12,000 single-family built-for-rent (SFBFR) starts during the second quarter of 2025. This is down significantly relative to the second quarter of 2024 (25,000 starts). Over the last four quarters, 71,000 such homes began construction, which is a 16% decrease compared to the 85,000 estimated SFBFR starts in the four quarters prior to that period.

The SFBFR market is a source of inventory amid challenges over housing affordability and downpayment requirements in the for-sale market, particularly during a period when a growing number of people want more space and a single-family structure. Single-family built-for-rent construction differs in terms of structural characteristics compared to other newly-built single-family homes, particularly with respect to home size. However, investor demand for single-family homes, both existing and new, has cooled with higher interest rates.

Given the relatively small size of this market segment, the quarter-to-quarter movements typically are not statistically significant. The current four-quarter moving average of market share (7%) is nonetheless higher than the historical average of 2.7% (1992-2012).

Importantly, as measured for this analysis, the estimates noted above include only homes built and held by the builder for rental purposes. The estimates exclude homes that are sold to another party for rental purposes, which NAHB estimates may represent another three to five percent of single-family starts based on industry surveys.

The Census data notes an elevated share of single-family homes built as condos (non-fee simple), with this share averaging more than 4% over recent quarters. Some, but certainly not all, of these homes will be used for rental purposes. Additionally, it is theoretically possible some single-family built-for-rent units are being counted in multifamily starts, as a form of “horizontal multifamily,” given these units are often built on a single plat of land. However, spot checks by NAHB with permitting offices indicate no evidence of this data issue occurring.

With the onset of the Great Recession and declines for the homeownership rate, the share of built-for-rent homes increased in the years after the recession. While the market share of SFBFR homes is small, it has clearly expanded. Given affordability challenges in the for-sale market, the SFBFR market will likely retain an elevated market share. However, in the near-term, SFBFR construction is likely to slow until the return on new deals improves.

Discover more from Eye On Housing

Subscribe to get the latest posts sent to your email.


This article was originally published by a eyeonhousing.org . Read the Original article here. .


Both real and nominal wage growth for residential building workers slowed during the second quarter of 2025, reflecting a broader cooling in the construction labor market, according to the latest report from the U.S. Bureau of Labor Statistics (BLS).

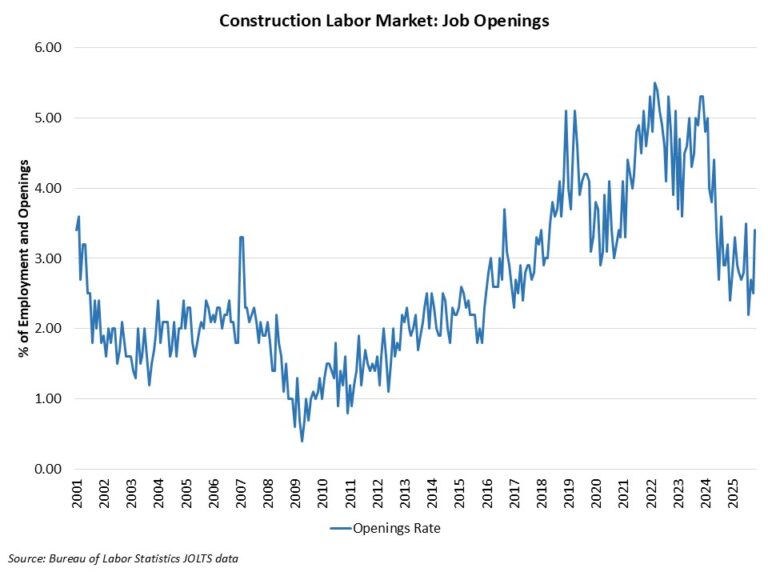
In nominal terms, average hourly earnings (AHE) for residential building workers rose to $39.35 in June 2025, a 3.5% increase from $38.02 a year ago. This marks a continued deceleration in the year-over-year wage growth, which peaked at 9.3% in June 2024. The recent slowdown reflects a slowdown in residential construction activity and a decline in labor demand across the sector. Meanwhile, the number of open, and unfilled construction sector jobs has continued to trend downward, in line with the overall slowdown in housing activity.

Despite the slowdown in wage growth, residential building workers’ wages remain competitive:

11.4% higher than the manufacturing sector ($35.32/hour)

25.3% higher than the transportation and warehousing sector ($31.4/hour)

2.3% lower than the mining and logging sector ($40.29/hour)

Note:

Data used in this post relate to all employees in the residential building industry. This group includes both new single-family housing construction (excluding for-sale builders) and residential remodelers but does not include specialty trade contractors.

Discover more from Eye On Housing

Subscribe to get the latest posts sent to your email.


This article was originally published by a eyeonhousing.org . Read the Original article here. .


The total market share of non-site built single-family homes (modular and panelized) was just 3% of single-family homes in 2024, according to completion data from the Census Bureau Survey of Construction data and NAHB analysis. This is the same as the 3% share in 2023. This share has been steadily declining since the early-2000s despite the high-level of interest for non-site built construction. This low market share in fact runs counter to some media commentary on off-site construction suggesting recent gains. Nonetheless, there exists potential for market share gains in the years ahead due to the need to increase productivity in the residential construction sector.

In 2024, there were 28,000 total single-family units built using modular (13,000) and panelized/pre-cut (15,000) construction methods, out of a total of 1,019,000 single-family homes completed. It is worth noting that the Census definitions of off-site construction are relatively narrow. In a separate survey, the Home Innovation Research Labs Survey of U.S. Home Builders has a higher share for panelized construction (5-12%) due to a wider definition of “panelized” construction.

While the Census-measured market share is small, there exists potential for expansion. This 3% market share for 2024 represents a decline from years prior to the Great Recession. In 1998, 7% of single-family completions were modular (4%) or panelized (3%). This marked the largest share for the 1992-2024 period.

One notable regional concentration is found in the Midwest and the Northeast. These two regions have the highest market share of homes built using non-site build methods. In the Midwest, 7% (8,000 homes) of the region’s 136,000 housing units were completed using these methods. In the Northeast, 5% (3,000 homes) of the region’s 66,000 housing units were completed using non-site build methods. However, numerically, the South continues to be the biggest market for this type of construction where 13,000 homes were built using non-site build methods.

With respect to multifamily construction, approximately 3% of multifamily buildings (properties, not units) were built using modular and panelized methods. This is significantly lower than the 7% share in 2023 but on par with the average for the last 5 years. It is notable that modular construction method accounted for 2% of this share. In previous years it was only panelized construction methods that made up the higher share of non-site build methods in multifamily construction. Prior to last year, the highest levels of modular and panelized methods share in multifamily construction was in 2000 and 2011, where 5% of multifamily buildings were constructed with modular (1%) or panelized construction methods (4%).

Discover more from Eye On Housing

Subscribe to get the latest posts sent to your email.


This article was originally published by a eyeonhousing.org . Read the Original article here. .


American housing market is facing a persistent shortage. Home prices have reached historic highs and affordability has declined. Normally, in response to higher prices, housing supply would increase. However, new home construction has not kept pace with population growth and household formation, especially following the surge of demand in the wake of the pandemic. Recent research has claimed that the relationship between prices and supply has become diluted over time because of regulatory barriers and political dynamics. 

 A recent working paper “America’s Housing Supply Problem: the Closing of the Suburban Frontier?” by economist Edward Glaser and Joseph Gyourko, took a deep dive into why the supply of new housing has shifted lower, especially in the sunbelt regions like Dallas, Atlanta, and Phoenix. These areas, which once led the nation in new home construction, are now seeing a sharp slowdown.  

This research showed that the once-strong link between increasing home prices and new home constructions has weakened or even reversed in many metro areas. The authors analyzed Census tract data from the 1970s to the 2010 to track how construction has responded to price changes over time. Housing markets that used to expand rapidly in response to higher prices are now largely unresponsive. This breakdown in market dynamics reflects the growing influence of regulatory barriers and political constraints. 

Land use regulations, zoning restrictions, and permitting processes have become more restrictive since the 2000s. These constraints increase the cost and difficulty of building new homes, even as home prices increase. Therefore, housing supply is less responsive to demand. The latest NAHB study on this topic shows that regulations now account for nearly $94,000 of the average new home price. Furthermore, housing supply is becoming endogenous or determined by local socioeconomic dynamics. As neighborhoods become more affluent, wealthier or in some cases higher educated, residents are more likely to oppose new development through changing the permit environment or increasing zoning restrictions. In effect, demand is no longer driving the supply through NIMBYism. 

The authors use prices and density to explore where and why new housing is built. The traditional negative relationship between density and housing construction has weakened, or in some cases, reversed in recent decades. The results show that housing supply growth has slowed significantly in low-density areas, particularly in the areas with higher home prices, where much of the housing expansion would traditionally have been expected. This shift reflects the growing impact of regulatory barriers, as suburban and low-density areas now face stricter zoning, and longer permitting processes. These factors make building more homes more difficult and less responsive to demands or market signals. 

The striking finding of this new analysis is that the traditional engine of home building in the South is weakening. The South has had stronger population growth and lower regulatory barriers to land development and home construction than most of the rest of the country.  But as incomes have increased, the authors claim that regulatory barriers have increased, slowing this once fast-growing region. 

Despite the higher home prices, builders face challenges, including higher interest rates, rising inflations, lot and labor shortages, and regulations, that prevent them from building more new homes. According to NAHB’s estimates, based on 2021 data, the U.S. needs 1.5 million additional units to fill the housing shortage gap. In short, the combination of regulatory barriers and economic headwinds continues to hamper housing production nationwide and these challenges are expanding to regions of the country that were once less affected. 

Discover more from Eye On Housing

Subscribe to get the latest posts sent to your email.


This article was originally published by a eyeonhousing.org . Read the Original article here. .


Private fixed investment in student dormitories inched up 0.3% in the second quarter of 2025, reaching a seasonally adjusted annual rate (SAAR) of $3.9 billion. This gain followed a 1.1% decrease in the previous quarter, as elevated interest rates placed a damper on student housing construction. Moreover, private fixed investment in dorms was 2.1% higher than a year ago 

Private fixed investment in student housing experienced a surge after the Great Recession, as college enrollment increased from 17.2 million in 2006 to 20.4 million in 2011. However, during the pandemic, private fixed investment in student housing declined drastically from $4.4 billion (SAAR) in the last quarter of 2019 to a lower annual pace of $3 billion in the second quarter of 2021, as COVID-19 interrupted normal on-campus learning. According to the National Student Clearinghouse Research Center, college enrollment fell by 3.6% in the fall of 2020 and by 3.1% in the fall of 2021.  

Since then, private fixed investment in dorms has rebounded, as college enrollments show a gradual recovery from pandemic driven declines. Effective in-person learning requires college students to return to campuses, boosting the student housing sector.  Still, demographic trends are reshaping the outlook for student housing. The U.S. faces slower growth in the college-age population as birth rates declined following the Great Recession. As a result, total enrollment in postsecondary institutions is projected to only increase 8% from 2020 to 2030, according to the National Center for Education Statistics, well below the 37% increase between 2000 and 2010. 

Despite recent fluctuations, the student housing construction shows signs of recovery and future growth is expected in response to increasing student enrollment projections. 

Discover more from Eye On Housing

Subscribe to get the latest posts sent to your email.


This article was originally published by a eyeonhousing.org . Read the Original article here. .


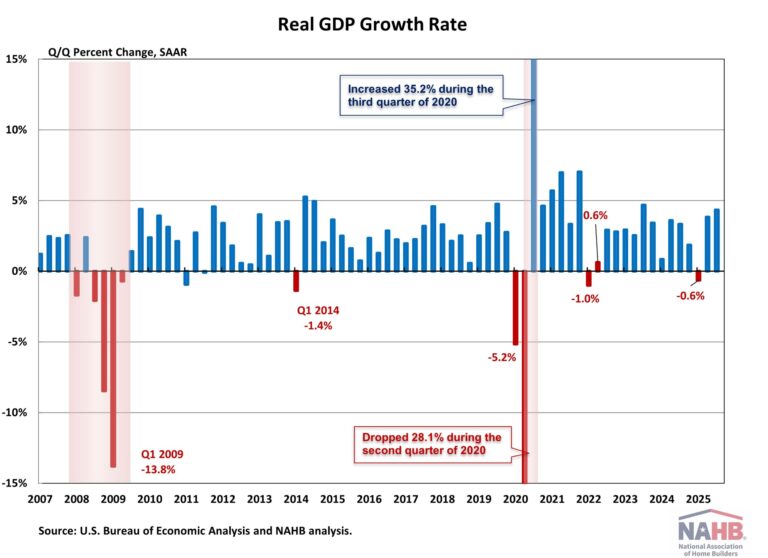
Housing’s share of the economy registered 16.3% in the second quarter of 2025, according to the advance estimate of GDP produced by the Bureau of Economic Analysis. This reading is unchanged from a revised level of 16.3% in the first quarter and is the same as the share one year ago.

The more cyclical home building and remodeling component – residential fixed investment (RFI) – was 4.0% of GDP, level from 4.0% in the previous quarter. The second component – housing services – was 12.3% of GDP, also unchanged from the previous quarter. The graph below plots the nominal shares for housing services and RFI along with housing’s total share of GDP.  

Housing service growth is much less volatile when compared to RFI due to the cyclical nature of RFI. Historically, RFI has averaged roughly 5% of GDP, while housing services have averaged between 12% and 13%, for a combined 17% to 18% of GDP. These shares tend to vary over the business cycle. However, the housing share of GDP lagged during the post-Great Recession period due to underbuilding, particularly for the single-family sector.

In the second quarter, RFI subtracted 19 basis points to the headline GDP growth rate, marking the second straight quarter of negative contributions. RFI was 4.0% of the economy, recording a $1.2 trillion seasonally adjusted annual pace. Among the two segments of RFI, private investment in structures shrunk 4.5%, while residential equipment fell 7.9%.

Breaking down the components of residential structures, single-family RFI fell 12.9%, while multifamily RFI fell 1.3%. RFI for multifamily structures has contracted for eight consecutive quarters. Permanent site structure RFI, which is made up of single-family and multifamily RFI, fell 10.2%. The other structures RFI category rose 0.6% in the second quarter.

The second impact of housing on GDP is the measure of housing services. Similar to the RFI, housing services consumption can be broken out into two components. The first component, housing, includes gross rents paid by renters, owners’ imputed rent (an estimate of how much it would cost to rent owner-occupied units), rental value of farm dwellings, and group housing. The inclusion of owners’ imputed rent is necessary from a national income accounting approach, because without this measure, increases in homeownership would result in declines in GDP. The second component, household utilities, is composed of consumption expenditures on water supply, sanitation, electricity, and gas.

For the second quarter, housing services represented 12.3% of the economy or $3.7 trillion on a seasonally adjusted annual basis. Housing services expenditures fell 0.2% at an annual rate in the second quarter. Real personal consumption expenditures for housing grew 1.2%, while household utilities expenditures fell 9.2%.

Personal consumption expenditures (PCE) for housing services are the largest component of PCE, making up 18.1% in the second quarter. The second largest component of PCE is health care services, at 17.0%. Expenditures on services totaled $14.2 trillion on a seasonally adjusted annual basis in the second quarter, more than double expenditures on goods ($6.4 trillion).

Discover more from Eye On Housing

Subscribe to get the latest posts sent to your email.


This article was originally published by a eyeonhousing.org . Read the Original article here. .


A sharp decline in multifamily production pushed overall housing starts down in May, while single-family output was essentially flat due to economic and tariff uncertainty along with elevated interest rates.

Overall housing starts decreased 9.8% in May to a seasonally adjusted annual rate of 1.26 million units, according to a report from the U.S. Department of Housing and Urban Development and the U.S. Census Bureau.

The May reading of 1.26 million starts is the number of housing units builders would begin if development kept this pace for the next 12 months. Within this overall number, single-family starts increased 0.4% to a 924,000 seasonally adjusted annual rate and are down 7.3% compared to May 2024. The volatile multifamily sector, which includes apartment buildings and condos, decreased 29.7% in May to an annualized 332,000 pace.

On a year-to-date basis, single-family starts are down 7.1%. In contrast, multifamily 5-plus unit starts are up 14.5% as more prospective home buyers remain on the sidelines helping rental demand.

Single-family permits and construction starts are down on a year-to-date basis for 2025 for what has been a disappointing spring housing market, given ongoing elevated mortgage interest rates, challenging housing affordability conditions led by higher construction costs, and macroeconomic uncertainty. NAHB is forecasting that 2025 will end with a decline for single-family housing starts.

The number of single-family homes currently under construction totaled 623,000 homes as of May. This is 1.3% lower than April, 7.6% lower than a year ago and 25% lower than the post-Great Recession peak level in June 2022. There were 752,000 apartments under construction in June, 4.6% lower than May and 18.2% lower than a year ago.

On a regional and year-to-date basis, combined single-family and multifamily starts were 21.1% higher in the Northeast, 10.8% higher in the Midwest, 6.8% lower in the South and 1.6% lower in the West.

Overall permits decreased 2% to a 1.39-million-unit annualized rate in May. Single-family permits decreased 2.7% to an 898,000-unit rate and are down 6.4% compared to May 2024. Multifamily permits decreased 0.8% to a 495,000 pace.

Looking at regional permit data on a year-to-date basis, permits were 17.2% lower in the Northeast, 6% higher in the Midwest, 5.4% lower in the South and 3.7% lower in the West.

Discover more from Eye On Housing

Subscribe to get the latest posts sent to your email.


This article was originally published by a eyeonhousing.org . Read the Original article here. .


Private fixed investment in student dormitories increased by 2.3% in the first quarter of 2025, reaching a seasonally adjusted annual rate (SAAR) of $4.04 billion. This gain followed a 1.0% increase in the previous quarter. However, private fixed investment in dorms was 2% lower than a year ago, as elevated interest rates place a damper on student housing construction.  

Private fixed investment in student housing experienced a surge after the Great Recession, as college enrollment increased from 17.2 million in 2006 to 20.4 million in 2011. However, during the pandemic, private fixed investment in student housing declined drastically from $4.4 billion (SAAR) in the last quarter of 2019 to a lower annual pace of $3 billion in the second quarter of 2021, as COVID-19 interrupted normal on-campus learning. According to the National Student Clearinghouse Research Center, college enrollment fell by 3.6% in the fall of 2020 and by 3.1% in the fall of 2021.  

Since then, private fixed investment in dorms has rebounded, as college enrollments show a gradual recovery from pandemic driven declines. Effective in-person learning requires college students to return to campuses, boosting the student housing sector.  Still, demographic trends are reshaping the outlook for student housing. The U.S. faces slower growth in the college-age population as birth rates declined following the Great Recession. As a result, total enrollment in postsecondary institutions is projected to only increase 8% from 2020 to 2030, according to the National Center for Education Statistics, well below the 37% increase between 2000 and 2010. 

Despite recent fluctuations, the student housing construction shows signs of recovery and future growth is expected in response to increasing student enrollment projections. 

Discover more from Eye On Housing

Subscribe to get the latest posts sent to your email.


This article was originally published by a eyeonhousing.org . Read the Original article here. .


Constrained housing affordability conditions due to elevated interest rates, rising construction costs and labor shortages led to a reduction in housing production in March.

Overall housing starts decreased 11.4% in March to a seasonally adjusted annual rate of 1.32 million units, according to a report from the U.S. Department of Housing and Urban Development and the U.S. Census Bureau.

The March reading of 1.32 million starts is the number of housing units builders would begin if development kept this pace for the next 12 months. Within this overall number, single-family starts decreased 14.2% to a 940,000 seasonally adjusted annual rate over the month and are down 9.7% compared to March 2024. On a year-to-date basis, single-family starts are down 5.6%. The three-month moving average (a useful gauge given recent volatility) is down to 1.01 million units, as charted below.

The multifamily sector, which includes apartment buildings and condos, decreased 3.5% to an annualized 384,000 pace. The three-month moving average for multifamily construction has trended upward to a 381,000-unit annual rate. On a year-over-year basis, multifamily construction is up 48.8%.

On a regional and year-to-date basis, combined single-family and multifamily starts were 10.6% higher in the West, 8.6% higher in the Northeast, 3.3% higher in the Midwest, and 8.5% lower in the South.

The total number of single-family homes and apartments under construction was 1.4 million in March. This is the lowest total since July 2021. Total housing units now under construction are 15.2% lower than a year ago. Single-family units under construction fell to a count of 632,000—down 8.7% compared to a year ago. The number of multifamily units under construction has fallen to 759,000 units. This is down 20.0% compared to a year ago.

On a 3-month moving average basis, there are currently 1.5 apartments completing construction for every one that is beginning construction. While apartment construction starts are down, the number of completed units entering the market is rising due to prior elevated construction levels. Year-to-date, the pace of completions for apartments in buildings with five or more units is down 3.5% in 2025 compared to 2024. An elevated pace of completions in 2025 for multifamily construction will place some downward pressure on rent growth.

Overall permits increased 1.6% to a 1.48-million-unit annualized rate in March. Single-family permits decreased 2.0% to a 978,000-unit rate. Multifamily permits increased 9.3% to a 504,000 pace.

Looking at regional permit data on a year-to-date basis, permits were 4.7% higher in the Midwest, 0.4% higher in the South, 8.8% lower in the West and 24.7% lower in the Northeast.

Discover more from Eye On Housing

Subscribe to get the latest posts sent to your email.


This article was originally published by a eyeonhousing.org . Read the Original article here. .


Growing economic uncertainty stemming from tariff concerns and elevated building material costs kept builder sentiment in negative territory in April, despite a modest bump in confidence likely due to a slight retreat in mortgage interest rates in recent weeks.

Builder confidence in the market for newly built single-family homes was 40 in April, edging up one point from March, according to the National Association of Home Builders (NAHB)/Wells Fargo Housing Market Index (HMI).

The March dip in mortgage rates may have stimulated some sales activity in recent weeks. However, builders have expressed growing uncertainty over market conditions as tariffs have increased price volatility for building materials at a time when the industry continues to grapple with labor shortages and a lack of buildable lots.

Policy uncertainty is making it difficult for builders to accurately price homes and make critical business decisions. The April HMI data indicates that the tariff cost effect is already taking hold, with the majority of builders reporting cost increases on building materials due to tariffs.

When asked about the impact of tariffs on their business, 60% of builders reported their suppliers have already increased or announced increases of material prices due to tariffs. On average, suppliers have increased their prices by 6.3% in response to announced, enacted, or expected tariffs. This means builders estimate a typical cost effect from recent tariff actions at $10,900 per home.

The latest HMI survey also revealed that 29% of builders cut home prices in April, unchanged from March. Meanwhile, the average price reduction was 5% in April, the same rate as the previous month. The use of sales incentives was 61% in April, up from 59% in March.

Derived from a monthly survey that NAHB has been conducting for more than 35 years, the NAHB/Wells Fargo HMI gauges builder perceptions of current single-family home sales and sales expectations for the next six months as “good,” “fair” or “poor.” The survey also asks builders to rate traffic of prospective buyers as “high to very high,” “average” or “low to very low.” Scores for each component are then used to calculate a seasonally adjusted index where any number over 50 indicates that more builders view conditions as good than poor.

The HMI index gauging current sales conditions rose two points in April to a level of 45. The gauge charting traffic of prospective buyers increased one point to 25 while the component measuring sales expectations in the next six months fell four points to 43.

Looking at the three-month moving averages for regional HMI scores, the Northeast fell seven points in April to 47, the Midwest moved one point lower to 41, the South dropped three points to 39 and the West posted a two-point decline to 35.

The HMI tables can be found at nahb.org/hmi.

Discover more from Eye On Housing

Subscribe to get the latest posts sent to your email.


This article was originally published by a eyeonhousing.org . Read the Original article here. .

Pin It