Tag

Homes

Browsing


Three-bedroom single-family homes reached their largest share of starts since 2011 and remained the most prevalent number of bedrooms among new homes. The share of starts for four-bedroom homes declined for the third consecutive year but remained well above the shares for two-bedroom or less and five-bedroom or more homes.

The share of single-family homes started with three bedrooms rose for the second straight year to its highest level since 2011 to 47.0%. All other bedroom number categories fell from 2023, with 4-bedroom homes falling the most from 33.1% to 32.4%, a 0.7 percentage point decline from the year prior. The share of single-family homes with 2 bedrooms or less remained greater than that of 5 bedrooms or more for the third straight year.

U.S. Divisions

Across U.S. Census Divisions, the share of new single-family homes with four or more bedrooms displays geographic variation. The share ranged from a low of 22.2% in the New England division to the highest share of 46.7% in the West South Central division. Coinciding with the fall in the share of new single-family homes with 4 bedrooms or more nationally, there are no divisions that have a share above 50%.

Purpose of Construction

The number of bedrooms in new homes varies depending on the purpose of construction (built-for-sale, contractor-built, owner-built, built-for-rent). Most of this variation comes from the two-bedroom or less homes and four-bedrooms homes. For example, the share of new single-family homes with two bedrooms or less ranges from 5.6% of homes built-for-sale to 37.8% of homes built-for-rent. Meanwhile, three-bedroom homes and five or more-bedroom homes display relatively little change across purpose of construction. Five or more-bedrooms homes held the smallest share of starts across purpose of construction for all types except for built-for-sale homes.

Discover more from Eye On Housing

Subscribe to get the latest posts sent to your email.


This article was originally published by a eyeonhousing.org . Read the Original article here. .


In 2024, most new single-family homes included laundry connections on the first floor (70%), according to the Census Bureau’s Survey of Construction. The first floor is also where most customers prefer to have the laundry, as shown in Chapter 2 of What Home Buyers Really Want.     

The second floor was the next most common location, accounting for 28% of new single-family homes, while laundry areas in the basement accounted for just 2%. The share of new homes with laundry in any other location was negligible. 

Across all Census Divisions, the first floor remains the most common location for laundry, even in regions where two-story homes are more prevalent. Nevertheless, some regional differences exist. In the West South Central division, 91% of homes had a laundry area on the first floor, compared to just 51% in the Pacific division. Meanwhile, a second-floor laundry was most popular in the Pacific division at 46%, and least common in the West South Central at 8%. 

Not surprisingly, laundry connections in basements are more common in areas of the country where basements themselves are more common: primarily in the northern regions. The West North Central division led with 14% of homes featuring a basement laundry, followed by New England at 9%. These two divisions are also among the few where most new homes include a full or partial basement.  

Among age-restricted homes, where accessibility and main-level living are key design priorities, 93% featured laundry on the first floor. 

Multifamily Laundry Trends

For multifamily units completed in 2024, 88% of apartments included an individual laundry, while 12% offered shared or no laundry facilities. This share has remained relatively stable since 2015, reflecting continued renter demand for in-unit laundry. 

Regionally, the Northeast has the highest shared or no laundry facilities percentage at 33%. In contrast, shared or no laundry facilities remained far less common elsewhere: 3% in the Midwest, 4% in the South, and 9% in the West. 

The pattern extends to the built-for-rent (BFR) segment, where 88% of units had an individual laundry, unchanged from the prior two years. In contrast, built-for-sale multifamily units saw a decrease—from 92% with individual laundry in 2023 to 81% in 2024—suggesting a possible shift toward more affordable condo projects, which are more likely to include shared facilities. 

Discover more from Eye On Housing

Subscribe to get the latest posts sent to your email.


This article was originally published by a eyeonhousing.org . Read the Original article here. .


While new homes remain largely unaffordable, builder efforts to improve housing affordability paid dividends in the second quarter of 2025, according to the latest data from the National Association of Home Builders (NAHB)/Wells Fargo Cost of Housing Index (CHI). The CHI results from the second quarter of 2025 show that a family earning the nation’s median income of $104,200 needed 36% of its income to cover the mortgage payment on a median-priced new home. Low-income families, defined as those earning only 50% of median income, would have to spend 71% of their earnings to pay for the same new home.

The figures are somewhat higher for the purchase of existing homes in the U.S., showing that it took more income to buy an existing home. A typical family would have to pay 37% of their income for a median-priced existing home while a low-income family would need to pay 74% of their earnings to make the same mortgage payment.

The second quarter of 2025 marked the largest historical gap where existing home prices exceeded those of new homes. Different dynamics in the two sectors are responsible for the price divergence. On one hand, builders are offering incentives for smaller homes on smaller lots, with streamlined options and features, and thus shifting their production toward less expensive homes.  Many existing homeowners, meanwhile, are locked-in their homes by low mortgage rates, limiting resale inventory, and causing existing home prices to increase.

The percentage of a family’s income needed to purchase a new home was unchanged at 36% from the first to the second quarter, while the low-income CHI fell from 72% to 71% over the same period. Median new home prices edged down 1%, from $416,900 in Q1 2025 to $410,800 in Q2 2025, while the average 30-year mortgage rate slipped from 6.91% to 6.88%.

Affordability of existing homes, on the other hand, edged lower for both median- and low-income families between the first and second quarters. Median existing home prices rose 7% during this period, from $402,300 to $429,400. The share of income needed to pay for an existing home rose from 35% to 37% for a typical family and from 70% to 74% for a low-income family during this period.

CHI is also available for 175 metropolitan areas, calculating the percentage of a family’s income needed to make the mortgage payment on an existing home based on the local median home price and median income in those markets.

In 10 out of 175 markets in the second quarter, the typical family is severely cost-burdened (must pay more than 50% of their income on a median-priced existing home). In 85 other markets, such families are cost-burdened (need to pay between 31% and 50%). There are 80 markets where the CHI is 30% of earnings or lower.

The Top 5 Severely Cost-Burdened Markets

San Jose-Sunnyvale-Santa Clara, Calif., was the most severely cost-burdened market on the CHI, where 93% of a typical family’s income is needed to make a mortgage payment on an existing home. This was followed by:

Urban Honolulu, Hawaii (73%)

San Francisco-Oakland-Fremont, Calif. (72%)

San Diego-Chula Vista-Carlsbad, Calif. (67%)

Naples-Marco Island, Fla. (60%)

Miami-Fort Lauderdale-Palm Springs, Fla. (60%)

Low-income families would have to pay between 119% and 186% of their income in all six of the above markets to cover a mortgage.

The Top 5 Least Cost-Burdened Markets

By contrast, Decatur, Ill., was the least cost-burdened markets on the CHI, where typical families needed to spend just 17% of their income to pay for a mortgage on an existing home. Rounding out the least burdened markets are:

Elmira, N.Y. (18%)

Peoria, Ill. (19%)

Davenport-Moline-Rock Island, Iowa-Ill. (19%)

Binghamton, N.Y. (19%)

Low-income families in these markets would have to pay between 33% and 38% of their income to cover the mortgage payment for a median-priced existing home.

Visit nahb.org/chi for tables and details.

Discover more from Eye On Housing

Subscribe to get the latest posts sent to your email.


This article was originally published by a eyeonhousing.org . Read the Original article here. .


Un jour d’avrilSave Photo
3. Mediterranean Villa in Marseilles, France

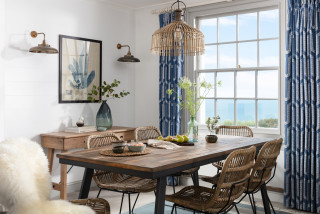
With its white villas, bougainvillea and pine-planted valleys overlooking the Mediterranean sea, the La Corniche Boulevard in Marseilles, France, is a dream location. When a family of four found this two-story 1930s building for sale, they jumped at the chance to own it.

They hired interior designer Chrystel Laporte of Un jour d’avril and landscape architect Élodie Wehrlen of Côté Outdoor to help them turn it into their dream home. Designer Laporte began the design process by listening closely to the owners’ desires and collecting inspirational photos to reflected their wishes. “These mood boards help me tailor the feel of the rooms throughout the project,” she says.

“I also paid attention to the home and looked at its plan in 2D. I always worked from the existing space and examined its lines of sight to create a surprise,” she says. As a former graphic artist, she’s always attuned to the best framing, as illustrated here with this tantalizing slice of sparkling Mediterranean sea on display in the main bedroom, which was previously a bathroom.


This article was originally published by a
www.houzz.com . Read the Original article here. .


In the second quarter of 2025, the median price for a new single-family home was $410,800, which was $18,600 lower than the median price of existing homes, which stood at $429,400. This marks the largest historical gap where existing home prices exceeded those of new homes, according to U.S. Census Bureau and National Association of Realtors data (not seasonally adjusted – NSA) 

Typically, new homes carry a price premium over existing homes. From 2010 to 2019, this pattern held steady, with an average difference of $66,000. However, over the past five years, the gap has narrowed significantly, averaging just $24,800. Notably, this trend reversed in 2024. In both the second and third quarters, the median price of existing homes surpassed that of new homes. 

Both new and existing homes saw dramatic increases in prices post-pandemic due to higher construction costs and limited supply. While overall home prices remain elevated compared to historical norms, new homes prices have moderated due to tactical builder business decisions, whereas existing homes prices continue to increase because of lean supply and perhaps a lack of price discovery for existing homeowners. 

Indeed, the median price for a new single-family home sold in the second quarter of 2025 decreased 0.9% from the previous year. New home prices have continued to experience year-over-year declines for nine consecutive quarters.  

Meanwhile, the median price for existing single-family homes increased 1.7% from one year ago. Existing home prices have continued to experience year-over-year increases for eight consecutive quarters. 

There are several factors as to why new and existing homes are selling at similar price points. Tight inventory continues to push up prices for existing homes, as many homeowners who secured low mortgage rates during the pandemic are hesitant to sell due to current high interest rates.  

Meanwhile, new home pricing is more volatile – prices change due to the types and locations of homes being built. Despite various challenges facing the industry, home builders are adapting to affordability challenges by building on smaller lots, constructing smaller homes, and offering incentives. Additionally, there has been a shift in home building toward the South, associated with less expensive homes because of policy effects.  

Moreover, the least expensive region for new homes in the first quarter was the South, with a median price of $372,100. The Midwest followed closely behind at $385,300. For existing homes, the Midwest was the most affordably region at $328,800, followed by the South at $376,300. 

New homes were most expensive in the Northeast with a median price of $796,700, while the West sold at $531,100. For existing homes, the West led as the most expensive region at $646,100 homes, followed by Northeast at $646,100.  

The new home price premium was most pronounced in the Northeast, where new homes sold for $269,500 more than existing homes. The West and South followed the national trend, with existing homes priced $4,200 more than new homes in the West and $115,000 more in the South. 

Discover more from Eye On Housing

Subscribe to get the latest posts sent to your email.


This article was originally published by a eyeonhousing.org . Read the Original article here. .


In 2024, there were 24,000 homes that exceeded 5,000 square feet, equating to a 2.3% market share of all new homes started. Both the number and market share for 5,000+ square foot homes experienced declines from 2023, according to the annual data from the Census Bureau’s Survey of Construction (SOC).

The number of homes started in 2024 exceeding 5,000 square feet dropped to 24,000, a decrease from 26,000 in 2023. In 2006, the number of new 5,000+ square foot homes reached a peak of 45,000. This number proceeded to drop during the Great Recession and hit a low of 11,000 in 2009. Since 2013, the number has remained consistently above 20,000, with a recent peak of 33,000 in 2021.

Of the total number of new homes started in 2024, 2.3% had 5,000+ square feet or more of finished space, down from 2.8% in 2023.  The decline marks the third consecutive drop in the share of homes this size, down from a recent peak of 2.9% in 2021.  In 2015, the 5,000+ square foot share reached a record high of 3.9%.  Since then, it has fluctuated between 2.3% and 3.1%.

Tabulating the major characteristics of 5,000+ square foot homes started in 2024, the data show 83% have a porch, 79% have a finished basement, 71% have a patio, 69% have four or more bathrooms, 66% have a 3-or-more car garage, 54% have five bedrooms or more, and 50% belong to a community association.

Discover more from Eye On Housing

Subscribe to get the latest posts sent to your email.


This article was originally published by a eyeonhousing.org . Read the Original article here. .


The share of new single-family homes built with individual septic systems declined slightly in 2024 compared to the previous year, while the share of homes served by private wells remained steady. According to NAHB’s analysis of the Census Bureau’s Survey of Construction (SOC), approximately 16% relied on individual septic systems, and 9% of new single-family homes started in 2024 were served by private wells.

Nationally, the majority of new homes were connected to public water systems – including community or shared supplies/wells – while 9% were built with private wells. This national share held steady from the previous year, though regional differences were notable. In New England, where median lot sizes are more than three times the national average, 37% of new single-family homes relied on private wells, making it the division with the highest rate in the nation. The East North Central division followed with 27%, while the Middle Atlantic stood at 13%. The South Atlantic region also exceeded the national average, with 11% of new homes using private wells. In stark contrast, private wells were uncommon in the East South Central and West South Central divisions, each accounting for just 1% of new homes started.

For sewage disposal, 84% of new single-family homes in 2024 were connected to public sewer systems, which include community or shared sewage/septic systems. The remaining 16% utilized individual septic systems, down slightly from 17% in the previous year. As with water sources, the usage of septic systems varied significantly by region.

New England led the nation with 49% of new homes using individual septic systems. The East North Central (28%), East South Central (25%), and South Atlantic (22%) divisions also reported shares above the national average. In contrast, lower usage was recorded in the Mountain (9%) and West North Central (8%) divisions, while the Pacific and West South Central divisions had the smallest shares, at 7% and 5%, respectively.

Compared to 2023, seven of the nine Census divisions experienced a decline in the use of individual septic systems with five of the divisions falling below the national average. New England and East North Central were the exceptions, recording increases of 11- and 5-percentage points, respectively, bringing their shares to 49% and 28% in 2024. However, these gains are not anomalies. In New England, the share had dipped to 38% in 2023, down from 46% in 2022. Similarly, East North Central’s share decreased from 27% in 2022 to 23% in 2023.    

Zooming out, the share of new homes built with individual septic systems has generally been on a decline across most regions since 2010. This trend has been slightly more pronounced in the three divisions (New England, East South Central and East North Central) with historically higher usage. The South Atlantic division stands out as an exception. While its share ranged from 13% to 17% in the early 2010s, it has steadily increased in recent years, and now exceeds 20%.

Discover more from Eye On Housing

Subscribe to get the latest posts sent to your email.


This article was originally published by a eyeonhousing.org . Read the Original article here. .


From 2020 to 2024, sales of lower-priced new homes declined significantly as the market moved toward higher-priced segments. Rising construction costs—driven by inflation, supply chain disruptions, and labor shortages—as well as higher regulatory costs, made it increasingly difficult for builders to construct affordable homes. On the other hand, low levels of inventory pushed up the price of new single-family homes, deepening the housing affordability crisis for first-time and middle-income buyers.

National New Home Sales by Sales Price

Data from the U.S. Census’s Survey of Construction (SOC) shows that total sales of new single-family homes declined by 17% during the 2020—2024 period. Meanwhile, the median sales price of new single-family homes increased significantly, rising from $330,900 in 2020 to $420,300 in 2024. This steep rise in sales price has placed additional pressure on prospective home buyers, particularly those seeking homes in the lower-priced segments.

Between 2020 and 2024, the market for new single-family homes experienced significant shifts in the distribution of sales by price range. Most notably, there was a sharp decline in sales of lower-priced homes. Homes priced under $300,000 experienced a 65% decline in sales, while sales of homes priced between $300,000 and $399,999 fell by 10%. In contrast, higher-end segments saw substantial growth, with sales of homes priced between $800,000 and $999,999 more than doubling and those priced at $1,000,000 or more increasing by 85%.

The market share of lower-priced homes declined dramatically. In 2020, homes priced under $300,000 accounted for 40% of the total new single-family home sales, making them a dominant category. By 2024, this category had dropped to the third largest, overtaken by homes in the $300,000—$399,999 and $400,000—$499,999 ranges. Meanwhile, the share of higher-priced homes expanded, reflecting a broader shift toward more expensive construction and away from affordability.

Regional New Home Sales by Sales Price

The regional picture mirrors these national trends, though the magnitude and affected price category vary by geography. Between 2020 and 2024, all four regions—the Northeast, Midwest, South, and West—saw declines in new home sales. The West experienced the steepest drop at 28%, followed by the Midwest at 14%, the South at 13%, and the Northeast at 8%. The declines mainly reflect significant declines in lower-priced home sales.

In the Midwest and South, the declines in new home sales were limited to homes priced under $300,000. In the Northeast and West, where the regions tend to have higher median home prices, sales declines occurred in multiple price categories. The Northeast saw a broader decline in new homes sold under $600,000, while new home sales in the West reported declines in three price categories under $500,000.

Furthermore, all four regions also experienced a decline in the market share of lower-priced homes. In 2020, more than half of the new homes sold in the Midwest and South were priced under $300,000. By 2024, that share had plummeted to just 16% in the Midwest and 23% in the South. The Northeast and West also saw notable shifts, with the share of homes priced between $300,000 and $499,999 dropping sharply over the same period.

Discover more from Eye On Housing

Subscribe to get the latest posts sent to your email.


This article was originally published by a eyeonhousing.org . Read the Original article here. .


The median price for a new single-family home sold in the first quarter of 2025 was $416,900, a mere $14,600 above the existing home sale price of $402,300, according to U.S. Census Bureau and National Association of Realtors data (not seasonally adjusted – NSA).

Typically, new homes carry a price premium over existing homes. However, the median existing home price exceeded the new home price in the second quarter of 2024 and again in the third quarter of 2024. The first quarter of 2025’s $14,600 price difference is considerably modest by historical standards. Just over two years ago in Q4 2022, the price gap hit a peak with new homes selling for $64,200 more than existing homes. The average difference over the last five years was $26,700, while the decade (2010-2019) prior saw a much wider gap of $66,000.

Both new and existing homes saw dramatic increases in prices post-pandemic due to higher construction costs and limited supply. While overall home prices remain elevated compared to historical norms, new home prices have moderated due to builder business decisions, but existing home prices continue to increase because of lean supply.

The median price for a new single-family home sold in the first quarter of 2025 decreased 2.32% from the previous year. New home prices have continued to experience year-over-year declines for eight consecutive quarters.

Meanwhile, the median price for existing single-family homes increased 3.38% from one year ago. Existing home prices have continued to experience year-over-year increases for seven consecutive quarters.

There are several factors as to why new and existing homes are selling at similar price points. Tight inventory continues to push up prices for existing homes, as many homeowners who secured low mortgage rates during the pandemic are hesitant to sell due to current high interest rates.

Meanwhile, new home pricing is more volatile – prices change due to the types and locations of homes being built. Despite various challenges facing the industry, home builders are adapting to affordability challenges by building on smaller lots, constructing smaller homes, and offering incentives. Additionally, there has been a shift in home building toward the South, associated with less expensive homes because of policy effects.

The least expensive region for homes in the first quarter was the Midwest, with a median price of $367,500 for new homes and $297,800 for existing homes. The South followed closely, with a median new home price of $376,000 and an existing home price of $361,800.

New homes were most expensive in the Northeast with a median price of $784,900, while the West sold at $522,100. However, for existing homes, the West led as the most expensive region at $626,000, followed by the Northeast at $482,700.

The new home price premium was most pronounced in the Northeast, where new homes sold for $302,200 more than existing homes. In contrast, the South saw little difference with a modest $14,200— similar to the national trend. Uniquely, this pattern reversed in the West, where existing homes were $103,900 more than new homes.

Discover more from Eye On Housing

Subscribe to get the latest posts sent to your email.


This article was originally published by a eyeonhousing.org . Read the Original article here. .


Around 48% of the U.S. housing stocks dates back to the 1980s and earlier. The median age of owner-occupied homes has climbed to 41 years in 2023, up from 31 years in 2005 according to the latest data from the American Community Survey[1]. The U.S. owner-occupied housing stock has aged rapidly particularly, particularly since the Great Recession, as the residential construction continues to fall behind in delivering new homes.

Currently, new home construction faces headwinds such as rising material costs, persistent labor shortage and elevated interest rates. These challenges have contributed to an insufficient supply of new construction, making the nation’s owner-occupied housing stock significantly older over time. As a result, the aging housing stock signals a future growing remodeling market. Older structures require updates to add new amenities or need repairs or replacements of old components.

Moreover, the lock-in effect from historically low mortgage rates during the pandemic period has led many homeowners to stay put and renovate their existing homes to accommodate the growing needs of their families. Over the long run, the aging of the housing stock implies that remodeling may grow faster than new construction.

From 2020 to 2023, new construction added nearly 2.6 million owner-occupied homes, accounting for only 3% of total owner-occupied housing stock as of 2023. Relatively newer homes built between 2010 and 2019 took up around 9% of the stock, while those constructed between 2000 and 2009 made up 15%. In contrast, around 48% of the owner-occupied homes were built before 1980, including around 35% built before 1970.

Due to modest supply of housing construction, the share of relatively newer owner-occupied homes (those built within past 13 years) has declined greatly, from 18% in 2013 to only 12% in 2023. Meanwhile, the share of older homes that are at least 44 years old has increased significantly, rising from 39% in 2013 to 48% in 2023. This shift further reflects the ongoing aging of the U.S. housing stock, highlighting the growing importance of the remodeling sector to address the growing needs of homeowners nationwide.

[1] : Census Bureau did not release the standard 2020 1-year American Community Survey (ACS) due to the data collection disruptions experienced during the COVID-19 pandemic. The data quality issues for some topics remain in the experimental estimates of the 2020 data. To be cautious, the 2020 experimental data is not included in the analysis.

Discover more from Eye On Housing

Subscribe to get the latest posts sent to your email.


This article was originally published by a eyeonhousing.org . Read the Original article here. .

Pin It