Tag

Homeownership

Browsing


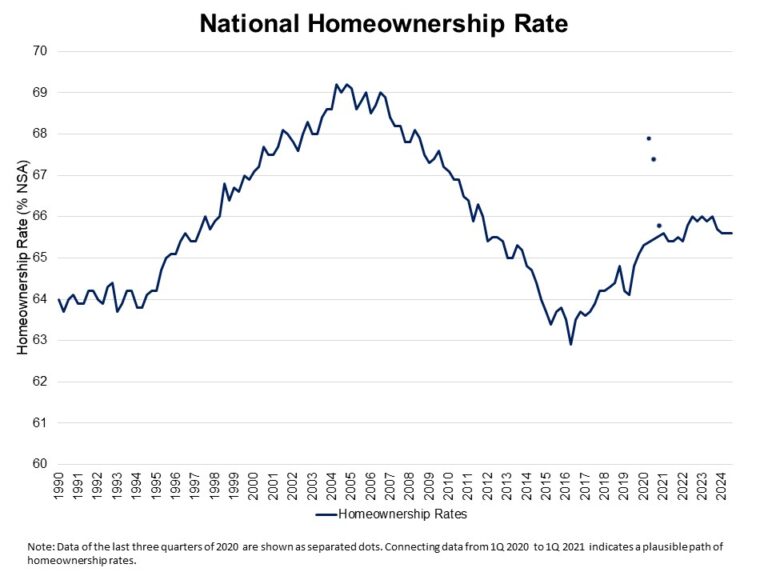
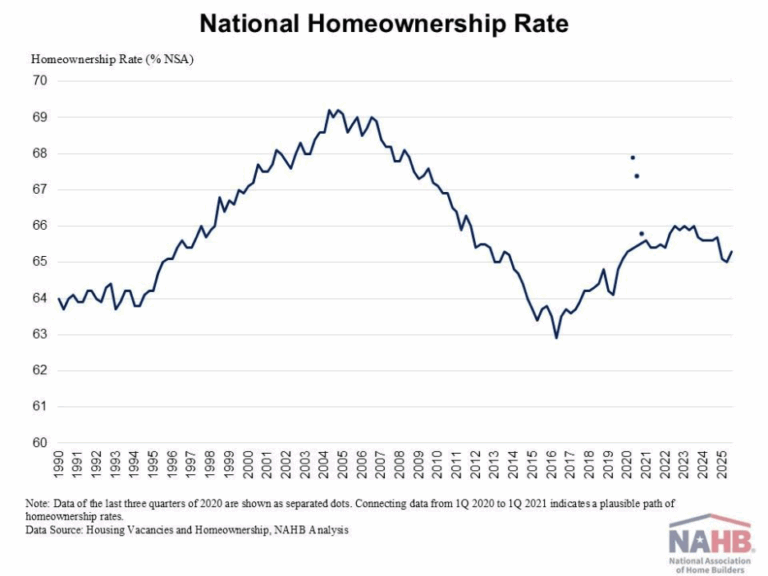
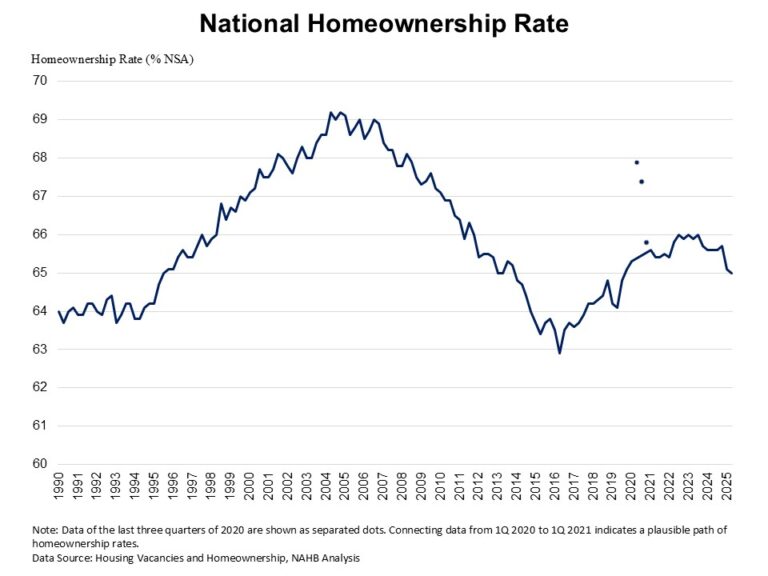
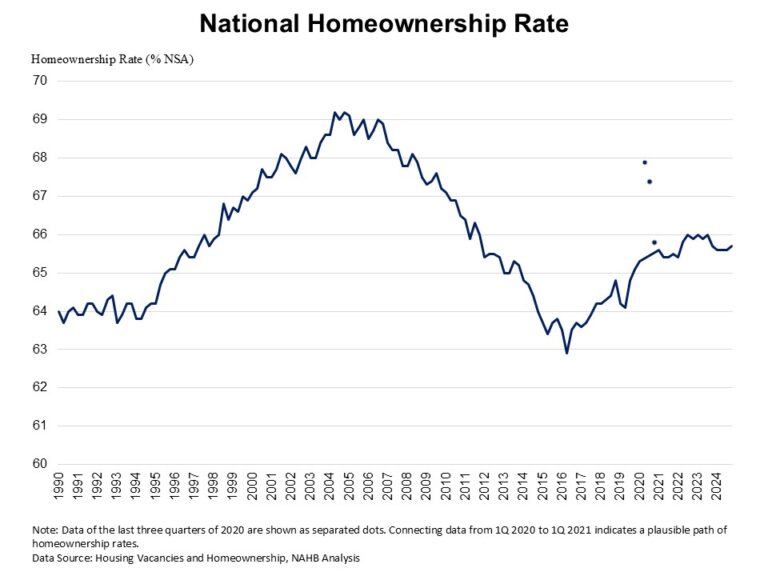
The homeownership rate declined to 65.1% in the first quarter of 2024, the lowest level since the first quarter of 2020, according to the Census’s Housing Vacancy Survey (HVS). Amid elevated mortgage interest rates and tight housing supply, housing affordability is at a multidecade low. Compared to the peak of 69.2% in 2004, the homeownership rate is 4.1 percentage points lower and remains below the 25-year average rate of 66.3%.

Homeownership rates declined across nearly all age groups over the past year, except those aged 65 and older. Among younger households, the homeownership rate for those under 35 rose slightly to 36.6% in the first quarter of 2024. However, it is still hovering at the lowest rate in the last 6 years. This age group, particularly sensitive to mortgage rates and the inventory of entry-level homes, saw the largest decline among all age categories (1.1 percentage points down). Similar declines were seen among the 35-44 group and 55-64 age group, with rates decreasing from 61.4% to 60.3% and from 76.3% to 75.2%, respectively. Homeownership rates for householders aged 45-54 dipped slightly from 70.8% to 70.6%. In contrast, those 65 years and over experienced a modest increase from 78.7% to 79%.

The national rental vacancy rate increased to 7.1% for the first quarter of 2025, returning to the pre-pandemic levels after several years of tight rental market. Meanwhile, the homeowner vacancy rate stayed at 1.1%, remaining near the survey’s 67-year low of 0.7%.

The housing stock-based HVS revealed that the count of total households increased to 132.2 million in the first quarter of 2025 from 131.0 million a year ago. The gains are due to gains in both renter household formation (1.2 million increase), and owner-occupied households (106,000 increase).

Discover more from Eye On Housing

Subscribe to get the latest posts sent to your email.


This article was originally published by a eyeonhousing.org . Read the Original article here. .


The homeownership rate for those under the age of 35 dropped to 36.3% in the last quarter of 2024, reaching the lowest level since the third quarter of 2019, according to the Census’s Housing Vacancy Survey (HVS). Amidst elevated mortgage interest rates and tight housing supply, housing affordability is at a multidecade low. The youngest age group, who are particularly sensitive to mortgage rates, home prices, and the inventory of entry-level homes, saw the largest decline among all age categories.

The U.S. homeownership rate inch up to 65.7% in the last quarter of 2024, hovering at the lowest rate in the last two years. The homeownership rate remains below the 25-year average rate of 66.4%.

The national rental vacancy rate stayed at 6.9% for the last quarter of 2024, and the homeowner vacancy rate inched up to 1.1%. The homeowner vacancy rate remains close to the survey’s 67-year low of 0.7%.

Homeownership rates declined for under 35 and 35-44 age groups compared to a year ago. Householders under 35 experienced the largest drop, declining by 1.8 percentage points from 38.1% to 36.3%. The 35-44 age group also saw a 0.6 percentage point decrease, decreasing from 62% to 61.4%. Conversely, homeownership rates for householders aged 45-54 increased from 70.3% to 71%. Among those aged 55-64, homeownership inched up slightly from 76% to 76.3%. Those 65 years and over experienced a modest increase from 79% to 79.5%.

The housing stock-based HVS revealed that the count of total households increased to 132.4 million in the last quarter of 2024 from 131.1 million a year ago. The gains are due to gains in both renter household formation (509,000 increase), and owner-occupied households (783,000 increase).

Discover more from Eye On Housing

Subscribe to get the latest posts sent to your email.


This article was originally published by a eyeonhousing.org . Read the Original article here. .


With the end of 2024 approaching, NAHB’s Eye on Housing is reviewing the posts that attracted the most readers over the last year. In September, Catherine Koh dived into data on the homeownership rate of various household types including married couples with children, married couples with no children, single parents, and others.

The homeownership rate for multigenerational households increased by 4.9 percentage points (pp) over the last decade, but there’s another household type that experienced an even larger increase in the homeownership rate over the same period—single parent households.

In further analysis of the Census’s American Community Survey (ACS) data, NAHB dives deeper into the homeownership rate for other family household types: married couples with no children, married couples with children and single parent households. In 2022, most family households were married with no children (44%), followed by married with children (26%), single parents (12%), others (12%), and multigenerational families (6%). This composition has not changed much, with the exception of a gradual decrease in the share of married with children and single parent households, which is offset by an increase in the share of married with no children households.

The homeownership rate for single parent households saw the largest gains in homeownership rate with an increase of 5.7 percentage points over the decade. However, the overall level of homeownership rate for single parent households remains the lowest among all other family household types at just 41%.    Another group that saw a large increase was the married couple with children households, with a 4.5% increase over the decade from 73% to 78%. Like multigenerational households, these increases were spurred on by historically low mortgage rates in 2021.

The only household type to have plateaued was married without children. As a matter of fact, these households saw decreasing homeownership rates for a few years before creeping back up to be at roughly the same rate as they were ten years ago at 84%. Nonetheless, married without children households remain as the group with the highest homeownership rate with an average rate of 84% over the decade.

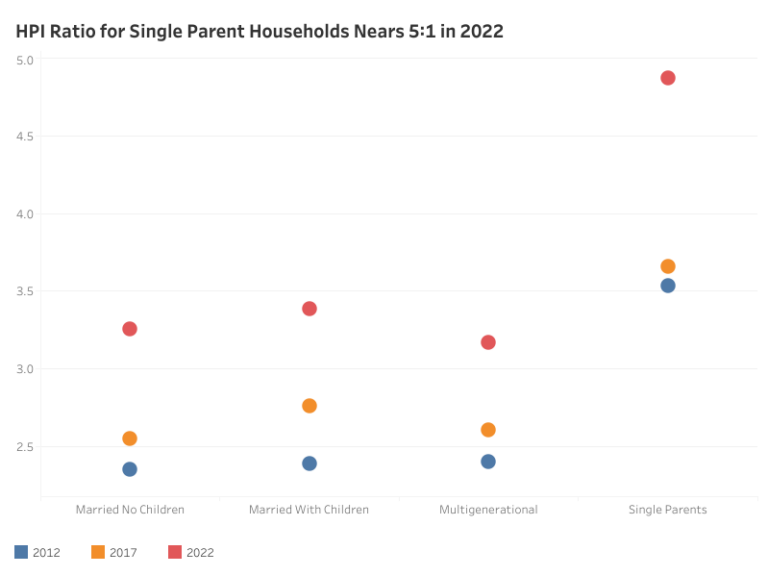
We also examined the estimated home price-to-income ratio (HPI) for various household types. To calculate the home prices for recent homebuyers we used the median property value for owners who moved into their property within the past year. Here is where we see the effect of how multigenerational households were able to lower their HPI with pooled income and budgets. In contrast are single parent households with their estimated home prices approaching five times their income, indicating that these households are significantly burdened by housing costs.   

Given that homeownership rates jumped in recent years for most household types despite increases in home prices suggests that the low mortgage rates in 2021 made steep home prices more palatable for homebuyers to enter the market. However, it is unlikely that we’ll see a continued increase in homeownership while mortgage rates remain elevated. 

Discover more from Eye On Housing

Subscribe to get the latest posts sent to your email.


This article was originally published by a eyeonhousing.org . Read the Original article here. .


With the end of 2024 approaching, NAHB’s Eye on Housing is reviewing the posts that attracted the most readers over the last year. In May, Rose Quint shared key takeaways of NAHB’s study of home buyers. 

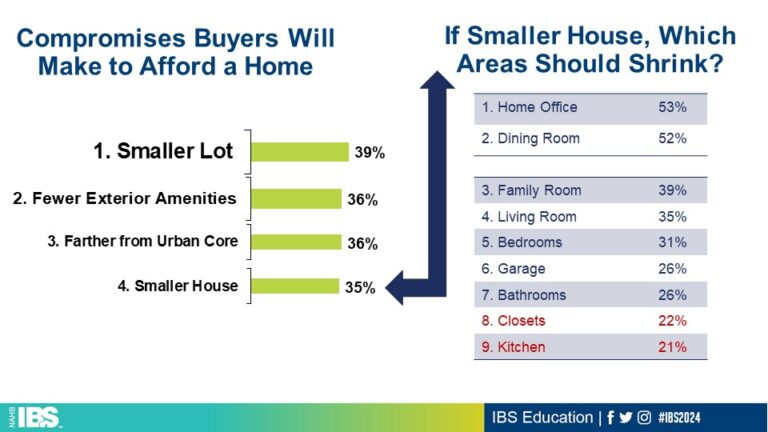
High mortgage rates and double-digit growth in home prices since COVID-19 have brought housing affordability to its lowest level in more than a decade.  Given this reality, a recent NAHB study on housing preferences* asked home buyers about which specific compromises they would be willing to make to achieve homeownership.

For 39% of buyers, accepting a smaller lot is the path to affording a home.  This finding highlights the paramount importance of reforming zoning laws that mandate lot sizes, as nearly 4 out of 10 buyers would be willing to give up land in exchange for owning a home.  For 36% of buyers, accepting fewer exterior amenities is the way to homeownership—they will simply add that deck or patio at some point in the future.  Another 36% were willing to move farther from the urban core and 35% will accept a smaller house if that’s what it takes to buy it.

But what areas of the home, specifically, should shrink to reduce the overall footprint of the home?  Most buyers who will take the smaller house compromise sent builders and architects a clear message: shrink the home office (53%) and the dining room (52%) to save on square footage.  Also, loud and clear in the message: leave the kitchen (only 21% would want that smaller) and closet space (22%) alone.

What Home Buyers Really Want, 2024 Edition sheds light on the housing preferences of the typical home buyer and is based on a national survey of more than 3,000 recent and prospective home buyers.  Because of the inherent diversity in buyer backgrounds, the study provides granular specificity based on demographic factors such as generation, geographic location, race/ethnicity, income, and price point.

Discover more from Eye On Housing

Subscribe to get the latest posts sent to your email.


This article was originally published by a eyeonhousing.org . Read the Original article here. .


The homeownership rate for those under the age of 35 dropped to 37% in the third quarter of 2024, reaching the lowest level since the first quarter of 2020, according to the Census’s Housing Vacancy Survey (HVS). Amidst elevated mortgage interest rates and tight housing supply, housing affordability is at a multidecade low. The youngest age group, who are particularly sensitive to mortgage rates, home prices, and the inventory of entry-level homes, saw the largest decline among all age categories.

The U.S. homeownership rate held steady at 65.6% in the third quarter of 2024, showing a flat trend over the last three quarters.  However, this marks the lowest rate in the last two years. The homeownership rate remains below the 25-year average rate of 66.4%.

The national rental vacancy rate went up to 6.9% for the third quarter of 2024, and the homeowner vacancy rate inched up to 1%. The homeowner vacancy rate remains close to the survey’s 67-year low of 0.7%.

Homeownership rates declined across all age groups compared to a year ago, except for those aged 55-64. Householders under 35 experienced the largest drop, declining by 1.3 percentage points from 38.3% to 37%. The 45-54 age group also saw a 1.3 percentage point decrease, decreasing from 71% to 69.7%. For householders aged 35-44, who experienced a modest 0.6 percentage point decline. Among those 65 years and over, homeownership inched down slightly from 79.2% to 79.1%. In contrast, the homeownership rate of the 55–64 age group rose to 75.9% from 75.4%.

The housing stock-based HVS revealed that the count of total households increased to 132.1 million in the third quarter of 2024 from 130.3 million a year ago. The gains are largely due to gains in both renter household formation (1.1 million increase), and owner-occupied households (655,000 increase).

Discover more from Eye On Housing

Subscribe to get the latest posts sent to your email.


This article was originally published by a eyeonhousing.org . Read the Original article here. .


With housing affordability at a multidecade low, housing costs have become a major issue in the 2024 presidential election. While NAHB reports the national homeownership rate from the Census Bureau’s Housing Vacancy Survey on a quarterly basis, examining characteristics across congressional districts provides valuable insights.

A recent NAHB analysis of 2023 American Community Survey shows about two-thirds (65.2%) of US households are homeowners, yet there are forty congressional districts where renters represent the majority. Another NAHB post found that in the second quarter of this year the homeownership rate for households under the age of 35 has dropped to its lowest level in four years, as higher mortgage rates and low inventory have made affordability a bigger challenge for first-time buyers. As the largest cohort of millennials reach peak homebuying years, it is important to take a closer look at homeownership rate for those under age 35. This post will focus on comparing the homeownership rates of young adults (under 35) across congressional districts using 2023 ACS data.

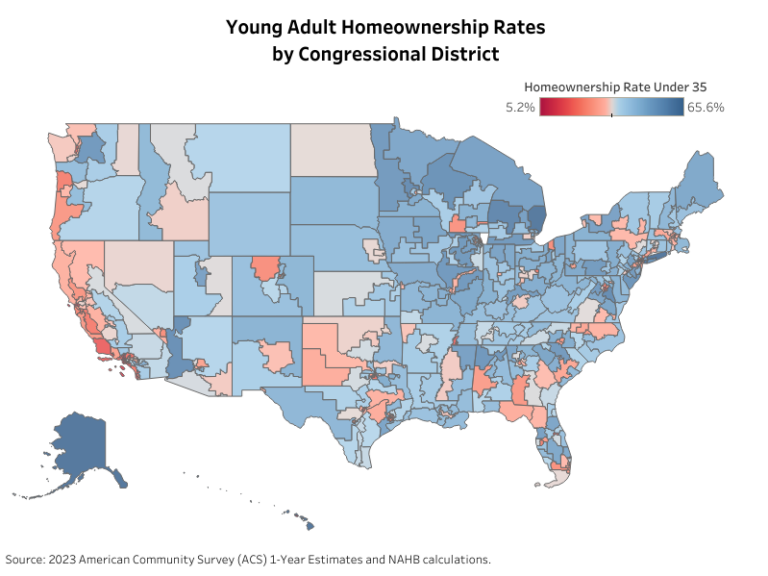
The map below illustrates variation in young adults’ homeownership rates across congressional districts, ranging from 5.2% to 65.6%. In general, young adults’ homeownership rates tend to follow a distinct pattern with respect to the overall homeownership rate, particularly in the top five districts with the highest homeownership rates and the bottom five with the lowest.

Table 1 shows that the top five districts with the highest young adults’ homeownership rate also have overall homeownership rate above 80%. However, the share of young adults in the top two districts is relatively low. In New York’s 1st and 4th district, 65% of young adults are homeowners, but they only make up only 8.9% and 9.8% of the overall population. Following that, Michigan’s 9th and 2nd districts have the third and fourth highest young adults’ homeownership rates above 60%.

Table 1Congressional DistrictYoung Adults Homeownership RateOverall Homeownership RateYoung Adults Share of PopulationNew York, District 165.6%83.8%8.9%New York, District 465.2%80.7%9.8%Michigan, District 965.2%84.9%14.1%Michigan, District 261.0%82.4%17.3%Maryland, District 559.3%81.7%13.2%

Table 2 shows the bottom five districts with the lowest young adult homeownership rates. Like the top five districts, those with the lowest young adult homeownership rates also tend to have lower overall homeownership rates. Among the bottom 15 districts, most are in New York and California, with only the 15th lowest in Washington, D.C. The West coast, in general, tends to have lower homeownership rates.

Table 2Congressional DistrictYoung Adults Homeownership RateOverall Homeownership RateYoung Adults Share of PopulationNew York, District 135.2%12.8%20.4%California, District 347.5%22.0%24.8%New York, District 157.9%15.9%18.3%New York, District 78.2%22.0%33.0%California, District 308.7%30.1%24.4%

Among fifty States and the District of Columbia, New York has congressional districts with both the highest and lowest homeownership rates. This mirrors the findings of overall homeownership rate in our previous post. The highest young adults’ homeownership rate is in New York’s 1st district, while the lowest is in New York’s 13th district.

Discover more from Eye On Housing

Subscribe to get the latest posts sent to your email.


This article was originally published by a eyeonhousing.org . Read the Original article here. .


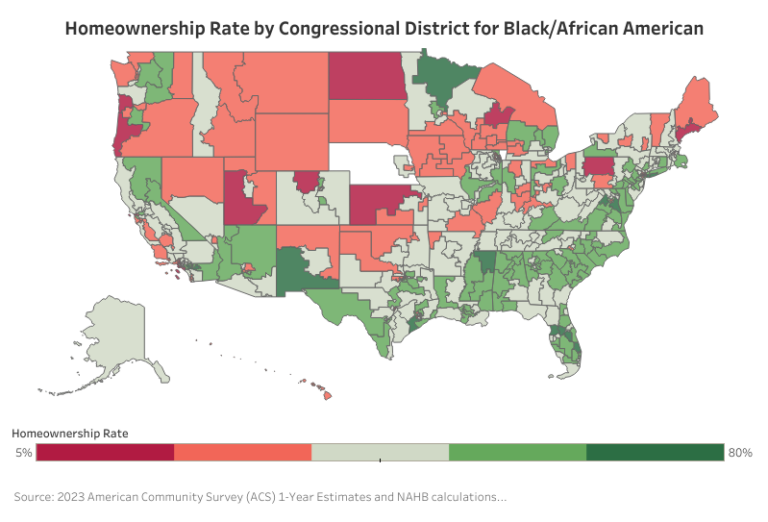
Homeownership is an important voter issue for the upcoming election with both presidential candidates putting forth housing policies to tackle the housing affordability crisis. In a recent NAHB post, the national homeownership rate sat at 65%, but there are large disparities in homeownership when broken down by race. For Black/African American households, the homeownership rate was 45%. Hispanic/Latino households fared slightly better at 51%, while all other minority households had a homeownership rate of 55%.

According to the 2023 American Community Survey (ACS), the district with the highest homeownership rate for Black/African American households was Maryland’s 5th District at 80%, although the overall homeownership rate for this district was slightly higher at 82%. In this district, 43% of the households were Black/African American. On the opposite spectrum, California’s 34th District had the lowest Black/African American homeownership rate in the nation at just 5%. This district also had one of the lowest overall homeownership rates in the country at 22%. The table below highlights the top five districts where Black/African American homeownership is the highest.

Congressional DistrictBlack/African American Homeownership RateOverall Homeownership RateShare of PopulationMaryland, District 580%82%43%New York, District 475%81%16%California, District 4172%75%5%Virginia, District 1072%79%8%Florida, District 2171%79%11%Source: 2023 American Community Survey and NAHB calculations.

The top 3 districts with the highest homeownership of Hispanics/Latino households were in the Midwest. Michigan’s 1st District held the highest homeownership rate for the Hispanics/Latino households (78%), although they constituted for 2% of the district’s population. The overall homeownership rate for the district was slightly higher (80%), however, in Texas’ 23rd District, Hispanics/Latino’s homeownership rate was slightly higher than the overall district rate at 75% compared to 74%. In this district, Hispanics/Latinos formed a significant portion of the population, accounting for nearly 60%.

Congressional DistrictHispanic/Latino Homeownership RateOverall Homeownership RateShare of PopulationMichigan, District 178%80%2%Minnesota, District 676%81%3%Illinois, District 1676%80%5%Arizona, District 975%77%22%Texas, District 2375%74%58%Source: 2023 American Community Survey and NAHB calculations.

For all other minority households, Minnesota’s 6th District stood out with the highest homeownership rate at 85%. This rate also exceeded the overall homeownership rate for this district of 81%. In fact, the top 10 congressional districts with the highest homeownership rate for this group exceeded the district-wide homeownership rates. Tennessee’s 8th District, which has the second-highest minority homeownership rate at 83%, surpassed the overall district rate by 11 percentage points.

Congressional DistrictAll Other Race Homeownership RateOverall Homeownership RateShare of PopulationMinnesota, District 685%81%4%Tennessee, District 883%72%2%Virginia, District 1083%79%19%Texas, District 2281%76%20%Illinois, District 1481%76%12%Source: 2023 American Community Survey and NAHB calculations.

There were also significant geographical variations of homeownership rates between each racial group with Black/African American households experiencing the largest variations across the country. Black/African American homeownership was concentrated in southern states while notably lower in the Midwest, Mountain West, and parts of the Northeast. In contrast, Hispanic/Latino homeownership tended to be higher in Southwest districts, while other minority groups maintained stronger rates nationwide.

Overall, a consistent geographical pattern of homeownership across minority households can be found. For example, North Dakota and neighboring districts stood out with much lower minority homeownership. On the other hand, Southern states, where median sale prices per square foot for single-family detached homes were below the national average of $150, generally exhibited higher rates of minority homeownership.

Additional housing data for your congressional district are provided by the US Census Bureau here.

Footnote(s):

Discover more from Eye On Housing

Subscribe to get the latest posts sent to your email.


This article was originally published by a eyeonhousing.org . Read the Original article here. .


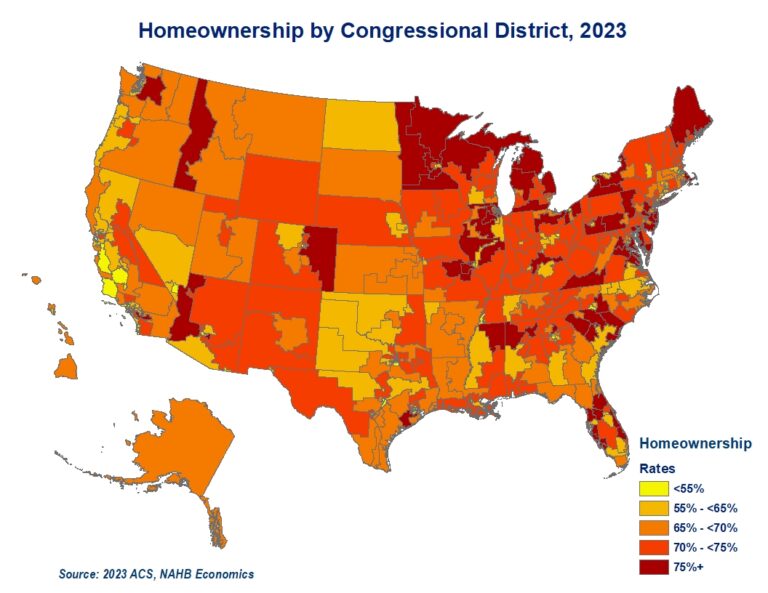
With housing being a key issue for the 2024 election cycle, it is worth analyzing distinct characteristics as well as similarities that housing markets in congressional districts share. The differences start with a substantial variation in homeownership rates across congressional districts.

While the 2023 American Community Survey (ACS) reports that close to two thirds of US households (65.2%) are home owners, there are forty congressional districts where renter households represent the majority. In twelve of these districts, renters account for more than two thirds of households. This list includes eight urban high-density congressional districts in New York, three districts in California and New Jersey’s 8th congressional district. The pattern of urban congressional districts registering lower home ownership rates repeats across the country.

At the other end of the spectrum, there are seven congressional districts with home owners representing over 80% of households. These include three districts in Michigan, two in New York, and one in both Maryland, and Minnesota.

New York stands out with simultaneous congressional districts with the lowest and second highest homeownership rates. Close to 84% of households in New York’s 1st district located in eastern Long Island are home owners. The only other congressional district that registers a higher homeownership rate is Michigan’s 9th congressional district located in the Thumb at 85%.   In contrast, in New York’s urban 13th and 15th districts, home owners comprise a minority of less than 16% and 13%, respectively.

California is another example of substantial variation of homeownership rates across congressional districts within a state. In California’s 41st district in Riverside County, 3 out of 4 households are home owners. At the same time, in California’s 34th district in the city of Los Angeles, only 22% of households live in a home they own. 

Population density, racial and ethnical makeup, as well as varying cost of ownership, all contribute to substantial variation in homeownership rates across the US congressional districts.

Additional housing data for your congressional district are provided by the US Census Bureau here.

Discover more from Eye On Housing

Subscribe to get the latest posts sent to your email.


This article was originally published by a eyeonhousing.org . Read the Original article here. .


The homeownership rate for multigenerational households increased by 4.9 percentage points (pp) over the last decade, but there’s another household type that experienced an even larger increase in the homeownership rate over the same period—single parent households.

In further analysis of the Census’s American Community Survey (ACS) data, NAHB dives deeper into the homeownership rate for other family household types: married couples with no children, married couples with children and single parent households. In 2022, most family households were married with no children (44%), followed by married with children (26%), single parents (12%), others (12%), and multigenerational families (6%). This composition has not changed much, with the exception of a gradual decrease in the share of married with children and single parent households, which is offset by an increase in the share of married with no children households.

The homeownership rate for single parent households saw the largest gains in homeownership rate with an increase of 5.7 percentage points over the decade. However, the overall level of homeownership rate for single parent households remains the lowest among all other family household types at just 41%.    Another group that saw a large increase was the married couple with children households, with a 4.5% increase over the decade from 73% to 78%. Like multigenerational households, these increases were spurred on by historically low mortgage rates in 2021.

The only household type to have plateaued was married without children. As a matter of fact, these households saw decreasing homeownership rates for a few years before creeping back up to be at roughly the same rate as they were ten years ago at 84%. Nonetheless, married without children households remain as the group with the highest homeownership rate with an average rate of 84% over the decade.

We also examined the estimated home price-to-income ratio (HPI) for various household types. To calculate the home prices for recent homebuyers we used the median property value for owners who moved into their property within the past year. Here is where we see the effect of how multigenerational households were able to lower their HPI with pooled income and budgets. In contrast are single parent households with their estimated home prices approaching five times their income, indicating that these households are significantly burdened by housing costs.   

Given that homeownership rates jumped in recent years for most household types despite increases in home prices suggests that the low mortgage rates in 2021 made steep home prices more palatable for homebuyers to enter the market. However, it is unlikely that we’ll see a continued increase in homeownership while mortgage rates remain elevated. 

Discover more from Eye On Housing

Subscribe to get the latest posts sent to your email.


This article was originally published by a eyeonhousing.org . Read the Original article here. .


The homeownership rate for multigenerational households surpassed that of all other family household types in 2022 and now stands at 74.2%, exceeding the homeownership rate of other family households of 73.9%. Just a decade ago, the homeownership rate for multigenerational stood at 69.3%, second to other family households at 71.3%.

Multigenerational households are defined by the Census Bureau as households with three or more generations living together. In this post, NAHB used the American Community Survey (ACS) 1-year estimates from 2012 to 2022 to estimate the homeownership rates (which is calculated as the total number of owner-occupied units divided by the total number of applicable households) for different household types.

In 2012, the homeownership rate for multigenerational households stood at 69.3%, 2 percentage points (pp) below the 71.3% homeownership rate for other family households. The gap in homeownership rates between these household types remained with higher rates for other family households until 2021. By 2022, the gap inverted with 74.2% of multigenerational households owning homes versus 73.9% of other family households. This represents about a 5 pp increase in homeownership rate for multigenerational households over the decade compared to a 2.6 pp increase for other family households.

The primary factor that explains the rise in the multigenerational household homeownership rate is the availability of more capital during the period of low interest rates in 2021. While the median family income for multigenerational households consistently exceeds that of other family households’ income due to resource pooling, this difference has widened over time. For example, real median income for multigenerational households and other family households in 2012 were $63,643 and $62,633, respectively, with a difference of about $1,000. By 2022, this difference widened almost twelvefold to $11,778, with multigenerational households earning $103,501 and other family households earning $91,723.

Changes in family structure can be ruled out as a factor in this difference as the average household size has remained constant over the decade with an average of 5.1 people per multigenerational household, of which two are working members, while other family households have had an average of 3.1 people and 1.5 working members. This suggests that the income per person in a multigenerational household has been rising faster than other family households.

Income pooling has also buffered multigenerational households through rising home prices despite the higher prevalence of these households in more cost burdened areas. The chart below shows a strong correlation between the owner housing cost burdens and the incidence of multigenerational households. States with larger shares of housing cost burdened households (those that spend more than 30% of their income on housing) also have the higher shares of multigenerational households.

The faster growing income of multigenerational households also helped them afford more expensive homes in recent years, compared to other family households.  Looking at homeowners that moved into owned properties within the year (as a proxy for recent homebuyers), the median home values for multigenerational households have gone from $165,000 in 2012 to $400,000 in 2022. In comparison, the median home values for other family homebuyers went from $180,000 to $380,000. In other words, multigenerational households now pay $20,000 more for a home. However, because they have a higher pooled household income, their estimated home price-to-income (HPI) ratio remains lower than that of other family households.

To conclude, the rising homeownership rate among multigenerational households highlights their financial resilience and adaptability in the face of changing economic conditions. Despite living in less affordable states, these households leverage their pooled incomes to navigate higher home prices effectively. The significant increase in their median income over the past decade has enabled them to capitalize on favorable mortgage rates and propel their homeownership rate to a new decade high.

Footnote:

Discover more from Eye On Housing

Subscribe to get the latest posts sent to your email.


This article was originally published by a eyeonhousing.org . Read the Original article here. .

Pin It