This article was originally published by a www.houzz.com . Read the Original article here. .
This article was originally published by a www.houzz.com . Read the Original article here. .


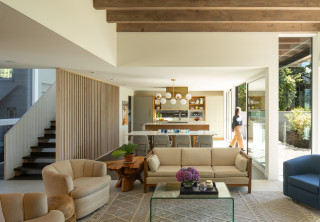
A Washington, D.C., family of four asked designer Sara Swabb of Storie Collective to update its 1936 Tudor-style home in a way that honored the home’s roots while bringing it into the modern era. In the entry, Swabb, who uses Houzz Pro business software, opened things up by widening doorways to keep sightlines clear to the kitchen and dining areas and allow natural light to be shared between the rooms.
In the kitchen, a warm green cabinet color, an arched range alcove and handmade terra-cotta tile flooring in a herringbone pattern create a fresh style that nods to the home’s past. A zellige tile accent wall spans the room, helping visually connect the main cooking area to a nearby zone containing a paneled fridge, a secondary sink and a built-in coffee machine. Textured wallpaper and patterned draperies energize the dining room, and midcentury modern furnishings perk up the living room.
Read more and save photos
This article was originally published by a www.houzz.com . Read the Original article here. .
![]()
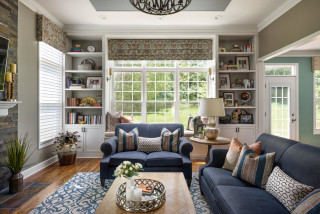
Designer: Bonnie Kespohl of Kasa Interior Design
Location: Edina, Minnesota
Size: 204 square feet (19 square meters); 12 by 17 feet
Homeowners’ request. “This is my personal home and this is my husband’s office space,” designer Bonnie Kespohl says. “While the existing dark oak wainscoting was in mint condition, the overall space felt heavy and dated.”
Special features. “He wanted to lighten up the space, which was accomplished through adding another window, adding recessed lights overhead [digitally removed by the photographer], replacing the existing built-in with an updated built-in painted in Benjamin Moore’s Blue Note, and lightening up the carpet,” Kespohl says. “We also refinished his existing maple desk and added new white powder-coated legs for a fresh look.
“We removed a portion of the existing wood wainscot in the window bump-out to the left of the desk and instead treated the opening with flat paneling enameled in Benjamin Moore’s Blue Note to match the new built-in. This helped to mix in a modern nod to go with the rest of the renovated home but still played nicely with the existing wainscoting.”
Cord and document control. “We have one visible cord from the monitor [not shown] to the wall, as a floor outlet wasn’t viable for this renovation,” Kespohl says. “We have a grommet on the built-in credenza so charging cords can plug in behind the file drawers below. The base of the credenza is fitted with three shallow top drawers for office supplies and personal effects, while the three deeper base drawers are sized appropriately for filing documents. The space also has a closet so residual items can be stored away out of sight.”
Designer tip. “Try to reimagine existing elements with just slight changes and add-ins,” Kespohl says. “Originally we had discussed removing the existing wood wainscoting. However, I loved it and it was in excellent condition, so we had to try to save it. It’s a beautiful feature of the original home, and we were able to modernize the office space and lighten it up, all while keeping the wood in play.”
Sconce: Lani in aged brass, Mitzi; carpet: Traverse in Chambray, Nourison
Trending Now: 10 Popular New Home Offices
This article was originally published by a www.houzz.com . Read the Original article here. .

Home buyers moved off the sidelines in September following the Federal Reserve’s recent move to cut interest rates for the first time in four years.
Sales of newly built, single-family homes in September increased 4.1% to a 738,000 seasonally adjusted annual rate from a downwardly revised August number, according to newly released data from the U.S. Department of Housing and Urban Development and the U.S. Census Bureau. The pace of new home sales in September is up 6.3% compared to a year earlier.
Despite challenging affordability conditions, home builder confidence edged higher in October as they anticipate that mortgage rates will gradually, in an uneven manner, moderate in the coming months. There is a significant need for additional housing supply, as many prospective home buyers are entering the market.
Following the Fed’s actions in September, mortgage rates fell to 6.18%, from 6.5% in August. However, new home sales will likely weaken in October due to a recent rise in long-term rates.
A new home sale occurs when a sales contract is signed, or a deposit is accepted. The home can be in any stage of construction: not yet started, under construction or completed. In addition to adjusting for seasonal effects, the September reading of 738,000 units is the number of homes that would sell if this pace continued for the next 12 months.
New single-family home inventory in September remained elevated at a level of 470,000, up 8.0% compared to a year earlier. This represents a 7.6 months’ supply at the current building pace. Completed for-sale new homes rose to 108,000, the highest level since 2009.
The median new home sale price in September was $426,300, essentially unchanged from a year ago. The Census data reveals a gain for new home sales priced below $300,000, which made up 17% of new home sales in September, compared to 14% a year ago.
Regionally, on a year-to-date basis, new home sales are up 19.2% in the Midwest, 1.1% in the South and 3.4% in the West. New home sales are down 1.1% in the Northeast.
Discover more from Eye On Housing
Subscribe to get the latest posts sent to your email.
This article was originally published by a eyeonhousing.org . Read the Original article here. .
![]()
1. Business activity outlook increased. The Expected Business Activity Indicator, related to project inquiries and new committed projects, increased by 10 points, to 62, for the fourth quarter of 2024, from 52 for the third quarter of 2024. This means more construction firms anticipate quarter-over-quarter growth than anticipate a decline.
Expectations for project inquiries increased by 7 points, to 59 (from 52 for Q3), and expectations for new committed projects increased by 12 points, to 64 (from 52 for Q3).
Both build-only and design-build firms are more optimistic for Q4 than they were for the previous quarter. The expected activity indicator for build-only firms increased 9 points, to 62 (from 53 for Q3), and for design-build firms it increased 10 points, to 61 (from 51 for Q3).
The indicator is based on survey questions about whether businesses expect the number of project inquiries and new projects to increase, decrease or remain unchanged in the coming three months compared with the previous three months.
This article was originally published by a www.houzz.com . Read the Original article here. .

Despite recent easing mortgage rates and improved inventory, existing home sales fell to a 14-year low in September as elevated home prices are causing potential buyers to hold out for lower rates, according to the National Association of Realtors (NAR). Sales remained sluggish as the lock-in effect kept home prices elevated. However, we expect increased activity in the coming months as mortgage rates moderate with additional Fed easing. Improving inventory should help slow home price growth and enhance affordability.
Homeowners with lower mortgage rates have opted to stay put, avoiding trading existing mortgages for new ones with higher rates. This trend is driving home prices higher and holding back inventory. With the Federal Reserve beginning its easing cycle at the September meeting, mortgage rates are expected to gradually decrease, leading to increased demand and unlocking lock-in inventory in the coming quarters.
Total existing home sales, including single-family homes, townhomes, condominiums, and co-ops, fell 1.0% to a seasonally adjusted annual rate of 3.84 million in September, the lowest level since October 2010. On a year-over-year basis, sales were 3.5% lower than a year ago.
The first-time buyer share remained at 26% in September, matching the lowest level since November 2021 and August 2024, but down from 27% in September 2023.
The existing home inventory level rose from 1.37 million in August to 1.39 million units in September and is up 23.0% from a year ago. At the current sales rate, September unsold inventory sits at a 4.3-months supply, up from 4.2-months last month and 3.4-months a year ago. This inventory level remains low compared to balanced market conditions (4.5 to 6 months’ supply) and illustrates the long-run need for more home construction. However, the count of single-family resale homes available for sale is up almost 22.2% on a year-over-year basis.
Homes stayed on the market for an average of 28 days in September, up from 26 days in August and 21 days in September 2023.
The September all-cash sales share was 30% of transactions, up from 26% in August and 29% a year ago. All-cash buyers are less affected by changes in interest rates.
The September median sales price of all existing homes was $404,500, up 3.0% from last year. This marked the 15th consecutive month of year-over-year increases and the highest level for the month of September. The median condominium/co-op price in September was up 2.2% from a year ago at $361,600. This rate of price growth will slow as inventory increases.
Existing home sales in September were mixed across the four major regions. In the Northeast, Midwest, and South, sales fell by 4.2%, 2.2%, and 1.7%, respectively, while sales in the Midwest rose by 4.1%. On a year-over-year basis, sales decreased in the Northeast (-6.1%), Midwest (-5.3%) and South (-5.5%). Sales in the West increased 5.6% from a year ago.
The Pending Home Sales Index (PHSI) is a forward-looking indicator based on signed contracts. The PHSI rose from 70.2 to 70.6 in August due to lower mortgage rates. On a year-over-year basis, pending sales were 3.0% lower than a year ago per National Association of Realtors data.
Discover more from Eye On Housing
Subscribe to get the latest posts sent to your email.
This article was originally published by a eyeonhousing.org . Read the Original article here. .

Residential improvement spending softened in 2023 due to elevated interest rates, high inflation, and sluggish home sales. According to the Bureau of Economic Analysis’ National Income and Product Accounts (NIPA), expenditures for residential home improvements rose 2% to $363 billion in 2023, from $356 billion in 2022. The 2% year-over-year (YOY) gain in 2023 marks the smallest YOY gain since 2011. This annual data indicates that the YOY gain in residential improvement spending slowed, but the remodeling market remained solid.
In this article, NAHB’s analysis of the 2023 Home Mortgage Disclosure Act (HMDA) data provides insight into remodeling activity in 2023 by age group, and by U.S. states and counties. The 2023 HMDA data, published by the Consumer Financial Protection Bureau (CFPB), covers detailed information on residential mortgage lending in 2023, including the type, purpose, and characteristics of home mortgage applications or purchased loans, and demographic and other information about loan applicants.
According to the 2023 HMDA data, the number of home improvement loan applications declined by 17% in 2023, compared to the previous year. Moreover, the total amount of home improvement loans was about 44 billion (24%) less than the total amount in 2022.
Age Group Analysis:
Figure 1 below presents the number of home improvement loan applications by applicants’ age from 2018 to 2023. Among all age groups, the number of home improvement loan applications surged in 2022 and declined in 2023. Compared to 2022, the number of home improvement loan applications decreased by 23% in 2023 for applicants aged between 25 and 34 and between 35 and 40. Applicants between the ages of 45 and 54 remained the largest age group to apply for home improvement loan applications, even though the number of loan applications for this age group reduced by 18% in 2023.
For applicants under 55 years old and above 74 years old, the number of loan applications in 2023 was higher than the pre-pandemic level in 2018 and 2019. Meanwhile, applicants aged between 55 and 74 had a lower number of loan applications in 2023 than in 2018 and 2019. As interest rates reached historically high levels in 2023, homeowners used savings to pay for home improvements, avoiding the extra expense of interest on loans.
State-Level Analysis:
While remodeling activity changed among different age groups, remodeling has also varied across geographic locations due to the cost of living, local economic conditions, and house prices.
With respect to total home improvement loan applications, California had the highest number of home improvement loan applications in 2023, with 118,649 applications. Florida came in second with 102,746 home improvement loan applications. Wyoming and Alaska had the lowest total numbers of home improvement loan applications with 1,312 and 1,358, respectively.
When we look at home improvement loan applications per 1,000 population, two states in New England, Rhode Island and New Hampshire, had the highest number of home improvement loan applications, with a rate of 6.4 and 6.0 applications per 1,000 population, respectively. Louisiana had the lowest number of home improvement loan applications, with a rate of 1.6 applications per 1,000 population.
In total, there were 3.7 loan applications for home improvements for every 1,000 population in the United States. California, the most populous state of the United States, reported 3.0 applications per 1,000 population, which is lower than the national average rate.
County-Level Analysis:
The analysis of county-level home improvement loan applications per 1,000 population reveals that the aggregate market population is not significantly related to the number of per capita home improvement loan applications. In 2023, the top 10 most populated counties in the United States had an average rate of 2.6 loan applications per 1,000 population. Los Angeles County in California, one of the most populous counties, reported a rate of 2.8 loan applications per 1,000 population in 2023. Meanwhile, some counties with a lower population had a higher loan application rate (that is, the number of home improvement loan applications per 1,000 population). For example, Nantucket County in Massachusetts, with a population of about 14,000, had the highest loan application rate of 11.1 among all the counties in the United States. Camas County in Idaho, with roughly one thousand population, had a loan application rate of 8.9, higher than about 99.7% of the counties in the United States.
Additionally, the analysis finds that home improvement loan applications are relatively more common in the Mountain and New England Divisions. In total, there were 43 counties that reported 7 or higher home improvement loan applications per 1,000 population, and more than 72% of these counties were in the Mountain and New England Divisions. None of these 43 counties were in the West South Central, East South Central, or West North Central Divisions. The top five counties with the highest home improvement loan application rate were: Nantucket County (MA), Grand Isle County (VT), Dare County (NC), Boise County (ID), and Barnstable County (MA).
Discover more from Eye On Housing
Subscribe to get the latest posts sent to your email.
This article was originally published by a eyeonhousing.org . Read the Original article here. .

Approximately 2.3 million tax returns filed for tax year 2023 utilized the Energy Efficient Home Improvement credit (25C tax credit), according to the latest IRS clean energy tax credit statistics. Through May 23rd of the 2024 tax filing season for 2023 returns, almost 138 million tax returns had been filed with the IRS, which indicates that 1.7% of returns filed utilized the 25C credit. There are various types of improvements that can be claimed under the 25C credit; each improvement varies in its cost and credit amount. Additionally, claim rates of the 25C tax credit varies across taxpayers’ incomes as well as geographies. This post examines these data.
The 25C tax credit allows homeowners to claim qualifying energy efficiency improvements to their primary or secondary residence. Renters can also claim the credit for certain energy efficient appliance and product expenditures. The 25C credit amount is based on 30% of the improvement’s cost and is subject to the improvement’s specific credit limit. For improvements such as electric or natural gas heat pumps, heat pump water heaters, or biomass stoves/boilers, the credit limit per year is $2,000. All other home improvements, such as efficient AC units, insulation/air sealing or home energy audits are limited to a combined credit limit of $1,200, with individual limitations for each item. The total annual credit amount that can be claimed is $3,200 per year. The table below from the Department of Energy shows the available tax credit amounts for tax years 2023 through 2032.
Cost of Improvement and Usage
The credit can cover both the purchase and installation costs for heat pumps, energy efficient AC units, furnaces/ boilers, water heaters, biomass stoves/ boilers, and electric panel/circuit board upgrades. For building envelope components (insulation, doors, windows, skylights), only the purchase can be covered.
The recent IRS data indicates that the most expensive improvement claimed in tax year 2023 was the purchase and installation of electric or natural gas heat pumps at an average cost of $11,213. The costliest item that did not cover installation costs was exterior windows and skylights at $9,143.
Shown below in orange are the average costs for each 25C improvement item in the IRS data. In blue is the credit amount of each improvement, based on its average cost and applicable credit limits. For almost all items, 30% of the improvement’s cost far surpass the credit limit amounts. The only exceptions are heat pump water heaters and biomass stoves/broilers that on average do not exceed the credit limit.
For example, the average cost of installation and purchase of a biomass stove/broiler was $5,221. Taking 30% of this cost, we find a credit amount of $1,566, which is below the credit limit of $2,000 for this improvement. Compared with the costliest improvement, electric or natural gas heat pumps, 30% of the average cost is $3,364. This is above the credit limit, making the largest possible credit amount $2,000 for electric or natural gas heat pumps installation and purchase. The average credit amount, shown below in purple, was $882, well below the maximum possible credit limit of $3,200, shown in light purple.
Of the 2.3 million taxpayers that claimed the 25C credit, the most frequent improvement was the purchase of insulation or air sealing materials or system with 699,440 returns (29.9%). This improvement is the only item to the combined cap of $1,200 that also has an individual limit of $1,200. Improvements that have a combined limit of $1,200 are in the green shaded box below. The least claimed improvement was home energy audits, which also had the lowest credit limit of $150.
Income and Geographic Differences
The highest claim rate of the 25C credit by income was for taxpayers in the $200,000-$500,000 income range, with 4.83% of returns claiming a 25C tax credit. The lowest was for incomes between $1-$10,000, as 0.02% of returns claimed the credit.
Geographically, the highest claim rate of the 25C tax credit was in Maine, with 3.03% of tax returns in the state claiming 25C. The lowest rate was in Hawaii, where only 0.50% of returns claimed the credit. Usage was significantly higher in the Midwest and Northeast, as the top 10 usage rates were all located in these regions.
While Maine has the highest claim rate, Washington had the highest average credit amount at $1,191. The lowest average credit amount was in Iowa, at $743. Of particular note, Michigan and Wisconsin had low average credit amounts but were among the top ten in terms of claim rates. In Michigan, the average credit amount was $747, ranking 49th (includes DC), while the claim rate was 9th at 2.45%. In Wisconsin, the average credit amount was $761, ranking 48th, and the claim rate was 6th, at 2.51%. The reasoning for this trend could be due to the type of improvements by region but there is no IRS data published yet to clarify this hypothesis.
Additionally, usage rates could be relatively lower in the Southern portion of the U.S. because the costliest items, such as heat pumps, are not as critical as regional weather is warmer. Since this credit cannot be applied to new construction, it should also be noted that most new homes are being built with central AC, making it less likely to be claimed as a 25C improvement. Also, most homes in the North are built without heat pumps which allows for more opportunity for the cost to be claimed under 25C if such improvement is made. Nationally, the claim rate was 1.7% with an average credit amount of $882.
Discover more from Eye On Housing
Subscribe to get the latest posts sent to your email.
This article was originally published by a eyeonhousing.org . Read the Original article here. .

Work from the top down: Tackle the ceiling, picture rails and high shelves first, then work toward the floor. A vacuum cleaner with a long hose and multiple attachments is the most efficient tool, as it will suck up the dust before it can settle on the furniture below.
For really high spots, be prepared to get out the stepladder once in a while. Rather than dangerously balance a vacuum cleaner on it, track down a nifty flexible-wand duster with a good reach. This will get to awkward and small spaces, trapping the dust on its high-pile sleeve.
If your vacuum cleaner’s nozzle doesn’t fit in narrow spaces, such as sliding door tracks, try sliding on a cardboard tube from a roll of paper towels. You can crush, fold and mold it to handle tricky spaces.
Shop for vacuums on Houzz
This article was originally published by a www.houzz.com . Read the Original article here. .

NAHB published research earlier this year on home buyer preferences called What Home Buyers Really Want. Consumers were asked to rate how 19 technology features would influence their home purchase decision, if at all, using the following four-point scale:
Do not want – not likely to buy a home with this design or feature.
Indifferent – wouldn’t influence decision.
Desirable – would be seriously influenced to purchase a home because this design or feature was included.
Essential/Must have – unlikely to purchase a home without this design or feature
Seventy-eight percent of home buyers rated a programmable thermostat as either essential/must have or desirable, followed by security cameras (76%), video doorbell (74%), and wireless home security system (70%). Sixteen of the 19 technology features had at least 50% of home buyers rating them as essential or desirable.
The top eight features reveal that home buyers are looking for technology that helps them achieve two main goals:
Improve Energy Efficiency (programmable thermostat, multi-zone HVAC system, lighting control system, energy management system/display) AND
Increase Safety (security cameras, video doorbell, wireless & wired home security system)
Additionally, like the other areas of the home covered in the study, every question on technology features is tabulated by the buyer’s income, age, geography, race, household type, and the price they expect to pay for the home. These details can be very useful in particular cases. For example, the study discusses the five technology features that have the largest preference margins between the youngest and oldest buyers along with analyzing the prevalence of virtual tours by income and price point.
Discover more from Eye On Housing
Subscribe to get the latest posts sent to your email.
This article was originally published by a eyeonhousing.org . Read the Original article here. .

Giving guests options for gathering and relaxing is important for facilitating an engaging party atmosphere. So pros recommend creating multiple seating areas that allow for intimate conversations or larger chats, both inside and out.
Mixing seating pieces like sofas, love seats, chaise lounges, accent chairs, swivel chairs and movable footstools can make numerous arrangements possible.
“We like to provide multifunctional pieces to our clients who love to entertain,” designer Robin Violandi of Violandi + Warner Interiors says. “It might be occasional chairs or upholstered cubes that are easy to move to different rooms to provide additional seating. Multiple small side tables are great for providing a place to put a drink or a small tray for guests. All of these items are easy to move from room to room and can serve double duty.”
This Dallas living room by Delaney’s Design is a great example. It features a casual seating area near a limestone fireplace with a sofa and two armchairs. The armchairs can swivel around to face a second seating area with a sectional sofa and two movable ottomans in front of a large-screen TV.