Tag

home

Browsing


In the home building industry, fringe benefits add an additional 18% to employees’ compensation on top of payroll, according to NAHB’s analysis of the latest 2022 Economic Census data. The rates vary across residential construction sub-sectors with single-family and multifamily general contractors contributing an average of 20% on top of payroll. Fringe benefits in residential remodeling and for-sale building average 19% and 16%, respectively.

Total fringe benefits consist of legally required and voluntarily provided benefits. The legally required component includes employers’ contribution to Social Security and Medicare, unemployment insurance, worker’s compensation insurance, and state-mandated temporary disability and other state-specific contributions. Since these benefits are mandatory by law, it may seem counter-intuitive to view them as “fringe” benefits. Nevertheless, the Economic Census counts them as “legally required fringe benefits” paid on top of payroll.

In 2022, legally required fringe benefits contributed by single-family general contractors and remodelers amounted to an additional 13% on top of payroll. The average rate for multifamily general contractors and for-sale builders was 10% and 9%, respectively. Averaged across the four subsectors of home building, legally required benefits amounted to just under 12% of payroll.

Voluntarily provided fringe benefits include expenditures paid by employers for life insurance premiums, pension plans, insurance premiums on hospital and medical plans, welfare plans, and union negotiated benefits. Other perks provided by employers, such as paid holidays, vacations, sick pay, bonuses, and jury pay, may seem like valuable “fringe” benefits but are technically counted in payroll.

In 2022, voluntary fringe benefits provided by multifamily general contractors amounted to an additional 10% on top of payroll.  In the case of single-family contractors and for-sale builders, these benefits added 7% to compensation. The rate was lower for residential remodelers, where voluntary benefits amounted to 6% of payroll. Averaged across the four sub-sectors of home building, the voluntarily provided benefits approached an added cost of 7% on top of payroll.

In addition to the four residential construction subsectors discussed above, the home building industry also includes land developers and specialty trade contractors (STC). Since the Economic Census does not differentiate between residential and non-residential specialty trade contractors, this combined subsector is not included in the home building chart above. Nevertheless, the latest Economic Census shows that the fringe benefit rates were highest among specialty trade contractors – 28%, equally split between legally required and voluntary.

Among other things, the differences in the fringe benefit rates reflect variations in state-mandated regulations, size and legal form of companies, involvement in federally funded projects, unionization of workers, and employee participation rates in health and pension plans. For example, depending on the legal form of organization, accounting principles are different and can affect the estimated fringe benefit rates. For corporations, payroll includes compensation of executives, but for unincorporated businesses, such as individual proprietorships and partnerships, payroll excludes profit and other compensation of proprietors or partners. In addition, partners and proprietors may not be ineligible for the complete benefits package they offer to employees, also affecting the estimated fringe benefit rates for their businesses.

The data used in this analysis come from the Economic Census available only every five years. The Economic Census, like many other federal statistics programs, collects data only on establishments with payroll employees. In construction, an establishment operates continually at a single physical location but typically manages more than one project or job. A large building company may operate at more than one location but would file a separate report for each location or establishment.

Discover more from Eye On Housing

Subscribe to get the latest posts sent to your email.


This article was originally published by a eyeonhousing.org . Read the Original article here. .


This article was originally published by a
www.houzz.com . Read the Original article here. .


On a year-over-year basis, home prices grew at a rate of 3.75% for November, according to the S&P CoreLogic Case-Shiller Home Price Index (NSA). This marks an increase from the 3.59% growth rate recorded in October but is down from a peak of 6.54% in March 2024.

By Metro Area

In addition to tracking national home price changes, the S&P CoreLogic Index (SA) also reports home price indexes across 20 metro areas. Compared to last year, 19 of 20 metro areas reported a home price increase. There were 10 metro areas that grew more than the national rate of 3.75%. The highest annual rate was New York at 7.37%, followed by Chicago at 6.22% and Washington DC at 5.90%. Denver grew at the smallest rate at 0.92%, followed closely by Dallas at 1.02%. Tampa was the only area that experienced a decline from last year at a rate of -0.33%.

By Census Division

A similar index, the Federal Housing Finance Agency Home Price Index (SA) publishes not only national data but also data by census division. The national year-over-year rate was 4.22% for November. Meanwhile, the division with the highest year-over-year rate was 7.67% in New England, while the lowest was 1.81% in West South Central. A three-month trend in rates is shown for each division below. The FHFA Home Price Index releases their metro and state data on a quarterly basis, which NAHB analyzed in a previous post.

Discover more from Eye On Housing

Subscribe to get the latest posts sent to your email.


This article was originally published by a eyeonhousing.org . Read the Original article here. .


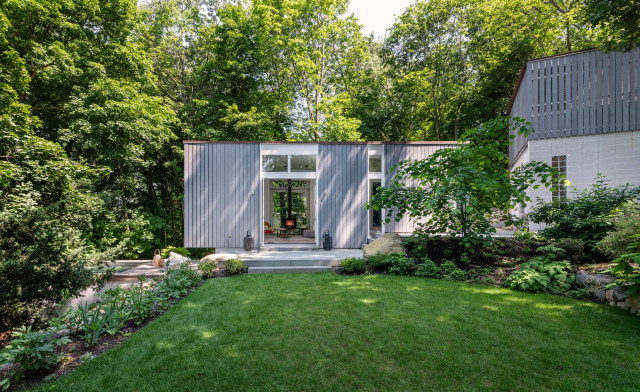
This Brighton, England, home is a rare thing in the city — a centrally located detached house, rich in history and with a beautiful garden. Built around 1840, it has Grade II listed status and sits within a historic preservation area. Consequently, any work on it would be subject to strict planning regulations and, in addition, its owners were committed to making any improvements both sympathetic to the building and environmentally responsible.

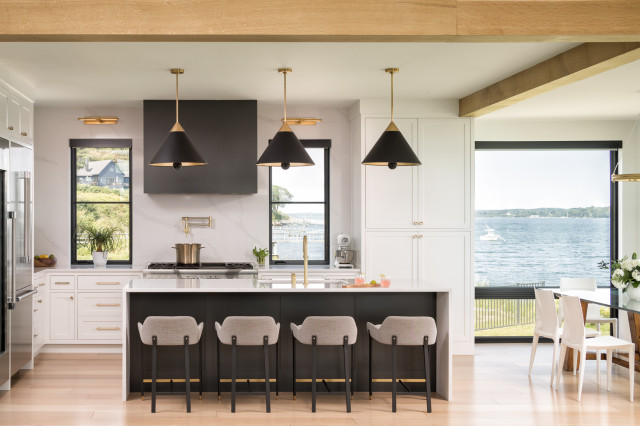
To get a feel for this special home, they lived in it for a couple of years before calling in interior designer Clare Topham to gently refresh it. She worked on various rooms, updating the heating, decor and lighting, but the kitchen posed perhaps the biggest challenge. “It was a dinky little room,” Topham says. “[The owners] knew they wanted to extend, but didn’t want it much bigger. They only wanted to build what they needed for the two of them. They were never going to whack a modernist extension on the back.”

The owners are really happy with their finished kitchen, which respects their home’s heritage but is outfitted with the latest energy-efficient appliances. Read on to see the newly extended space.


This article was originally published by a www.houzz.com . Read the Original article here. .


A limited amount of existing inventory along with solid demand helped new home sales end the year on an up note, even as buyers continue to grapple with housing affordability challenges.

Sales of newly built, single-family homes in December increased 3.6% to a 698,000 seasonally adjusted annual rate from an upwardly revised November number, according to newly released data from the U.S. Department of Housing and Urban Development and the U.S. Census Bureau. The pace of new home sales in December was up 6.7% compared to a year earlier.

New home sales ended 2024 2.5% higher over the 2023 total. NAHB is forecasting a slight gain for sales in 2025 given ongoing solid macroeconomic conditions, particularly for the labor market. Furthermore, builders are cautiously optimistic about the building market given a post-election policy reset that seeks to eliminate unnecessary regulations

A new home sale occurs when a sales contract is signed, or a deposit is accepted. The home can be in any stage of construction: not yet started, under construction or completed. In addition to adjusting for seasonal effects, the December reading of 698,000 units is the number of homes that would sell if this pace continued for the next 12 months.

New single-family home inventory in December continued to rise to a level of 494,000, up 10% compared to a year earlier. This represents an 8.5 months’ supply at the current building pace.

Completed ready-to-occupy inventory is up 46% to a level of 118,000, compared to a year ago.

NAHB estimates the combined new and existing total months’ supply (8.5 months’ supply for new homes while the much larger resale market was at 3.1) fell to just a 4 months’ supply in December, the lowest since April 2024. The market has not been near a 6 months’ supply, which represents a balanced market, since 2012.

The median new home sale price in December was $427,000, up 2.1% from a year ago.

Regionally, on a year-to-year basis for 2024 totals, new home sales were strongest in the Midwest, up 19% in 2024. Sales also rose 1.7% in the Northeast and 2.6% in the West but declined 0.2% in the South.

Discover more from Eye On Housing

Subscribe to get the latest posts sent to your email.


This article was originally published by a eyeonhousing.org . Read the Original article here. .


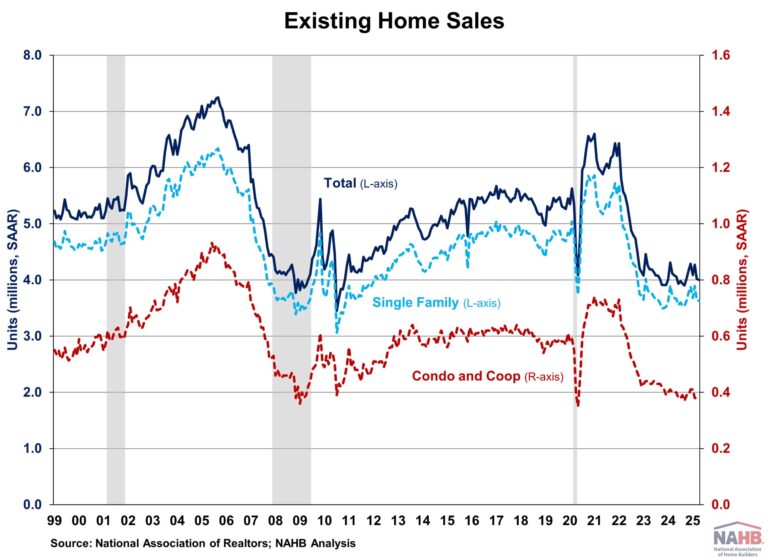
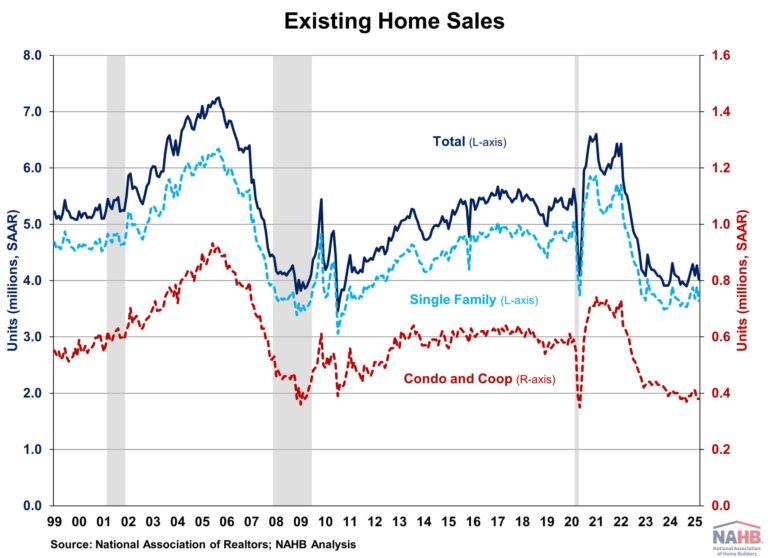
Despite higher mortgage rates and elevated home prices, existing home sales jumped to a 10-month high in December, marking three monthly gains in annual growth, according to the National Association of Realtors (NAR). However, existing home sales end 2024 at 4.06 million, the lowest level since 1995 as the median price reached a record high of $407,500 in 2024. 

While inventory improves and the Fed continues lowering rates, the market faces headwinds as mortgage rates are expected to stay above 6% for longer due to an anticipated slower easing pace in 2025. The prolonged rates may continue to discourage homeowners from trading existing mortgages for new ones with higher rates, keeping supply tight and prices elevated. As such, sales are likely to remain limited in the coming months due to elevated mortgage rates and home prices.

Total existing home sales, including single-family homes, townhomes, condominiums, and co-ops, rose 2.2% to a seasonally adjusted annual rate of 4.24 million in December, the highest level since February 2024. On a year-over-year basis, sales were 9.3% higher than a year ago, the largest annual gain since June 2021. However, total sales in 2024 fell to 4.06 million, breaking below 2023’s record low of 4.10 million and marking the lowest annual level since 1995.

The first-time buyer share rose to 31% in December, up from 30% in November and 29% in December 2023.

The existing home inventory level fell from 1.33 million in November to 1.15 million units in December but is up 16.2% from a year ago. At the current sales rate, December unsold inventory sits at a 3.3-months’ supply, down from 3.8-months last month but up from 3.1-months a year ago. This inventory level remains low compared to balanced market conditions (4.5 to 6 months’ supply) and illustrates the long-run need for more home construction.

Homes stayed on the market for an average of 35 days in December, up from 32 days in November and 29 days in December 2023.

The December all-cash sales share was 28% of transactions, up from 25% in November 2024 but down from 29% in December 2023. All-cash buyers are less affected by changes in interest rates.

The December median sales price of all existing homes was $404,400, up 6.0% from last year. This marked the 18th consecutive month of year-over-year increases. The median condominium/co-op price in December was up 4.5% from a year ago at $359,000. This rate of price growth will slow as inventory increases.

Geographically, three of the four regions saw an increase in existing home sales in December, ranging from 2.6% in the West to 3.9% in the Northeast. Sales in the Midwest fell 1%. On a year-over-year basis, sales grew in all four regions, ranging from 6.5% in the Midwest to 12.9% in the West.

The Pending Home Sales Index (PHSI) is a forward-looking indicator based on signed contracts. The PHSI rose from 77.3 to 79.0 in November due to improved inventory. This marks the highest level since February 2023. On a year-over-year basis, pending sales were 6.9% higher than a year ago per National Association of Realtors data.

Discover more from Eye On Housing

Subscribe to get the latest posts sent to your email.



This article was originally published by a eyeonhousing.org . Read the Original article here. .


Construction costs account for 64.4% of the average price of a home, according to NAHB’s most recent Cost of Construction Survey.  In 2022, the share was 3.6 points lower, at 60.8%.  The latest finding marks a record high for construction costs since the inception of the series in 1998 and the fifth instance where construction costs represented over 60% of the total sales price.

The finished lot was the second largest cost at 13.7% of the sales price, down more than four percentage points from 17.8% in 2022.  The share of finished lot to the total sales price has fallen consecutively in the last three surveys, reaching a series low in 2024.

The average builder profit margin was 11.0% in 2024, up less than a percentage point from 10.1% in 2022.  

At 5.7% in 2024, overhead and general expenses rose when compared to 2022 (5.1%).  The remainder of the average home sale price consisted of sales commission (2.8%), financing costs (1.5%), and marketing costs (0.8%).  Marketing costs were essentially unchanged while sales commission and financing costs decreased compared to their 2022 breakdowns.

Construction costs were broken down into eight major stages of construction. Interior finishes, at 24.1%, accounted for the largest share of construction costs, followed by major system rough-ins (19.2%), framing (16.6%), exterior finishes (13.4%), foundations (10.5%), site work (7.6%), final steps (6.5%), and other costs (2.1%).

Explore the interactive dashboard below to view the costs and percentage of construction costs for the eight stages and their 36 components.

Table 1 shows the same results as the dashboard above in table format.  Please click here to be redirected to the full report (which includes historical results back to 1998).

Discover more from Eye On Housing

Subscribe to get the latest posts sent to your email.



This article was originally published by a
eyeonhousing.org . Read the Original article here. .


Homes constructed by the postwar developer Joseph Eichler are coveted for many of the features that appealed to families in the 1950s and ’60s, including their modern style, indoor-outdoor flow and large expanses of glass. But other common aspects of the homes, including poor energy efficiency, closed-off kitchens and small square footage, aren’t very conducive to contemporary multigenerational living.

So after a family with a young daughter and twins on the way purchased one such home in Palo Alto, California, it set out to upgrade the home’s function and finishes and to add a grandparents suite. The homeowners hired Klopf Architecture, which is renowned for its sensitive Eichler remodels, to get the job done — and to ensure that the home’s architectural integrity and distinctive character were preserved in the process.


This article was originally published by a www.houzz.com . Read the Original article here. .


2. Curve Control

Designer: Maritza Capiro
Location: Coral Gables, Florida
Size: 189 square feet (18 square meters)

Homeowners’ request. “The homeowners wanted a functional yet stylish home office that could seamlessly blend into the overall design aesthetic of their home,” designer Maritza Capiro says. “The previous space lacked warmth, cohesion and efficient storage, which made it feel more utilitarian than inviting. They wanted a workspace that felt luxurious, inspiring and uncluttered — a place where they could focus while also enjoying the beauty of their surroundings. To address these needs, we focused on creating a layout that balanced functionality with visual interest. By adding custom built-ins, intentional lighting and an eye-catching desk, we transformed the space into a statement-making office that supports productivity and relaxation.”

Special features. “The sculptural, curved desk serves as a centerpiece, combining artistry with practicality,” Capiro says. “Its soft, neutral finish complements the room’s light, airy palette while standing out as a design focal point. The black built-in shelves provide ample storage for books and decorative objects, while the arched detail adds architectural interest. The matte black finish contrasts beautifully with the lighter elements in the room. The statement chandelier adds texture and sophistication to the space, while a picture light over the shelves enhances the display. The light wood flooring grounds the space and adds warmth, while layered textures such as the area rug, upholstered chair and patterned accent chair create a welcoming and polished look. The walls are painted in a soft, neutral tone (Extra White by Sherwin-Williams) that enhances the natural light and makes the room feel spacious.”

Cord and document control. “To keep the space visually clean and organized, we included hidden storage within the built-ins and desk,” Capiro says. “Cords are discreetly routed behind the furniture, while the desk drawers store necessary office supplies and documents. This strategy keeps everything functional but out of sight, maintaining the overall polished look.”

Designer tip. “Invest in a statement desk that doubles as both a functional piece and a design focal point,” Capiro says. “Pair it with custom built-ins to ensure all storage needs are met without cluttering the room. Additionally, layering textures through rugs, upholstery and accents can make any space feel more inviting and cohesive.”

Shop for home office furniture


This article was originally published by a www.houzz.com . Read the Original article here. .


9. Consider the Impact of Light on Color

“Lighting can completely transform a color,” Au says. “It all depends on the quality of light. South-facing rooms get lots of natural light, so the yellow and red undertones in a color will be emphasized.

“This is why we always recommend getting samples so you can see the color in the room throughout the day as well as in artificial light,” she says. “Paint on large bits of card rather than straight onto your walls. You can then move them around the room at different times of the day to see how they react to the light.”

“Whether it’s artificial lighting or daylight in a room, you must know what you’re working with in order to pick the right color,” Fournet says. “North- and east-facing rooms get a bad press as they receive less sun, but I say they should be embraced rather than feared. North-facing rooms can still look warm and cozy if you choose red-based neutrals or darker colors.

“For east-facing rooms, sharper, cooler shades, such as aquamarines, greens and blues — not the muddier tones — work well,” she says. “South- and west-facing rooms are where you can have a bit more freedom, but be careful with neutrals in a south-facing room. They can often be too light and end up looking bleached out, so don’t be scared to add a bit of an undertone.”

How to Decorate a Living Room


This article was originally published by a www.houzz.com . Read the Original article here. .

Pin It