Tag

home

Browsing


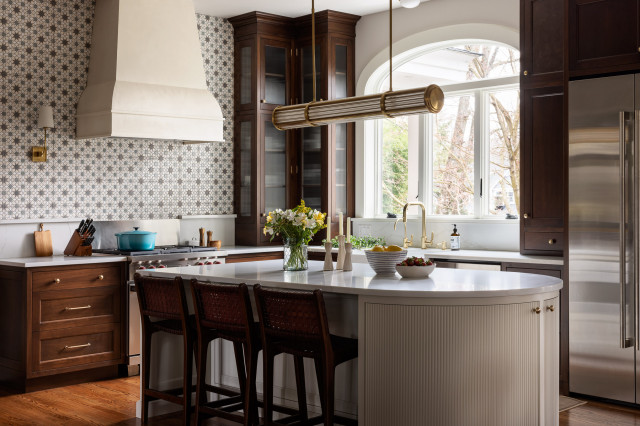
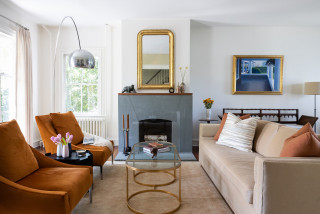
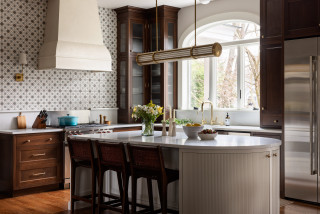
This 1907 home on a spacious lot in New Jersey had many beautiful details, including walnut millwork and original molding. But those details had aged past the point of rescue. So the homeowners reached out to designer Anastasia Harrison of AHD&Co to help update the home while honoring its roots. Harrison, who uses Houzz Pro business software, started by taking a piece of original stained walnut to a millworker and creating a match for new rich walnut cabinets in the kitchen. A new curved island has reeded detailing that complements reeded lighting and glass cabinet doors.

Elsewhere, fresh elements like a salmon pink paint for that original molding in the dining room, brick-look porcelain tile in a herringbone pattern for the mudroom and a light-filled en suite bathroom in a former sunroom ensure this home will remain timeless for years to come.

Read more and save photos


This article was originally published by a www.houzz.com . Read the Original article here. .


The latest NAHB study on home buyer preferences – What Home Buyers Really Want Study – asked consumers about the features and amenities they would want in a home, specifically regarding windows and exterior doors.  Respondents were asked to rate eight window and four exterior door features using the following four-point scale:

Do not want – not likely to buy a home with this design or feature.

Indifferent – wouldn’t influence decision.

Desirable – would be seriously influenced to purchase a home because this design or feature was included.

Essential/Must have – unlikely to purchase a home without this design or feature.

Windows

ENERGY STAR rated windows were rated essential or desirable by 83% of home buyers, followed by triple-pane insulating glass (77%) and low e-insulating glass (67%).  Since its introduction to the survey in 2007, ENERGY STAR rated windows have been wanted by at least 83% of home buyers (Figure 1).  Additionally, ENERGY STAR windows were ranked the third most wanted feature out of the 200+ options asked within the survey.

Doors

All four exterior door features were rated essential or desirable by a majority of home buyers (>50%) with very little separating the highest (sliding patio doors at 64%) to the lowest (double main entry door at 58%) rated options.  Furthermore, all four exterior door features have increased in popularity compared to 2020, with double main entry door rising the most (10 percentage points) (Figure 2). 

Additionally, like the other areas of the home covered in the study, every question on windows and doors is tabulated by the buyer’s income, age, geography, race, household type, and the price they expect to pay for the home.  These details can be very useful in particular cases.  For example, the study discusses the three window features that appeal to older buyers, as well as how preferences for hinged/French patio doors change by income level and home price. 

Discover more from Eye On Housing

Subscribe to get the latest posts sent to your email.


This article was originally published by a eyeonhousing.org . Read the Original article here. .


This 1907 home on a spacious lot in New Jersey had many beautiful details, including walnut millwork and original molding. But those details had aged past the point of rescue. So the homeowners reached out to designer Anastasia Harrison of AHD&Co to help update the home while honoring its roots. Harrison, who uses Houzz Pro business software, started by taking a piece of original stained walnut to a millworker and creating a match for new rich walnut cabinets in the kitchen. A new curved island has reeded detailing that complements reeded lighting and glass cabinet doors.

Elsewhere, fresh elements like a salmon pink paint for that original molding in the dining room, brick-look porcelain tile in a herringbone pattern for the mudroom and a light-filled en suite bathroom in a former sunroom ensure this home will remain timeless for years to come.

Read more and save photos


This article was originally published by a www.houzz.com . Read the Original article here. .


Expectations of the Federal Reserve beginning the first in a series of rate reductions kept potential home buyers in a holding pattern in August.

Sales of newly built, single-family homes in August fell 4.7% after an unusually strong July, according to newly released data from the U.S. Department of Housing and Urban Development and the U.S. Census Bureau.  August new home sales registered a 716,000 seasonally adjusted annual rate, after an upwardly revised estimate of 751,000 for July.

Despite the slip in August, the three-month moving average for new home sales is at its highest level since March of 2022. New home sales are up 4% on a year-to-date basis through August.

Builder sentiment and future sales expectations are improving as the Federal Reserve begins a credit easing cycle. However, due to the mortgage interest lock-in effect, declining interest rates will mean rising existing home inventories and some additional new competition for home builders.

While a 7.8 months’ supply may be considered elevated in normal market conditions, there is currently only a 4.1 months’ supply of existing single-family homes on the market. Combined, new and existing total months’ supply remains below historic norms at approximately 4.7, although this measure is expected to increase as more home sellers test the market in the months ahead.

A new home sale occurs when a sales contract is signed, or a deposit is accepted. The home can be in any stage of construction: not yet started, under construction or completed. In addition to adjusting for seasonal effects, the August reading of 716,000 units is the number of homes that would sell if this pace continued for the next 12 months.

New single-family home inventory increased 1.7% to 467,000 in August, a 7.8 months’ supply at the current sales pace.  Completed, ready to occupy inventory increased to 105,000 homes, which is the highest level since 2009. However, this share makes up only 22% of new home inventory.

Median new home price fell back to $420,600, down 4.6% from a year ago due to builder price incentives amid multidecade highs for housing affordability challenges. The Census data reveals a gain for new home sales priced below $300,000, which made up 18% of new home sales in August compared to 12% a year ago.

Regionally, on a year-to-date basis, new home sales are up in all four regions, rising 2.1% in the Northeast, 21.9% in the Midwest, 0.8% in the South and 4.7% in the West.

Discover more from Eye On Housing

Subscribe to get the latest posts sent to your email.


This article was originally published by a eyeonhousing.org . Read the Original article here. .


This article was originally published by a
www.houzz.com . Read the Original article here. .


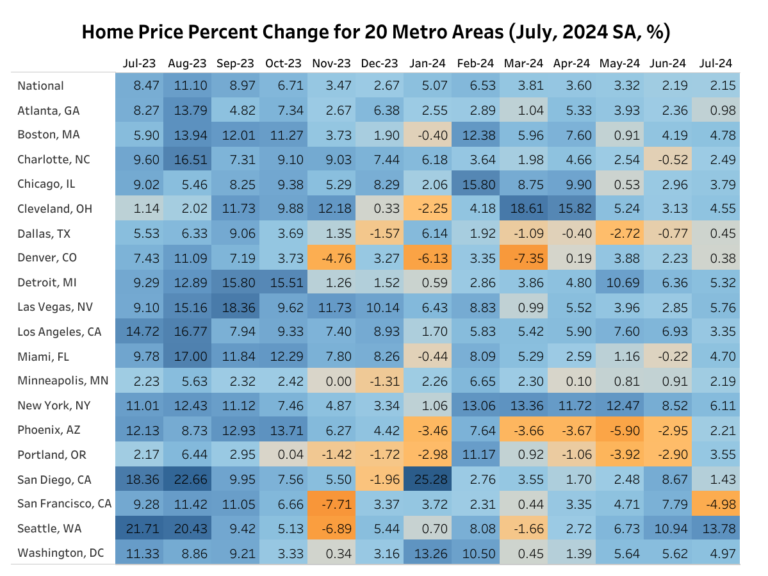
Home prices remain elevated but price growth continues to decelerate, according to the S&P CoreLogic Case-Shiller Home Price Index (HPI) recent release. The S&P CoreLogic Case-Shiller HPI (seasonally adjusted) reached its 14th monthly consecutive record high in July 2024. The index increased at a seasonally adjusted annual rate of 2.15%, down slightly from a revised June rate of 2.19%. This rate has slowed over the past six months, from a high of 6.53% in February 2024. The index has not seen an outright decrease since January of 2023 (nineteen months).

Separately, the House Price Index released by the Federal Housing Finance Agency (FHFA; SA) posted its sixth monthly consecutive record high, after having decreased slightly in January of this year. The FHFA HPI recorded a 1.57% increase in July, upward from a revised 0.03% rate in June.  

Year-Over-Year  

Home prices experienced a fifth consecutive year-over-year declaration in July, tabulated by both indexes. The S&P CoreLogic Case-Shiller HPI (not seasonally adjusted – NSA) posted a 4.96% annual gain in July, down from a revised 5.50% increase in June. Meanwhile, the FHFA HPI (NSA) index rose 4.56%, down from a revised 5.37% in June. Both indexes have seen yearly growth rates slow since February 2024, when the S&P CoreLogic Case-Shiller stood at 6.54% and the FHFA at 7.23%. 

By Metro Area

In addition to tracking national home price changes, the S&P CoreLogic Index (SA) also reports home price indexes across 20 metro areas. At an annual rate, only one out of 20 metro areas reported a home price decline: San Francisco at -3.10%. Among the 20 metro areas, 15 exceeded the national rate of 2.15%. Seattle had the highest rate at 13.78%, followed by New York at 6.11%, and Las Vegas at 5.76%. The monthly trends are shown in the graph below.  

Monthly, the FHFA HPI (SA) releases not only national but also census division house price indexes. Out of the nine census divisions, three posted negative monthly depreciation (adjusted to an annual rate) for July: South Atlantic at -7.88%, West South Central at -6.80%, and East South Central at -0.66%. The divisions with positive home price appreciation ranged from 2.02% in West North Central to 11.57% in East South Central. The FHFA HPI releases its metro and state data on a quarterly basis, which NAHB analyzed in a previous post. 

Discover more from Eye On Housing

Subscribe to get the latest posts sent to your email.


This article was originally published by a eyeonhousing.org . Read the Original article here. .


Cummings Architecture + InteriorsSave Photo
What Happens When a Professional Organizer Visits?

Your decluttering session will be tailored to your needs. Young, for example, starts by helping you decide which area to address first.

“I have a number of massive buckets that are used for sorting out the contents of a space into different categories: recycling, charity, rubbish, keeping in another room in the house… We’ll sort through every single item, making a decision about each as we go,” she says.

Abbotson works in a similar way, arriving armed with colored bags, folders and stackable boxes to categorize what’s staying, going or being auctioned. Then she tackles one room at a time. “I facilitate my clients’ decisions, which involves lots of open questioning and pushing them out of their comfort zone, but without piling on pressure. Ideally, I’d work a five-hour day with a client, although some only have the energy for three hours. I’m fully adaptable to people’s needs,” she says.

By tackling emotionally charged clutter first, Reynolds capitalizes on high energy levels. “I also decide what the client looks at, because I can gauge what will make the biggest impact on the space with the least stress,” she says. “This means the ‘where to start’ and ‘what to do next’ decisions are removed from the client. I have the plan, so they don’t have to worry about it.”

Find a professional organizer near you


This article was originally published by a
www.houzz.com . Read the Original article here. .


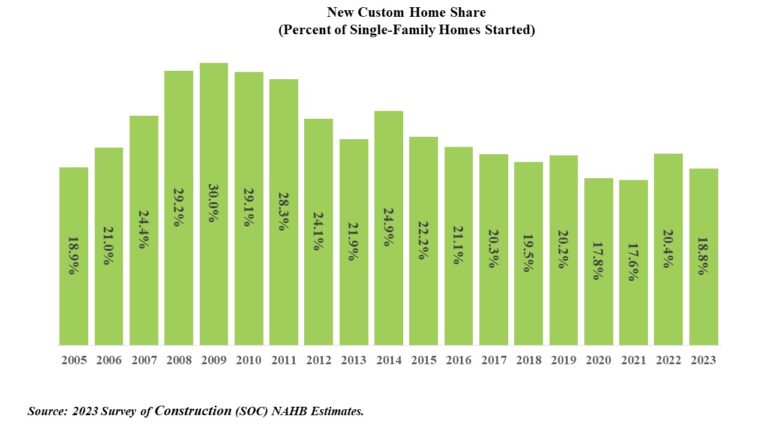
In 2023, 18.8 percent of all new single-family homes started were custom homes. This share decreased from the 20.4 percent recorded in 2022, according to data tabulated from the Census Bureau’s Survey of Construction (SOC). The custom home market consists of contractor-built and owner-built homes—homes built one at a time for owner occupancy on the owner’s land, with either the owner or a builder acting as a general contractor. The alternatives are homes built-for-sale (on the builder’s land, often in subdivisions, with the intention of selling the house and land in one transaction) and homes built-for-rent.   

In 2023, 71.5 percent of the single-family homes started were built-for-sale, and 9.7 percent were built-for-rent. At an 18.9 percent share, the number of custom homes started in 2023 was 177,850, falling from 207,472 in 2022. 

The quarterly published statistics show that the custom home share of single-family starts showed gains in the second quarter of 2024 after some recent slowing. Although the quarterly statistics are timelier, they lack the geographic detail available in the annual data set.

When analyzed across the 9 census divisions, the annual data show that the highest custom home share in 2023 was 35.5 percent in the East South-Central division. While the lowest share was in the West South-Central division, where the share was only 11.9 percent. The share of custom homes across U.S. divisions are showed in the map below.

Discover more from Eye On Housing

Subscribe to get the latest posts sent to your email.


This article was originally published by a eyeonhousing.org . Read the Original article here. .


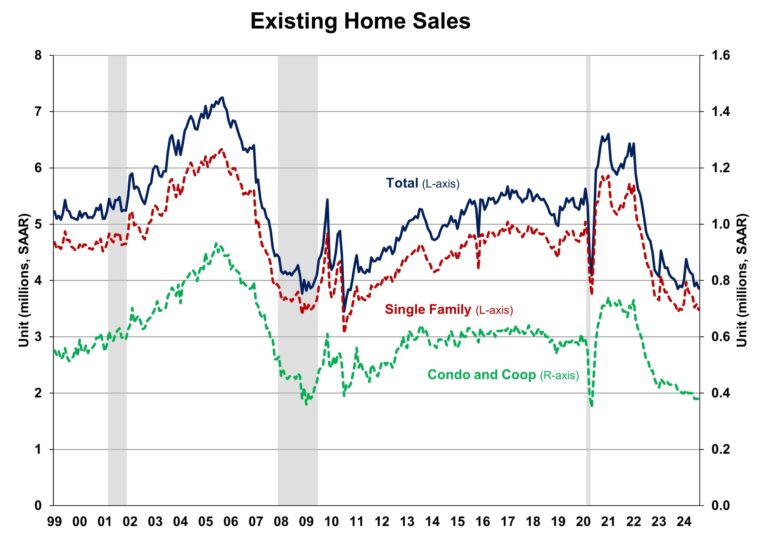
Existing home sales fell to a 10-month low in August despite easing mortgage rates and improved inventory, according to the National Association of Realtors (NAR). Home sales remained sluggish as the lock-in effect kept home prices elevated. Meanwhile, the share of first-time buyer in August dropped to a record low. However, we expect increased activity in the coming months as mortgage rates continue to moderate. Improving inventory is likely to ease home price growth and enhance affordability.

Homeowners with lower mortgage rates have opted to stay put, avoiding trading existing mortgages for new ones with higher rates. This trend is driving home prices higher and holding back inventory. With the Federal Reserve beginning its easing cycle at the September meeting, mortgage rates are expected to gradually decrease, leading to increased demand and unlocking lock-in inventory in the coming quarters.

Total existing home sales, including single-family homes, townhomes, condominiums, and co-ops, fell 2.5% to a seasonally adjusted annual rate of 3.86 million in August, the lowest level since October 2023. On a year-over-year basis, sales were 4.2% lower than a year ago.

The first-time buyer share dropped to 26% in August, the lowest level since November 2021, down from 29% in both July and August 2023.

The existing home inventory level rose from 1.34 million in July to 1.35 million units in August and is up 22.7% from a year ago. At the current sales rate, August unsold inventory sits at a 4.2-months supply, up from 4.1-months last month and 3.3-months a year ago. This inventory level remains low compared to balanced market conditions (4.5 to 6 months’ supply) and illustrates the long-run need for more home construction. However, the count of single-family resale homes available for sale is up almost 21.4% on a year-over-year basis.

Homes stayed on the market for an average of 26 days in August, up from 24 days in July and 20 days in August 2023.

The August all-cash sales share was 26% of transactions, down from 27% in both July and a year ago. All-cash buyers are less affected by changes in interest rates.

The August median sales price of all existing homes was $416,700, up 3.1% from last year. This marked the 14th consecutive month of year-over-year increases. The median condominium/co-op price in August was up 3.5% from a year ago at $366,500. This rate of price growth will slow as inventory increases. Existing home sales in August were mixed across the four major regions. In the Northeast, South, and West, sales fell by 2.0%, 3.9%, and 2.7%, respectively, while sales in the Midwest remained unchanged. On a year-over-year basis, sales decreased in the Midwest (-5.2%), South (-6.0%) and West (-1.4%). Sales in the Northeast were unchanged from a year ago.

The Pending Home Sales Index (PHSI) is a forward-looking indicator based on signed contracts. The PHSI fell from 74.3 to 70.2 in July due to persistent affordability challenges. On a year-over-year basis, pending sales were 8.5% lower than a year ago per National Association of Realtors data.

Discover more from Eye On Housing

Subscribe to get the latest posts sent to your email.


This article was originally published by a eyeonhousing.org . Read the Original article here. .


Storey Interiors LtdSave Photo
Multigenerational Design

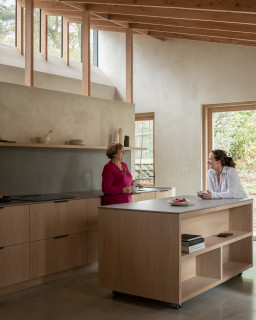
Storey designed this house just outside Bristol, England, to accommodate three generations.

Multigenerational design is key to inclusive design, since it covers a number of demographics at once: new mothers, young children, young adults still living at home, older people and those with mobility difficulties or low sight or hearing. Create a home that works for them all and you’re well on the way to a fully future-proofed space.

“What I always try to consider is how a space will flex and adapt, not just to everyday life, but in years to come,” Storey says. “So think, are you going to have children? Do you have a parent coming to live with you? How would the space accommodate them?” This project features generous circulation space, step-free surfaces, bedrooms downstairs and a self-contained suite upstairs.

With mobility equipment in mind, Storey advises having electrical outlets in more places than you think you’ll need them so different layouts and needs can easily be accommodated. “You could put one near the entrance or outside, so a mobility scooter could be charged,” she suggests. “More sockets also mean you can provide more lighting, adjusting levels for older eyes.”

Similarly, have easy-to-press switches in a contrasting color to your walls so they’re easy to see. And position them at a good height for all ages — about 3⅓ to 4 feet is perfect, Storey says.

For older inhabitants and the very young, factor in thresholds between rooms. “Make those transitions as seamless as possible. If you do have steps, highlight them — perhaps with different colors for the edge or risers and the treads,” Storey says. “Contrast is really helpful for all ages.”

Design-Build Pro Shares Key Features for Accessible Spaces


This article was originally published by a
www.houzz.com . Read the Original article here. .

Pin It