Tag

Hold

Browsing


Challenging affordability conditions, elevated interest rates and economic uncertainty continue to act as headwinds on the housing sector as many potential buyers continue to stay on the sidelines.

Sales of newly built single-family homes edged 0.6% higher in June, rising to a seasonally adjusted annual rate of 627,000, according to newly released data from the U.S. Department of Housing and Urban Development and the U.S. Census Bureau. This marks a 0.6% increase from May’s unrevised figures. However, this is 6.6% below the June 2024 level. June new home sales are down 4.3% on a year-to-date basis. The past two months have been the slowest sales pace since October of last year, as mortgage rates averaged above 6.8% in June.

A new home sale occurs when a sales contract is signed, or a deposit is accepted. The home can be at any stage of construction: not yet started, under construction or completed. In addition to adjusting for seasonal effects, the June reading of 627,000 units is the number of homes that would sell if this pace continued for the next 12 months.

New single-family home inventory continued to rise with 511,000 residences marketed for sale as of June. This is 1.2% higher than the previous month, and 8.5% higher than a year ago. At the current sales pace, the months’ supply for new homes remained elevated at 9.8 compared to 8.4 a year ago. A measure near a six months’ supply is considered balanced.

As expected, the combined new and existing total months’ supply has risen over the last few months to a balanced 5.4 months due to continued buyer hesitation in both new and existing home sales markets. Elevated mortgage rates and sustained price levels continue to limit purchasing power, particularly among first-time and middle-income buyers.

A year ago, there were 94,000 completed, ready-to-occupy homes available for sale (not seasonally adjusted). By the end of June 2025, that number increased 21.3% to 114,000. However, completed, ready-to-occupy inventory remains just 22% of total inventory, while homes under construction account for 54%. The remaining 24% of new homes sold in June were homes that had not started construction when the sales contract was signed.

The median new home sale price edged down 4.9% in June to $401,800. This is down 2.9% compared to a year ago. In terms of affordability, the share of entry-level homes priced below $300,000 has been steadily falling in recent years. Only 14% of the homes were priced in this entry-level affordable range, while 28% of the homes were priced above $500,000. Most of the homes were priced between $300,000-$500,000.

Regionally, on a year-to-date basis, new home sales are down in all four regions, falling 1.6% in the South, 4.0% in the West, 8.5% in the Midwest, and 25.6% in the Northeast.

Discover more from Eye On Housing

Subscribe to get the latest posts sent to your email.


This article was originally published by a eyeonhousing.org . Read the Original article here. .


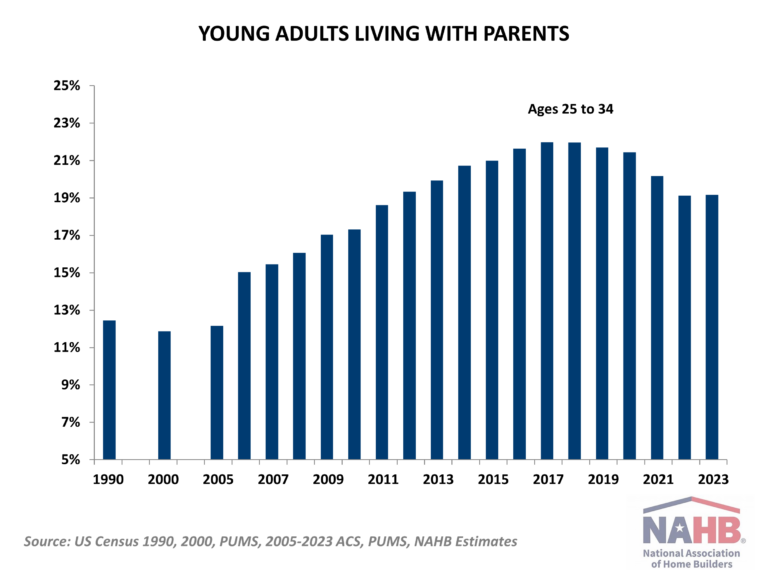
Inflation rose to a 4-month high in June as consumer prices began to reflect tariff policy. The Consumer Price Index increased from 2.4% in May to 2.7% in June year-over-year, according to the Bureau of Labor Statistics’ report. Despite the increase, core inflation came in softer than expected, suggesting full tariff impacts will likely push inflation even higher in the coming months. Meanwhile, housing inflation continued to show signs of cooling and matched the lowest level since November 2021.

During the past twelve months, on a non-seasonally adjusted basis, the Consumer Price Index rose by 2.7% in June, the highest since February 2025. Excluding the volatile food and energy components, the “core” CPI increased by 2.9% over the past twelve months. A large portion of the “core” CPI is the housing shelter index, which increased 3.8% over the year, the lowest reading since November 2021.  Meanwhile, the component index of food rose by 3.0%, and the energy component index fell by 0.8%.

On a monthly basis, the CPI rose by 0.3% in June (seasonally adjusted), after a 0.1% increase in May. The “core” CPI increased by 0.2% in June.

The price index for a broad set of energy sources rose by 0.9% in June, with increases across all components including fuel oil (+1.3%), gasoline (+1.0%), electricity (+1.0%) and natural gas (+0.5%). Meanwhile, the food index rose by 0.3%, the same increase in May. The index for food away from home increased by 0.4% and the index for food at home rose by 0.3%.

The index for shelter (+0.2%) was the largest contributor to the monthly increase in all items index. Other top contributors that rose in June include indexes for household furnishings and operations (+0.1%), medical care (+0.5%), recreation (+0.4%), apparel (+0.4%) as well as personal care (+0.3%). Meanwhile, the index for used cars and trucks (-0.7%), new vehicles (-0.3%), and airline fares (-0.1%) were among the few major indexes that decreased over the month.

The index for shelter makes up more than 40% of the “core” CPI, rising by 0.2% in June, following an increase of 0.3% in May. The index for owners’ equivalent rent (OER) rose by 0.3% and index for rent of primary residence (RPR) increased by 0.2% over the month. Despite the moderation, shelter costs remained the largest contributors to headline inflation. 

While the Fed rate cuts could ease some housing market pressure, its ability to address rising housing costs is limited, as these increases are driven by a lack of affordable supply and increasing development costs. Tight monetary policy actually hurts housing supply by increasing AD&C financing costs. This can be seen on the graph below, as shelter costs continued rising despite Fed policy tightening in 2022. Additional housing supply is the primary solution to tame housing inflation and overall inflation. This emphasizes why the cost of construction, including the cost of building materials, matters not just for housing but also the inflation outlook and the path of future monetary policy.

NAHB constructs a “real” rent index to indicate whether inflation in rents is faster or slower than core inflation. It provides insight into the supply and demand conditions for rental housing. When inflation in rents is rising faster than core inflation, the real rent index rises and vice versa. The real rent index is calculated by dividing the price index for rent by the core CPI (to exclude the volatile food and energy components). In June, the Real Rent Index remained unchanged. Over the first six months of 2025, the average monthly growth rate held steady at 0.1%, unchanged from the same period in 2024.

Discover more from Eye On Housing

Subscribe to get the latest posts sent to your email.


This article was originally published by a eyeonhousing.org . Read the Original article here. .
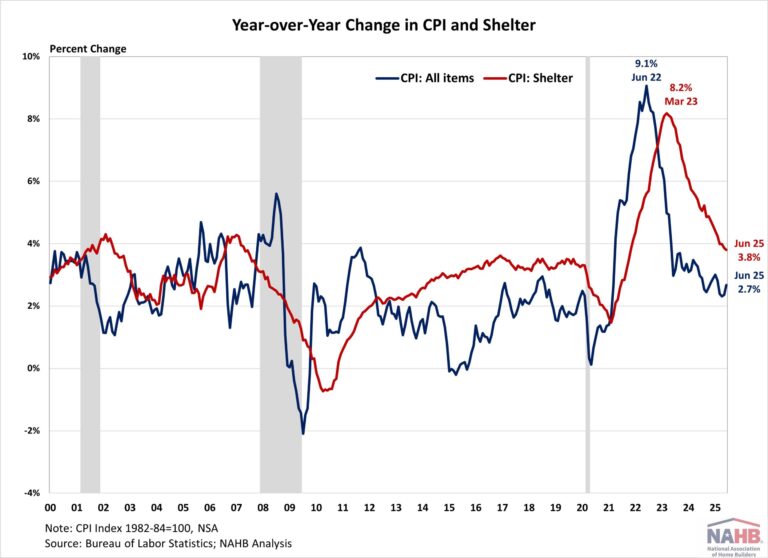

Average mortgage rates were flat in June, according to Freddie Mac. The average 30-year fixed-rate mortgage held at 6.82%, while the 15-year stayed at 5.95%. Compared to a year ago, the 30-year rate is down 10 basis points (bps), and the 15-year rate is 24 bps lower.

The 10-year Treasury yield, a benchmark for long-term borrowing, averaged 4.43% in June – a marginal increase of 5 bps from the previous month. However, the most recent weekly yield saw a small decrease following Federal Reserve Chair Jerome Powell’s congressional testimony, where he noted the possibility of a rate cut being “sooner rather than later” if inflation remains contained. Nonetheless, he reiterated the Fed’s “wait and see” stance, citing ongoing uncertainty around how changes in trade, immigration, fiscal, and regulatory policies will affect the economy.

Last week, the Federal Open Market Committee (FOMC) continued its pause on rate cuts, keeping the federal funds rate unchanged at 4.25% to 4.5%. The updated dot plot continues to signal a cumulative rate cut of 50 bps by the end of 2025. However, the latest Summary of Economic Projections revised the median 2025 GDP forecast down from 1.7% to 1.4%. Forecasts for unemployment (4.4% to 4.5%), PCE inflation (2.7% to 3.0%), and core PCE inflation (2.8% to 3.1%) were all revised upward.

Discover more from Eye On Housing

Subscribe to get the latest posts sent to your email.


This article was originally published by a eyeonhousing.org . Read the Original article here. .
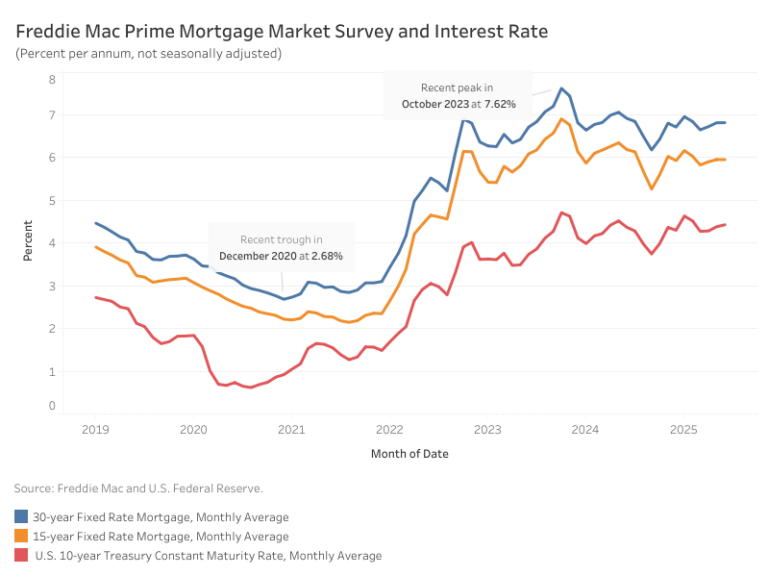

Mortgage rates dropped significantly at the start of March before stabilizing, with the average 30-year fixed-rate mortgage settling at 6.65%, according to Freddie Mac. This marks a 19-basis-point (bps) decline from February. Meanwhile, the 15-year fixed-rate mortgage fell by 20 bps to 5.83%.

The drop in long-term borrowing costs was driven by a 24-bps decline in the 10-year Treasury yield, which averaged 4.28% in March. This decline provided a boost to the housing market—new home sales increased 5.1% year-over-year in February, while the participation of first-time homebuyer of existing homes rose 26% over the same period. However, existing home sales saw a slight dip from last February.

The decrease in Treasury yields reflects growing concerns about an economic slowdown, particularly as shifts in tariff policy weaken consumer confidence. Despite this, the labor market remained resilient in February, posting steady job gains even as the unemployment rate ticked up slightly. The strength of upcoming jobs reports will be critical in assessing whether recession risks are intensifying.

At the latest FOMC meeting, the Federal Reserve held interest rates steady but revised its 2025 economic projections: expected GDP growth was lowered to 1.7% (down from 2.1% in December 2024) and the projected unemployment rate was raised to 4.4%, up 0.1 percentage point from previous estimates.

Discover more from Eye On Housing

Subscribe to get the latest posts sent to your email.


This article was originally published by a eyeonhousing.org . Read the Original article here. .
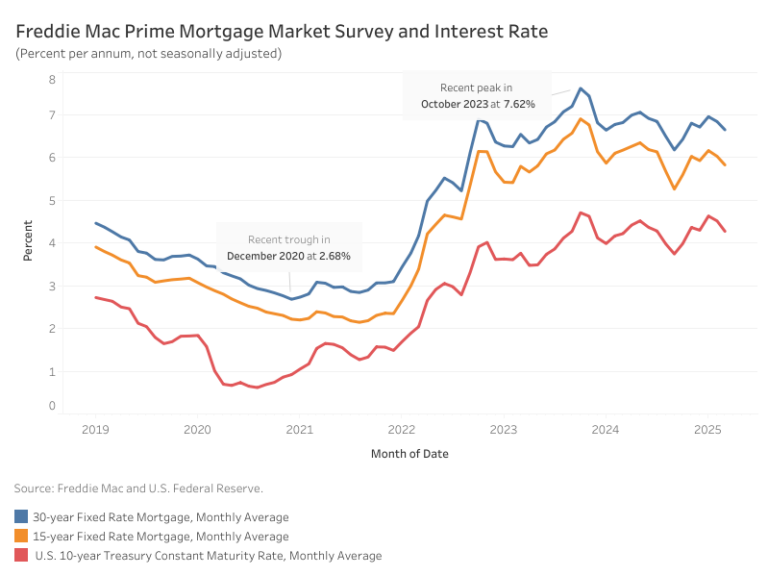

The worst on record rental affordability conditions, depleted “excess” savings of the pandemic era, and high mortgage rates halted the post-pandemic trend of young adults moving out of parental homes. The share of adults ages 25-34 living with parents or parents-in-law hovered just above 19% in 2023, stagnant from 2022, according to NAHB’s analysis of the 2023 American Community Survey (ACS) Public Use Microdata Sample (PUMS). While this percentage is the second lowest since 2011, the share remains elevated by historical standards. Regionally, Southern and Northeastern states register some of the highest shares of young adults remaining in parental homes.

Traditionally, young adults ages 25 to 34 make up around half of all first-time homebuyers. Consequently, the number and share of young adults in this age group that choose to stay with their parents, or parents-in-law, has profound implications for household formation, housing demand, and the housing market.

The current share of 19.2% translates into 8.5 million young adults living in homes of their parents or parents-in-law. In contrast, less than 12% of young adults ages 25 to 34, or 4.6 million, lived with parents in 2000. The share peaked in 2017-2018 at 22% when the ACS recorded over 9.7 million adults ages 25 to 34 living with parents.

While the national average share hovers around 19.2%, more than a quarter of young adults ages 25-34 remain in parental homes in California (26.5%), New Jersey (26.3%), and Hawaii (25.2%). Delaware (23.2%), Maryland (22.7%), Florida (22.4%) and New York (21.8%) are next on the list. At the opposite end of the spectrum are states with less than one in ten young adults living with parents. The fast-growing North Dakota records the nation’s lowest share of 5%, while the neighboring South Dakota registers 7%. In the District of Columbia, known for its relatively stable job market, less than 7.5% of young adults live with their parents. The cluster of central US states completes the nation’s list with the lowest percentages of young adults remaining in parental homes – Nebraska (8.4%), Iowa (8.5), and Wyoming (9.6%).

The elevated shares of young adults living with parents in high-cost coastal areas point to prohibitively expensive housing costs as one of the reasons for keeping young adults in parental homes. The statistical analysis confirms that states with higher shares of cost-burdened owners and renters living in unaffordable homes (i.e., paying 30 percent or more of income on housing) register higher shares of young adults living with parents. In particular, renters’ housing cost burdens explain half of the cross-state variation in the shares of young adults living in parental homes.

Multigeneration living, which is more prevalent among ethnic households, can also contribute to the elevated shares of young adults living with parents. This can be particularly relevant in the Southern states with higher shares of Hispanic households. However, the statistical analysis shows that while the correlation is positive, prevalence of Hispanic households does not carry any additional explanatory power once housing cost burdens are accounted for.

Discover more from Eye On Housing

Subscribe to get the latest posts sent to your email.


This article was originally published by a
eyeonhousing.org . Read the Original article here. .
Pin It