Tag

Hikes

Browsing


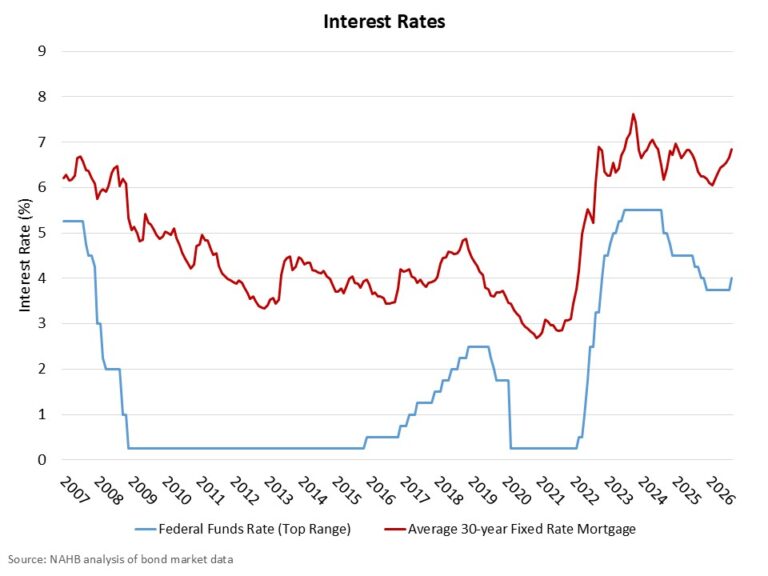
The Federal Reserve raised the federal funds rate by 25 basis points at the conclusion of its September policy meeting, bringing the target range to 3.75% to 4%. The decision comes amid renewed inflation concerns and an increase in long-term interest rates. Notably, the decision was unanimous 12-0 vote, reflecting a unified view to tackle renewed inflationary pressures.

With respect to economic conditions, the Federal Open Market Committee (FOMC) stated that “economic activity is expanding at a solid pace.” In fact, the Fed slightly upgraded its growth projections, and Chairman Warsh noted that the demand for capital has increased, leading to higher market interest rates. Additionally, the FOMC noted that “uncertainty remains elevated” due to “geopolitical developments,” which is a nod to current trade issues and the Iran war.

On inflation, the FOMC stated simply that “inflation remains elevated.” The Fed noted that today’s hike, which is in response to inflation rising to a 3.4% year-over-year rate, “will support a timelier return to the Committee’s two percent goal.”  Echoing recent statements from Chairman Warsh, President Trump’s pick to lead the Fed, today’s statement repeated that “the Committee will deliver price stability.” 

Today’s hike reflects a difficult policy environment. Long-term interest rates have increased in recent weeks as corporate firms issue more debt to finance technology investment and growth, while concerns persist over long-term federal budget constraints, and, most particularly in the short run, oil prices rise due to the Iran war. Together, these forces have increased financing costs for households and businesses, including home buyers and home builders.

The prior case for holding rates steady, or at least moving slowly, rested on the source of recent inflation. To the extent that higher prices reflected one-off adjustments, the Fed could potentially “look through” these increases rather than respond to each change with tighter policy. An increase in the price level does not necessarily imply a persistently higher inflation rate.

This distinction is particularly relevant for housing. While the central bank’s federal funds rate does not have a direct effect on mortgage rates, an increase in the funds rate does increase the cost of financing for builder acquisition, development and construction (AD&C) loans. Higher borrowing costs make it more difficult to finance new construction and reduce the purchasing power of prospective buyers via higher construction costs. Slower home building limits progress in addressing the housing affordability crisis, an underlying source of pressure on shelter costs and the problem of overall inflation.

Today’s Fed hike did not measurably change long-term interest rates, including the critical 10-year Treasury rate, as much of the increase was already priced into markets. The last few weeks of bond market changes suggest investors are demanding higher yields in response to inflation risks and other pressures. If higher energy prices begin to affect broader price-setting behavior and inflation expectations, waiting for conclusive evidence could leave the central bank with more work to do later. Additional constraints on oil products are a key concern whereby interest rates could move even higher.

Looking forward, the September SEP (Summary of Economic Projections) indicates a slightly stronger growth outlook relative to June. The median projection for real economic growth in 2026 is 2.3%, measured on a fourth-quarter-over-fourth-quarter basis, compared with 2.2% in June. (NAHB is forecasting 2.1% for 2026.) Growth is expected to register 2.4% in 2027 and 2.2% in 2028, with the newly added 2029 projection at 2.1%. The unemployment rate is projected to average 4.1% in the fourth quarter of 2026 and 4.1% in late 2027, suggesting tempered labor market conditions in the current “low hire, low fire” environment.

The median forecast for headline personal consumption expenditures (PCE) inflation in 2026 is 3.7%, while core PCE inflation, which excludes food and energy, is projected at 3.4%, compared with 3.3% in June. Core inflation is expected to decline to 2.5% in 2027 and 2.2% in 2028. The projections indicate a return to the Fed’s two-percent inflation objective in 2029. The process of getting to the Fed’s policy target will thus take more time given the number of supply-shocks affecting the U.S. economy. (It is worth noting that Chairman Warsh did not participate in the September SEP.)

With respect to monetary policy, the updated dot plot indicates a median federal funds rate of 4.1% at the end of 2026, implying one more rate hike in 2026 following today’s increase. The median projections for year-end 2027 and 2028 are 4.1% and 3.9%, respectively, with a 2029 projection of 3.6%. The longer-run rate estimate was revised higher to 3.2 compared to 3.1% in the June SEP.

Today’s outlook suggests an additional rate hike in December, with either flat conditions in 2027 or a combination of an additional hike and then an offsetting cut that year. These projections are conditional outlooks, rather than commitments.

There was also an important omission from today’s communications: the Fed did not discuss changes to balance sheet policy. This is relatively good news for the mortgage sector and home builders. Accelerated reductions in the Fed’s securities holdings, particularly mortgage-backed securities, would place additional upward pressure on mortgage rates.

For housing, the path of long-term rates, and the energy, fiscal and investment pressures influencing those rates, will remain critical in the months ahead.


This article was originally published by a eyeonhousing.org . Read the Original article here. .
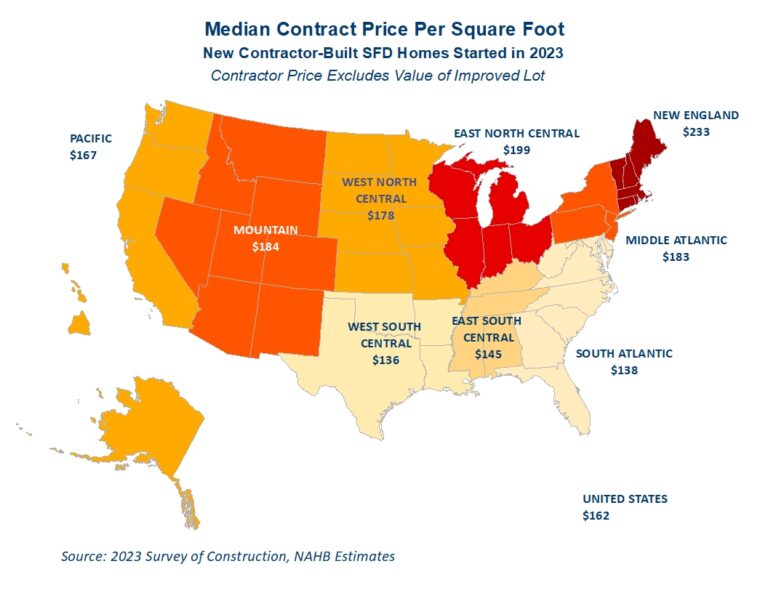

Median square foot prices (excluding record-high improved lot values) for new single-family detached (SFD) homes started in 2023 remained largely stable, according to NAHB’s analysis of the latest Survey of Construction data. For custom, or contractor-built, homes, the median price was $162 per square foot of floor space, not significantly different from $156 in 2022. For spec starts, after excluding lot values, the median was $150 per square foot of floor area. There remains a significant regional variation in square foot prices. In the spec market, after excluding lot values, median prices ranged from $262 per square foot in New England to $133 in the East South Central division.

Contract prices of custom homes do not include the value of an improved lot as these homes are built on the owner’s land (with either the owner or a contractor acting as a general contractor). Consequently, contract prices are typically reported as lower than the sale prices of spec homes. To make the comparison more meaningful, the cost of lot development is excluded from sale prices in this analysis.

The recent modest square foot price changes marked a sharp decline from the double-digit price hikes that characterized home building in the post-pandemic environment. Just a year prior, in 2022, increases for square foot prices in new SFD homes were approaching 20%, more than doubling the historically high U.S. inflation rate of 8%. The deceleration for median square foot prices reflects relatively stable building material prices and slower growth in home building wages in 2023. The shifts towards cost-effective methods, such as building homes on slabs rather than with full or partial basements, also contributed to decelerating median square foot prices.

In the for-sale market, the New England division registered the highest and fastest rising median square foot prices. Half of new for-sale SFD homes started here in 2023 were sold at prices exceeding $262 per square foot of floor area, paid on top of the most expensive lot values in the nation. After showing slower appreciation in 2022-2023, the Pacific division came in second, with median prices of $216 per square foot.

The most economical SFD spec homes were started in the South region, where the median sale prices per square foot were below the national median of $150. The East South Central division is home to the least expensive for-sale homes. Half of all for-sale SFD homes started here in 2023 registered square foot prices of $133 or lower, paid on top of the most economical lot values in the country. The other two divisions in the South – West South Central and South Atlantic –registered median prices of $144 per square foot, the second lowest in the nation.

Because square foot prices in this analysis exclude the cost of developed lot, highly variant land values cannot explain the regional differences in square foot prices. However, overly restrictive zoning practices, more stringent construction codes and higher other regulatory costs undoubtedly contribute to higher per square foot prices. Regional differences in the types of homes, prevalent features and materials used in construction also contribute to price differences. In the South, for example, lower square foot prices partially reflect less frequent regional occurrence of costly new home features such as basements.

In the custom home market, new contractor-built SFD homes in New England are by far the most expensive to build. Half of custom SFD homes started in New England in 2023 registered prices greater than $233 per square foot of floor area. The East North Central division came in second with the median of $199 per square foot of floor space. The median custom square foot price in the neighboring Mid Atlantic division was $183 per square foot.

The Mountain division had similarly high custom square foot prices. Half of custom SFD started here in 2023 had prices of $184 per square foot or higher. The corresponding median price in the neighboring Pacific was $167 per square foot.

The West South Central and South Atlantic divisions are where the most economical custom homes were started in 2023 with half of new custom homes registering prices at or below $136 and $138 per square foot of floor space, respectively. The remaining division in the South – East South Central – recorded slightly higher median square foot contract prices of $145 – still below the national median of $162.

Typically, contractor-built custom homes are more expensive per square foot than for-sale homes after excluding improved lot values. Over the last two decades, this custom home premium averaged slightly above 9%, suggesting that new custom home buyers are not only willing to wait longer to move into a new home, but also pay extra for pricier features and materials.

However, these custom home premiums (see the chart below) largely disappeared in the post-pandemic environment characterized by supply chain disruptions, skyrocketing building materials costs and home prices setting new records monthly. In 2023, the custom home premium averaged 8%, close to its historic norm, suggesting that this recent trend reversed, and once again custom home buyers are likely to pay more for pricier features and materials.

The NAHB estimates in this post are based on the Survey of Construction (SOC) data. The survey information comes from interviews of builders and owners of the selected new houses. The reported prices are medians, meaning that half of all builders reported higher per square foot prices and the other half reported prices lower than the median. While the reported median prices cannot reflect the price variability within a division, and even less so within a metro area, they, nevertheless, highlight the regional differences in square foot prices.

For the square footage statistics, the SOC uses all completely finished floor space, including space in basements and attics with finished walls, floors, and ceilings. This does not include a garage, carport, porch, unfinished attic or utility room, or any unfinished area of the basement.

Discover more from Eye On Housing

Subscribe to get the latest posts sent to your email.


This article was originally published by a eyeonhousing.org . Read the Original article here. .

Pin It