Tag

Highest

Browsing


Wholesale prices of goods used in residential construction rose in May as energy prices continued to climb. In May, residential building material prices, excluding energy, rose at their highest yearly rate since January 2023, as prices were up 4.4% from a year ago and up 0.7% over the month. Meanwhile, prices for services rose 4.7% over the year, but were unchanged from the previous month.

The Producer Price Index for final demand increased 1.1% in May, after rising 1.1% in April. Compared to a year ago, final demand prices were up 6.5%. The index for final demand services rose 0.3% in May, while the index for final demand goods rose 2.8% over the month.

The price index for inputs to new residential construction rose 1.3% in May and was up 6.9% from last year. The price of goods used in new residential construction (including energy) was up 2.1% over the month and up 8.3% from last year, while the price of services was unchanged over the month and up 4.7% from last year.

Input Goods

The goods component has a larger importance to the inputs to residential construction price index, representing around 60% of the total. On a monthly basis, the price of input goods to new residential construction was up 2.1% in May. This monthly increase was the largest since it rose 3.3% back in March of 2022.

The input goods to residential construction index can be further broken down into two separate components, one measuring energy inputs with the other measuring remaining goods. The latter of these two components simply represents building materials used in residential construction, which makes up around 93% of the goods index.

Energy input prices rose 17.2% in May and were 62.8% higher than a year ago. Building material prices were up 0.7% in May and up 4.4% compared to one year ago.

Among input goods, the largest year-over-year increase was for No. 2 diesel fuel as prices were 105.9% higher than a year ago. Metal molding and trim prices remained higher, with prices up 42.9% from a year ago. Softwood lumber prices were up 5.6% from a year ago in May while ready-mix concrete prices were up 1.7% from a year ago. Gypsum building materials prices were down 1.1% from a year ago.

Input Services

Prices for service inputs to residential construction reported no price change in May. On a year-over-year basis, service input prices were up 4.7%. The price index for service inputs to residential construction can be broken out into three separate components: a trade services component, a transportation and warehousing services component, and a services excluding trade, transportation, and warehousing component (other services).

The most significant component is trade services (around 60%), followed by other services (around 29%), and finally transportation and warehousing services (around 11%). The largest component, trade services, was up 3.8% from a year ago. The price of transportation and warehousing services rose 17.3%, while prices for other services were up 1.7% over the year.


This article was originally published by a eyeonhousing.org . Read the Original article here. .


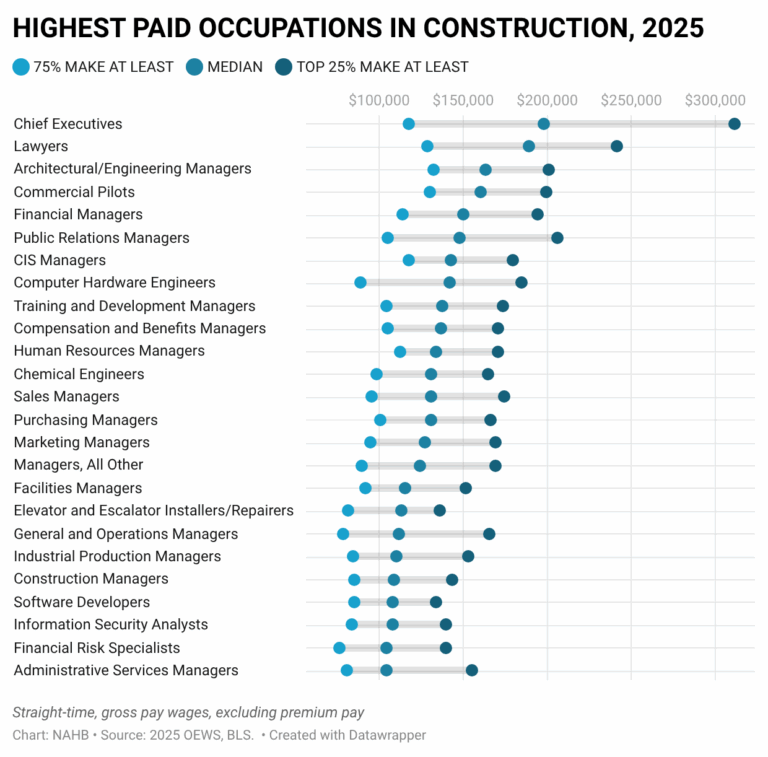
The median wage of payroll workers in construction was $61,370 in 2025, with the top 25% earning at least $83,480. In comparison, the U.S. median annual wage was $50,980, while workers in the top quartile (the highest paid 25%) earned at least $80,520. These estimates come from the latest release of the Bureau of Labor Statistics Occupational Employment and Wage Statistics (OEWS) and do not include premium pay (stock and year-end bonuses, overtime pay, weekend premium pay, etc.).

The OEWS publishes wage data for nearly 400 occupations in construction. Of these, only 46 are construction trades. The remaining workers are in finance, sales, administration, and other off-site activities.

In 2025, the highest-paid occupation in construction was Chief Executive Officer (CEO). Half of CEOs earned more than $198,000 in straight-time wages, and the top 25% earned over $312,000. CEOs in construction also had the widest pay scale spread in the industry, measured as the percentage difference between pay at the bottom and top quartiles. The highest-paid 25% of CEOs earned more than 2.6 times as much as those in the lowest-paid quartile. This wide scale likely reflects a broader range of responsibilities and differences in operational scope.

Lawyers working in construction ranked second, with a median annual wage of about $190,000. Lawyers in the top quartile earned at least $242,000, or 1.9 times more than lawyers in the lowest-paid quartile. This is also a relatively wide pay scale for the industry, reflecting differences in responsibilities and diverse opportunities for career advancement among lawyers in construction.

Of the twenty-five highest-paid occupations in construction, sixteen were managerial roles. The highest-paid managers in the industry were architectural and engineering managers, with half earning more than $163,290 and the top 25% earning over $201,300 annually. Architectural and engineering managers also stand out for having a narrower salary range. Only computer and information systems (CIS) managers and human resources (HR) managers had similarly narrow pay ranges among construction managers.

Among construction trades, elevator installers and repairers remained at the top of the median-wage list, with half earning over $113,710 a year and the highest 25% making at least $136,320. This is the only construction trade that made the industry’s overall top 20 highest-paid occupations list.

First-line supervisors of construction trades are next on the trade list with a median wage of $80,000, and the top 25% earning at least $101,220.

In general, construction trades that require more years of formal education tend to offer higher annual wages. The median wage of construction and building inspectors was $74,460, and the top quartile was $95,290. This is also a trade with a relatively wider pay scale, with the top 25% earning at least 66% more than the bottom quartile, potentially reflecting greater variance in educational attainment, professional responsibilities, and expertise of building inspectors.

Carpenters are one of the most prevalent skilled trades in the construction industry. The occupation typically requires less formal education than many other professions, yet carpenters working in construction still earn wages well above the national median for all occupations. In 2025, half of carpenters earned more than $60,950 annually, while the top 25% made at least $77,390.

Plumbers and electricians, trades that typically require specialized training and licensing, had even higher annual wages. The median wage of plumbers in construction was $63,270, with the top quartile making over $83,360. Electricians’ wages are similarly high.

Terrazzo workers and pile-driver operators, fourth and fifth on the highest-paid trade list, registered especially wide wage ranges. The top 25% of pile-drivers earned at least $106,660, more than 80% above the earnings of the bottom quartile. This broad pay scale presumably reflects a greater variety of opportunities and geographic locations (including offshore rigs), as well as differences in technical expertise and training. Some pile-driving equipment comes with computerized controls and requires additional knowledge of electronics.

In contrast, solar photovoltaic installers, a relatively new construction trade, had a much narrower pay scale. The difference between the annual pay of the top 25 percent ($67,970) and the bottom quartile ($47,880) was 42%, likely reflecting less variation in expertise, training, and geographic prevalence.

Typically, construction trades that require less skill not only offer lower wages but also have less variation. Apprentice workers (helpers of painters, plumbers, electricians, roofers, carpenters, and other construction trades) illustrate this point. These are the six lowest-paid construction occupations that simultaneously show the narrowest variation. For example, the highest-paid quartile of carpenters’ helpers made at least $49,420 a year, while the bottom quartile earned at most $36,750, a 34% difference.


This article was originally published by a eyeonhousing.org . Read the Original article here. .

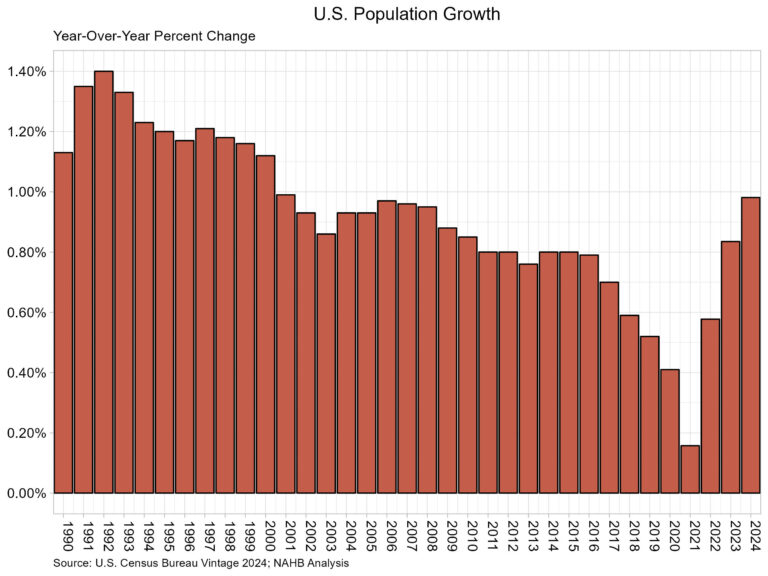
According to the U.S. Census Bureau’s latest estimates, the U.S. resident population grew by 3,304,757 to a total population of 340,110,988. The population grew at a rate of 0.98%, the highest rate since 0.99% in 2001. This also marked the third straight increase in the growth rate of the U.S. population. The vintage population estimates are released annually and represent the change in the U.S. population between July 1st of 2023 and 2024.

The Census Bureau reports that the primary source of population growth was net international migration (immigration), as international migration levels once again were higher than the previous year. The level of net international migration between 2023 and 2024 was 2,786,119. The second component of population growth is natural growth, which represents births minus deaths. Births totaled 3,605,563, down slightly from last year, while the number of deaths was reported at 3,086,925, also a decrease from last year. The natural growth, therefore, between 2023 and 2024 was 518,638.

Each region in the U.S. experienced population growth for the 2023-2024 period. The South led in population growth at 1.34% followed by the West at 0.85%. Meanwhile, the Midwest population grew 0.75%, while the Northeast grew the least at 0.59%.  

At the State level, 47 States and the District of Columbia had a population increase over the year. Of note, D.C. had the highest growth rate at 2.13%. Florida was second with population growth at 2.00% followed by Texas at 1.80%. Numerically, Texas experienced the largest population increase gaining 562,941. This was followed by Florida at 467,347 and California at 232,570.

Only three states lost population or remained level according to Census estimates. Vermont and West Virginia tied with a decline of 0.03%. Meanwhile Mississippi saw no population change.

California remained the most populous state by a healthy margin. California’s population was at 39,198,693, while the next most populous state was Texas at 31,290,831. To round out the top five States by total population the proceeding highest were Florida (23,372,215), New York (19,867,248), and Pennsylvania (13,078,751).


This article was originally published by a eyeonhousing.org . Read the Original article here. .

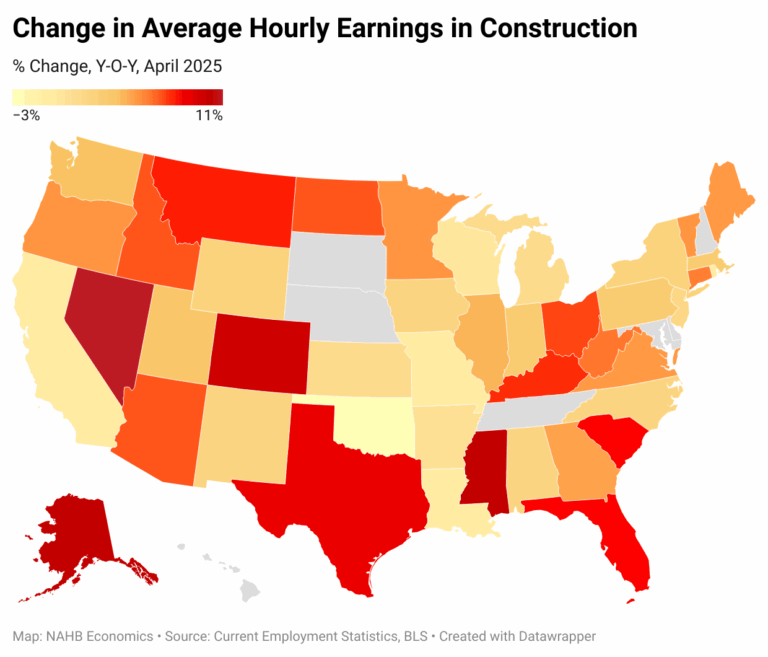
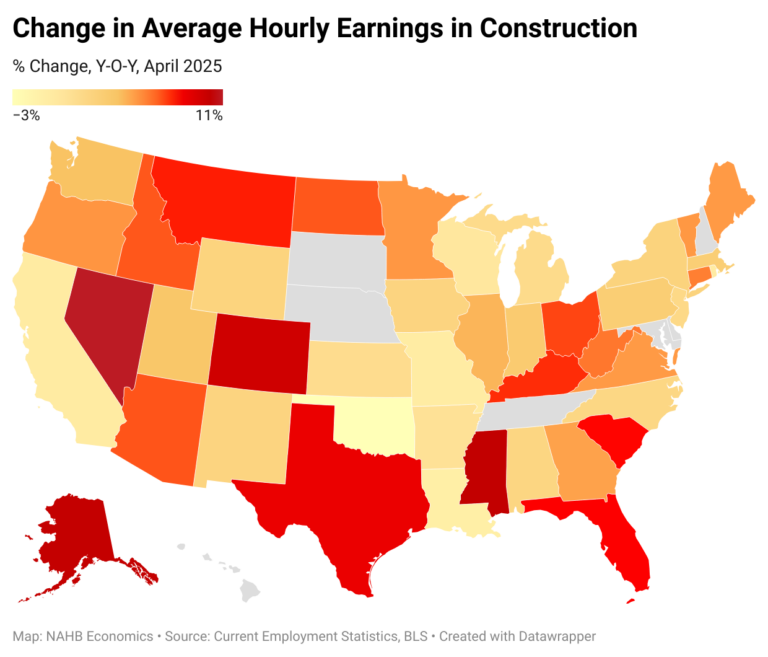
Wage growth in construction continued to decelerate in April on a national basis, but the differences across regional markets remain stark. Nationally, average hourly earnings (AHE) in construction increased 3.6% year-over-year and crossed the $39.3 mark when averaged across all payroll employees (non-seasonally adjusted, NSA). Meanwhile, average earnings in construction in Alaska and Massachusetts exceeded $50 per hour (NSA). Across states, the annual growth rate in AHE ranged from 10.6% in Nevada to a decline of 3% in Oklahoma. This is according to the latest Current Employment Statistics (CES) report from the Bureau of Labor Statistics (BLS).   

Average hourly earnings (AHE) in construction vary greatly across 43 states that report these data. Alaska, states along the Pacific coast, Illinois, Minnesota, and the majority of states in Northeast record the highest AHE. As of April 2025, fourteen states report average earnings (NSA) exceeding $40 per hour.

At the other end of the spectrum, nine states report NSA average hourly earnings in construction under $34. The states with the lowest AHE are mostly in the South, with Arkansas reporting the lowest rate of $29.3 per hour.

While differences in regional hourly rates reflect variation in the cost of living across states among other things, the faster growing wages are more likely to indicate specific labor markets that are particularly tight. Year-over-year, Nevada, Mississippi, Alaska, Colorado, Texas, Florida, South Carolina, and Montana reported fastest growing hourly wages in construction, more than doubling the national average growth of 3.6%. Nevada reported the largest annual increase of 10.6%, while the growth rate in Mississippi and Alaska was just under 10%.

In sharp contrast, Oklahoma registered a decline in hourly wages of 3%. Five other states reported modestly declining hourly rates in construction, compared to a year ago – Louisiana, Missouri, Rhode Island, California, and Wisconsin.


This article was originally published by a eyeonhousing.org . Read the Original article here. .

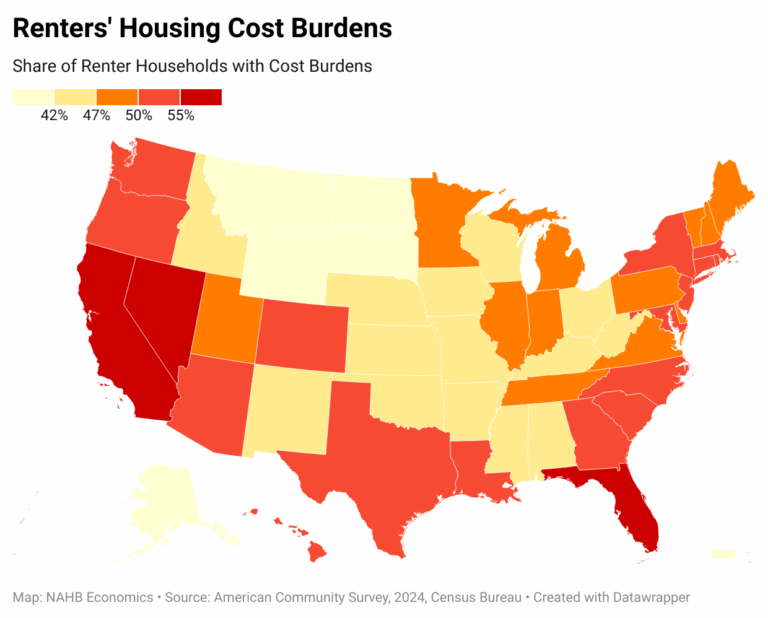
The housing affordability crisis continues to disproportionately affect renters, with more than half of renter households experiencing high-cost burdens — i.e., paying 30% or more of their income on rent and utilities. At the same time, current home owners, buoyed by significant home equity gains and locked in by below-market mortgage rates, are in a more advantageous financial position to weather the growing affordability crisis. According to the latest 2024 American Community Survey (ACS), more than half of all renter households (50.3%), or 23.2 million, are burdened by housing costs. Among home owners, this share is less than a quarter (24.3%) representing 21 million households. As a result, states and counties with higher shares of renters in their housing markets are more likely to have higher overall shares of households with cost burdens.

Geographically, Florida, Nevada, and California have the largest concentration of cost-burdened renters. In Florida, 60% of all renters pay more than 30% of their income on rent and utilities. In Nevada, the share is 57%, and in California, 55% of renters experience housing cost burdens. Even in states with comparatively low renter cost-burden rates—such as South Dakota, Alaska, and North Dakota—more than one-third of renters still spend 30% or more of their income on housing.

For home owners, cost-burden rates are generally lower, but the geographic pattern mirrors that of renters. California, Florida, and several Northeastern states report the highest shares of cost-burdened home owners. California faces the most severe affordability challenges, with one in three owners paying more than 30% of their income for housing. Florida and Hawaii follow closely, with 31% of existing home owners struggling to afford their homes.

At the opposite end of the spectrum, nine states in the Midwest and South report that fewer than 20% of homeowners are cost-burdened. West Virginia and North Dakota have the lowest rates, at just 16%.


This article was originally published by a eyeonhousing.org . Read the Original article here. .

Wage growth in construction continued to decelerate in April on a national basis, but the differences across regional markets remain stark. Nationally, average hourly earnings (AHE) in construction increased 3.6% year-over-year and crossed the $39.3 mark when averaged across all payroll employees (non-seasonally adjusted, NSA). Meanwhile, average earnings in construction in Alaska and Massachusetts exceeded $50 per hour (NSA). Across states, the annual growth rate in AHE ranged from 10.6% in Nevada to a decline of 3% in Oklahoma. This is according to the latest Current Employment Statistics (CES) report from the Bureau of Labor Statistics (BLS).   

Average hourly earnings (AHE) in construction vary greatly across 43 states that report these data. Alaska, states along the Pacific coast, Illinois, Minnesota, and the majority of states in Northeast record the highest AHE. As of April 2025, fourteen states report average earnings (NSA) exceeding $40 per hour.

At the other end of the spectrum, nine states report NSA average hourly earnings in construction under $34. The states with the lowest AHE are mostly in the South, with Arkansas reporting the lowest rate of $29.3 per hour.

While differences in regional hourly rates reflect variation in the cost of living across states among other things, the faster growing wages are more likely to indicate specific labor markets that are particularly tight. Year-over-year, Nevada, Mississippi, Alaska, Colorado, Texas, Florida, South Carolina, and Montana reported fastest growing hourly wages in construction, more than doubling the national average growth of 3.6%. Nevada reported the largest annual increase of 10.6%, while the growth rate in Mississippi and Alaska was just under 10%.

In sharp contrast, Oklahoma registered a decline in hourly wages of 3%. Five other states reported modestly declining hourly rates in construction, compared to a year ago – Louisiana, Missouri, Rhode Island, California, and Wisconsin.

Discover more from Eye On Housing

Subscribe to get the latest posts sent to your email.


This article was originally published by a eyeonhousing.org . Read the Original article here. .

Half of payroll workers in construction earn more than $60,320 and the top 25% make at least $81,510, according to the latest May 2024 Bureau of Labor Statistics Occupational Employment and Wage Statistics (OEWS) and analysis by the National Association of Home Builders (NAHB). In comparison, the U.S. median annual pay is $49,500, while the top quartile (the highest paid 25%) makes at least $78,810.

The OEWS publishes wages for almost 400 occupations in construction. Out of these, only 46 are construction trades. The other construction industry workers are in finance, sales, administration and other off-site activities.

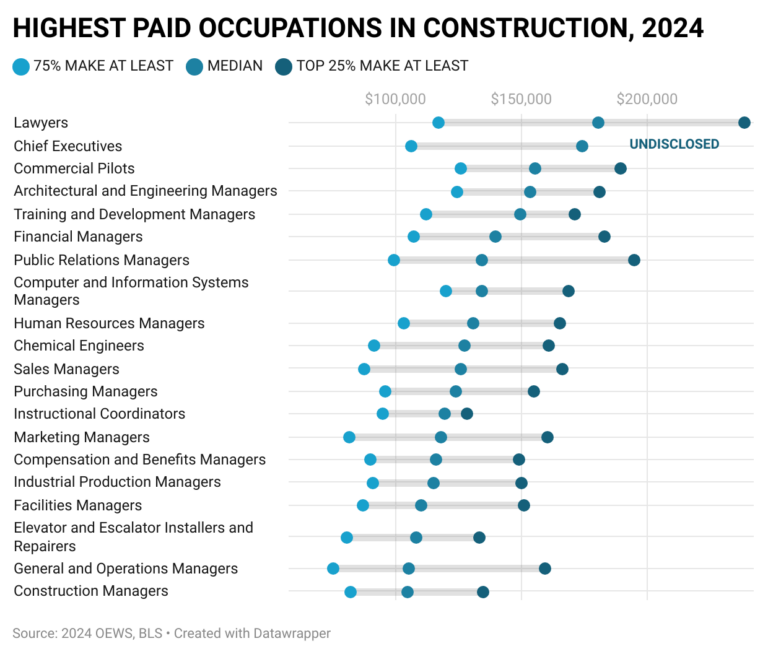
In 2024, the highest paid occupation in construction is lawyers with wages of $180,520 per year, and the top 25 percent making over $238,720. Traditionally, Chief Executive Officer (CEO) occupy the top paid position in the industry, but in 2024, they are second on the list, with half of CEOs making over $174,030, while the wages of the top quartile remain undisclosed.

Out of the top twenty highest paid occupations in construction, fourteen are various managers. The highest paid managers in construction are architectural and engineering managers, with half of them making over $153,510 and the top 25 percent on the pay scale earning over $181,150 annually.

The architectural and engineering managers also stand out for having a smaller salary range spread, measured as a percentage difference between the bottom and top 25 percent pay levels. Only computer and information systems (CIS) managers have a narrower pay range among managers in construction. The annual pay of the highest paid 25 percent CIS managers in construction is at least $168,850, which is 40% higher than the top earnings of the lowest paid quartile ($119,990). In contrast, higher-level positions, such as lawyers and CEOs, have a noticeably wider pay scale spread. The top 25 percent highest paid lawyers make more than double of the bottom quartile pay, potentially reflecting a greater range of responsibilities and opportunities for career advancement for lawyers in construction.

Among construction trades, elevator installers and repairers top the median wages list with half of them earning over $108,130 a year, and the top 25% making at least $133,370. This is also the only construction trade that made the industry overall top 20 highest paid occupations list. 

First-line supervisors of construction trades are next on the trade list; their median wages are $78,900, with the top 25% highest paid supervisors earning more than $100,150.  

In general, construction trades that require more years of formal education tend to offer higher annual wages. Median wages of construction and building inspectors are $66,340 and the top quartile is $89,550. This is also the trade with a relatively wide pay scale spread, with the top 25 percent making at least 74% more than the bottom quartile, potentially reflecting a wider variance in educational attainment, professional responsibilities and expertise of building inspectors.

Carpenters are one of the most prevalent construction crafts in the industry. The trade requires less formal education. Nevertheless, the median wages of carpenters working in construction exceed the national median. Half of these craftsmen earn over $59,890 and the highest paid 25 percent bring in at least $76,290.

Plumbers and electricians, trades that typically require specialized training and licensing, earn higher annual wages. Half of plumbers in construction earn over $62,820, with the top quartile making over $81,740. Electricians’ wages are similarly high.

The construction trade with the greatest pay range spread is pile driver operators. The top 25 percent highest paid operators earn at least $105,100, over 100% more than the bottom quartile. This wide pay scale presumably reflects a greater variety of opportunities and geographic locations (some pile driver operators work on offshore rigs), as well as varying degree of technical expertise and training (some equipment comes with computerized controls and requires additional knowledge of electronics).

In contrast, solar photovoltaic installers, a relatively new construction trade, have a much narrower pay scale. The difference between the annual pay of the top 25 percent ($65,850) and the bottom quartile ($48,350) is 36%, likely reflecting less variation in expertise, training, and geographic prevalence.

Typically, construction trades that require less skill not only offer lower wages but also show less variation in pay. Apprentice workers (helpers of painters, plumbers, electricians, roofers, carpenters, and other construction trades) illustrate this point. These are the six lowest paid construction occupations that simultaneously show the narrowest variation in pay. For example, the highest paid quartile of carpenters’ helpers makes at least $46,720 a year, while the bottom quartile earns at most $35,870, only a 30% difference.

Discover more from Eye On Housing

Subscribe to get the latest posts sent to your email.


This article was originally published by a eyeonhousing.org . Read the Original article here. .

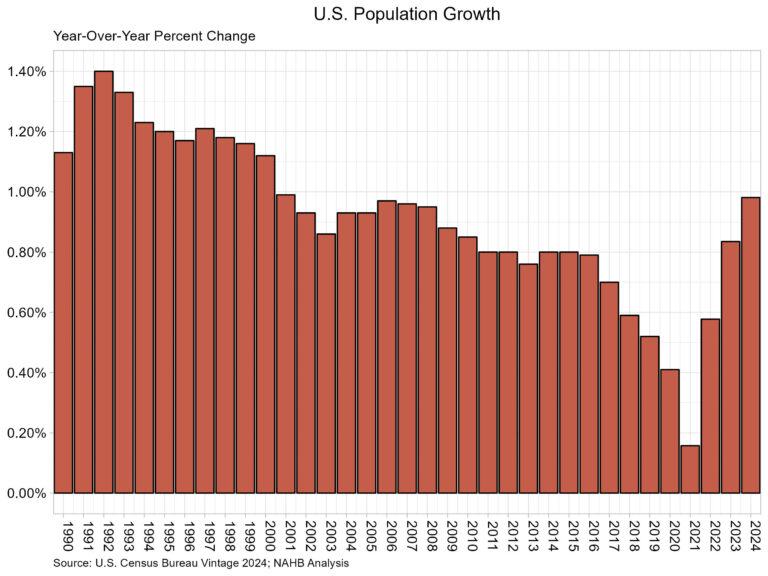
According to the U.S. Census Bureau’s latest estimates, the U.S. resident population grew by 3,304,757 to a total population of 340,110,988. The population grew at a rate of 0.98%, the highest rate since 0.99% in 2001. This also marked the third straight increase in the growth rate of the U.S. population. The vintage population estimates are released annually and represent the change in the U.S. population between July 1st of 2023 and 2024.

The Census Bureau reports that the primary source of population growth was net international migration (immigration), as international migration levels once again were higher than the previous year. The level of net international migration between 2023 and 2024 was 2,786,119. The second component of population growth is natural growth, which represents births minus deaths. Births totaled 3,605,563, down slightly from last year, while the number of deaths was reported at 3,086,925, also a decrease from last year. The natural growth, therefore, between 2023 and 2024 was 518,638.

Each region in the U.S. experienced population growth for the 2023-2024 period. The South led in population growth at 1.34% followed by the West at 0.85%. Meanwhile, the Midwest population grew 0.75%, while the Northeast grew the least at 0.59%.  

At the State level, 47 States and the District of Columbia had a population increase over the year. Of note, D.C. had the highest growth rate at 2.13%. Florida was second with population growth at 2.00% followed by Texas at 1.80%. Numerically, Texas experienced the largest population increase gaining 562,941. This was followed by Florida at 467,347 and California at 232,570.

Only three states lost population or remained level according to Census estimates. Vermont and West Virginia tied with a decline of 0.03%. Meanwhile Mississippi saw no population change.

California remained the most populous state by a healthy margin. California’s population was at 39,198,693, while the next most populous state was Texas at 31,290,831. To round out the top five States by total population the proceeding highest were Florida (23,372,215), New York (19,867,248), and Pennsylvania (13,078,751).

Discover more from Eye On Housing

Subscribe to get the latest posts sent to your email.


This article was originally published by a eyeonhousing.org . Read the Original article here. .

With the end of 2024 approaching, NAHB’s Eye on Housing is reviewing the posts that attracted the most readers over the last year. In April, Natalia Siniavskaia shared wages by occupation in construction including the median salaries and top 25% salaries.

Half of payroll workers in construction earn more than $58,500 and the top 25% make at least $79,450, according to the latest May 2023 Bureau of Labor Statistics Occupational Employment and Wage Statistics (OEWS) and analysis by the National Association of Home Builders (NAHB). In comparison, the U.S. median wage is $48,060, while the top quartile (top 25%) makes at least $76,980.

The OES publishes wages for almost 400 occupations in construction. Out of these, only 46 are construction trades. The other industry workers are in finance, sales, administration and other off-site activities.

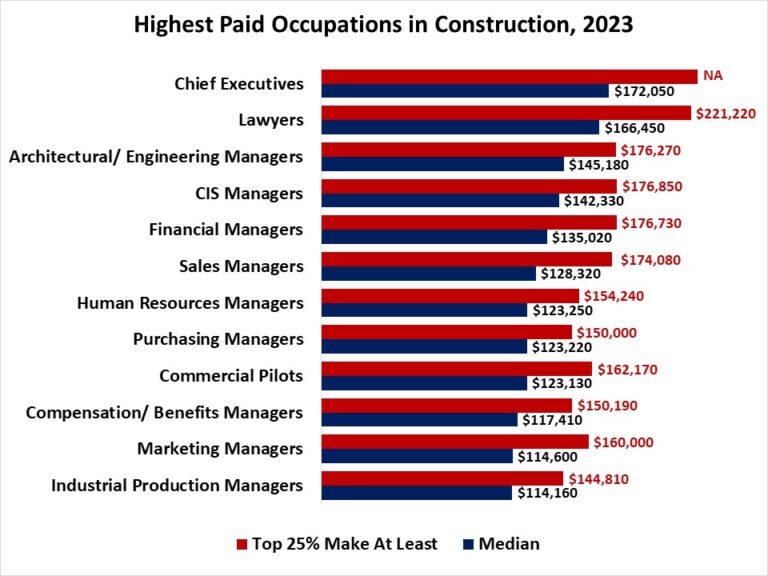
The highest paid occupation in construction is Chief Executive Officer (CEO) with half of CEOs making over $172,000 per year. Lawyers working in construction are next on the list with the median wages of $166,450, and the top 25 percent highest paid lawyers making over $221,220. Out of the next ten highest paid trades in construction, eight are various managers. The highest paid managers in construction are architectural and engineering managers, with half of them making over $145,180 and the top 25 percent on the pay scale earning over $176,270 annually.

Among construction trades, elevator installers and repairers top the median wages list with half of them earning over $103,340 a year, and the top 25% making at least $129,090. First-line supervisors of construction trades are next on the list; their median wages are $76,960, with the top 25% highest paid supervisors earning more than $97,500.

In general, construction trades that require more years of formal education, specialized training or licensing tend to offer higher annual wages. Median wages of construction and building inspectors are $65,790 and the wages in the top quartile of the pay scale exceed $88,800. Half of plumbers in construction earn over $61,380, with the top quartile making over $80,300. Electricians’ wages are similarly high.

Carpenters are one of the most prevalent construction crafts in the industry. The trade requires less formal education. Nevertheless, the median wages of carpenters working in construction exceed the national median. Half of these craftsmen earn over $57,300 and the highest paid 25% bring in at least $73,800.

The OEWS program adopted a new estimation methodology in 2021. As a result, the previously published estimates are not directly comparable to the post-pandemic editions.  Nevertheless, comparing the median wages in construction over the last two years reveals that, on average, lower-paid occupations experienced a somewhat faster wage growth. Median wages of drywall installers, for example, grew 11%. Moreover, the overall construction median increased 7.3%, one of the largest increases among all industries.  

Discover more from Eye On Housing

Subscribe to get the latest posts sent to your email.


This article was originally published by a eyeonhousing.org . Read the Original article here. .

Owners’ equity share of household real estate assets remained above 70% for the tenth straight quarter, continuing to mark the highest levels of this share since the late 1950s. The share in the second quarter of 2024 was 72.7%, up from a year ago when it stood at 71.4%. Notably, this is the highest reading of owners’ equity share since the fourth quarter of 1958, when it was 73.3%.

Household real estate assets represent all types of owner-occupied housing including farm houses and mobile homes, as well as second homes that are not rented, vacant homes for sale, and vacant land at current market value. Household real estate liabilities represent all outstanding residential mortgages as well as loans made under home equity lines of credit and home equity loans secured by junior liens. Owners’ equity is the difference between the current market value of the household’s property and the existing debt secured by the property (assets – liabilities).

The market value of household real estate assets rose from $46.4 trillion to $48.2 trillion in the second quarter of 2024 according to the most recent release of U.S. Federal Reserve Z.1 Financial Accounts. Over the year, household real estate assets were 7.7% higher in the second quarter following a 9.2% increase in the first quarter.

Household real estate secured liabilities, i.e. mortgages, home equity loans, and HELOCs, increased 0.8% over the second quarter to $13.1 trillion. This level is 2.6% higher than the second quarter of 2023, the same as the increase in the first quarter of 2.6%.

Discover more from Eye On Housing

Subscribe to get the latest posts sent to your email.


This article was originally published by a eyeonhousing.org . Read the Original article here. .

Pin It