Tag

high

Browsing


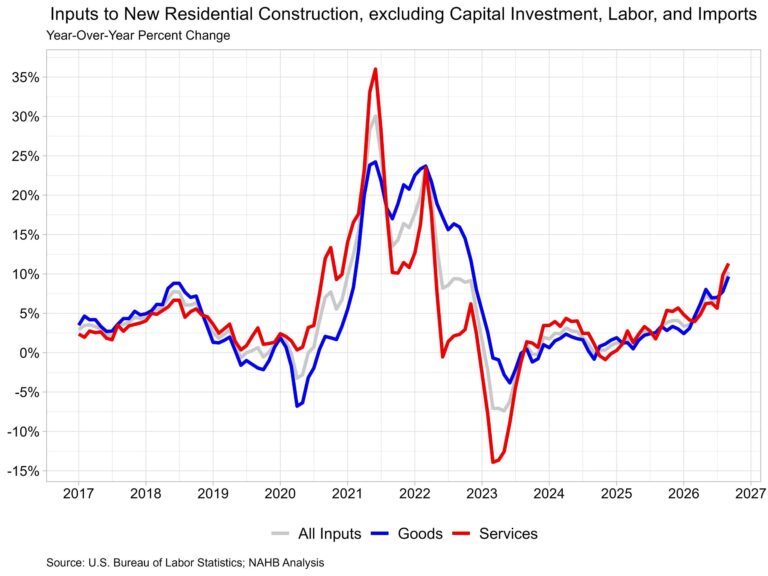
The Producer Price Index for final demand was up 1.3% in September, after rising 0.5% in August. Compared to a year ago, final demand prices were up 6.3%. The price of goods used in new residential construction (including energy) was up 1.8% over the month and up 9.7% from last year, while the price of services was up 2.2% over the month and up 11.3% from last year. Combining goods and services, the price index for inputs to new residential construction was up 2.0% in September and 10.3% higher than last year.

Input Goods

The goods component has a larger importance to the inputs to residential construction price index, representing around 60% of the total. On a monthly basis, the price of input goods to new residential construction was up 1.8% in September after rising 0.9% in August.

The input goods to residential construction index can be further broken down into two separate components, one measuring energy inputs with the other measuring remaining goods. The latter of these two components simply represents building materials used in residential construction, which makes up around 93% of the goods index.

Energy input prices rose 13.0% in September and were 64.1% higher than a year ago. Building material prices were up 0.4% in September and up 5.5% compared to one year ago, the highest level since 8.0% in December 2022.

Price increases for energy products outpaced other materials. No. 2 diesel fuel prices were up 24.2% over the month and 115.2% higher than a year ago. Unleaded regular gasoline prices rose 13.0% over the month and were 66.1% higher than a year ago. Outside of energy products, particleboard and fiberboard prices rose 3.5% over the month and were up 7.8%, meanwhile prices for mineral wool (f[RD2.1]or insulation) rose 2.8% over the month and were up 1.6% from a year ago. Softwood veneer and plywood prices were up 2.7% over the month and 15.9% higher than a year ago.

Input Services

Prices for service inputs to residential construction rose 2.2% in September. On a year-over-year basis, service input prices were up 11.3%, the highest since April 2022 when service prices rose 17.7% year-over-year. The price index for service inputs to residential construction can be broken out into three separate components: a trade services component, a transportation and warehousing services component, and a services excluding trade, transportation, and warehousing component (other services).

The most significant component is trade services (around 60%), followed by other services (around 29%), and finally transportation and warehousing services (around 11%). The largest component, trade services, was up 14.0% from a year ago. The price of transportation and warehousing services has risen 19.3% over the year, while prices for other services were up 3.1% over the year.


This article was originally published by a eyeonhousing.org . Read the Original article here. .


In 2025, the number of women employed in the construction industry rose to around 1.37 million, an increase of about 31,000 from 2024. Women accounted for 11.3% of total construction employment, the highest share in the past 20 years.  

The growing presence of women in construction aligns with the expansion of white-collar jobs in the industry. As the industry continues to face a persistent shortage of skilled labor, expanding the workforce remains one of the top priorities of the industry. Increasing the participation of women into the construction labor force represents a potential opportunity for future growth. This article uses labor force statistics from the Current Population Survey (CPS) to examine the role of women in construction employment and the occupations in which women are most highly represented.

The number of women working in construction has increased substantially since the Great Recession. As shown in the figure below, the number of women working in construction declined from more than 1.1 million in 2007 to roughly 807,000 in 2010, as the housing recession sharply reduced construction activity. Since then, women’s employment in construction has generally trended upward. From 2010 to 2017, the number gradually rose to around 970,000 but remained below the peak of pre-recession levels. The number surpassed 1 million again in 2018, reached 1.24 million in 2021, and continued rising to 1.37 million in 2025.

The share of women in construction workforce has also increased. After remaining around 9% after the Great Recession, the share began picking up noticeably in 2017. By 2025, women represented 11.3% of the construction workforce, marking the highest share over the 2004-2025 period.

Although women’s share in construction workforce has increased, their participation in construction varies widely by occupations. According to the CPS data, most women are employed in occupations such as office and administrative support, management, and and business and financial operations. Women accounted for 78% of office and administrative support occupations within the construction industry, the highest share among major construction occupational groups. Women also represented 40% of workers in service occupations (excluding protective services), and 35% of workers in protective service occupations. Women also made up 24% of construction workers in professional occupations, 19% in sales occupations, and 16% in management, business, and financial operations occupations.

By contrast, women remained much less common in construction and maintenance occupations, which account for the largest number of employees in construction and are where additional workers are most needed. Women comprised only 4% of workers in construction and extraction occupations, 3% in installation, maintenance, and repair occupations, and 6% in production occupations. Increasing women’s participation in these occupations could help expand the pool of skilled workers available to the construction industry.


This article was originally published by a eyeonhousing.org . Read the Original article here. .


As the Iran conflict pushed up energy prices, the Personal Consumption Expenditures (PCE) Price Index—the Federal Reserve’s preferred inflation gauge—accelerated to a three-year high in May. While oil and gasoline prices have declined in recent weeks as planned Strait of Hormuz reopening reduced the risk of further energy price spikes, inflation may stay elevated in the coming months due to underlying price pressures. This could challenge the Fed’s recommitment to its price stability mandate.

The headline PCE price index increased 4.1% in May from a year ago, following a 3.8% increase in April, according to the Commerce Department’s Bureau of Economic Analysis. That was the highest level since April 2023. The “core” PCE price index, which excludes food and energy, rose 3.4% over the past twelve months, the highest since May 2023.

Despite the elevated inflation, consumer spending remained resilient as larger tax refunds and strong stock market gains provided a cushion for household finances. Consumer spending rose 0.7% in May, and real spending, adjusted to remove inflation, increased 0.3%.

Meanwhile, personal income rose 0.7% in May. Real disposable income— income adjusted for taxes and inflation —was up 0.3% in May, the first increase after three monthly declines. On a year-over-year basis, personal income was 3.8% higher, and real (inflation-adjusted) disposable income remained unchanged, following last month’s largest annual decline since November 2022.

With spending growth outpacing income growth, the personal saving rate held at 3.0% in May, unchanged from last month but matching the lowest level since July 2022, when core CPI was near its peak. With inflation eroding compensation gains, households are dipping into savings to support spending, especially amid higher energy costs following the start of the Iran war.


This article was originally published by a eyeonhousing.org . Read the Original article here. .


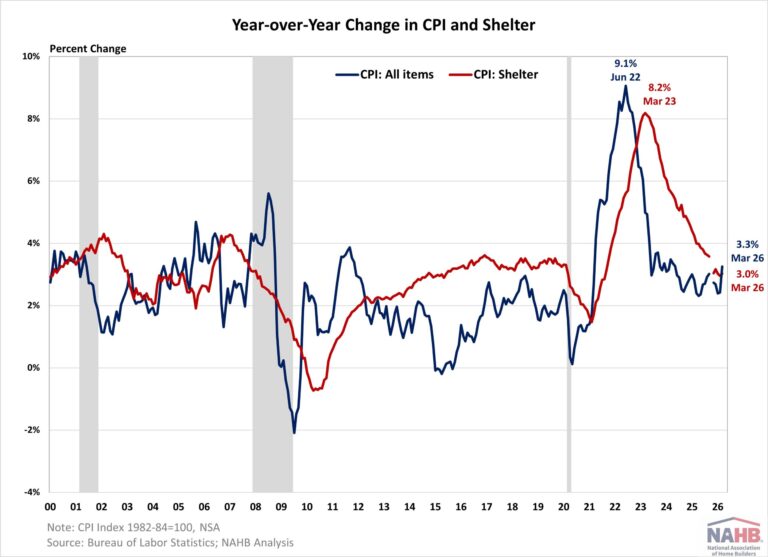
Consumer prices surged to a nearly two-year high in March, driven by a spike in energy costs following the onset of the Iran war. This is the first CPI report to reflect the impact of the war, with inflation rising nearly a full percentage point from February. National gasoline average prices in March soared above $4 for the first time since August 2022, accounting for nearly three-quarters of the monthly gain in inflation and marking the largest monthly increase in the gasoline index since government began tracking in 1967. As the ceasefire remains tenuous, energy prices are expected to remain elevated for months, continuing to put upward pressure on inflation and complicating the Fed’s path toward its 2% target.

On a non-seasonally adjusted basis, the Consumer Price Index (CPI) rose by 3.3% in March from a year ago, following a 2.4% increase last month, according to the Bureau of Labor Statistics (BLS) latest report. This was the largest annual increase since May 2024. The “core” CPI, excluding the volatile food and energy components, increased by 2.6% over the past twelve months, following a 2.5% increase in February. The housing shelter index, which makes up a large portion of “core” CPI, rose 3.0% over the year, holding steady over the last two months. Meanwhile, the component index of food rose by 2.7%, and the energy component index increased by 12.5%, the largest annual increase since November 2022.

On a monthly basis, the CPI rose by 0.9% in March (seasonally adjusted), and the “core” CPI increased by 0.2%.

The price index for a broad set of energy sources rose by 10.9% in March, the largest monthly increase since September 2005, with increases in fuel oil (+30.7%), gasoline (+21.2%), and electricity (+0.8%), partially offset by a decline in natural gas (-0.9%). Fuel oil posted its largest monthly increase since February 2000. Meanwhile, the food at home index fell by 0.2%, while the food away from home index increased by 0.2% in March.

Outside of energy, the index for shelter was the largest contributor to the overall monthly increase in the all items index. Other top contributors that rose in March included indexes for airline fares (+2.7%), apparel (+1.0%), household furnishings and operations (+0.2%), education (+0.3%), and new vehicles (+0.1%). Meanwhile, the index for medical care (-0.2%), personal care (-0.5%) and used cars and trucks (-0.4%) were among the few major indexes that decreased over the month.

The index for shelter, which makes up more than 40% of the “core” CPI, rose by 0.3% in March. The index for owners’ equivalent rent (OER) rose by 0.3%, while the index for rent of primary residence (RPR) increased by 0.2% over the month.

NAHB constructs a “real” rent index to indicate whether inflation in rents is faster or slower than core inflation. It provides insight into the supply and demand conditions for rental housing. When inflation in rents is rising faster than core inflation, the real rent index rises and vice versa. The real rent index is calculated by dividing the price index for rent by the core CPI (to exclude the volatile food and energy components). In March, the Real Rent Index remained unchanged.


This article was originally published by a eyeonhousing.org . Read the Original article here. .

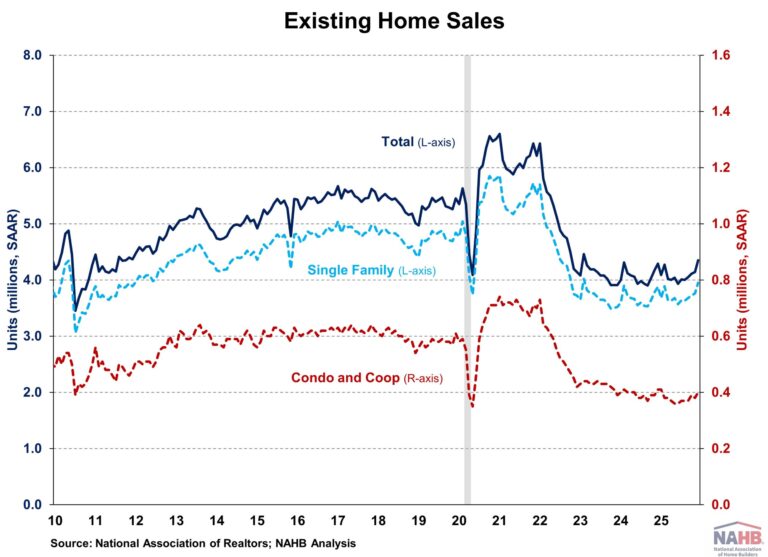
Existing home sales rose in December to the fastest pace in nearly three years, but annual sales for 2025 remained at a 30-year low as elevated home prices and mortgage rates kept buyers on the sidelines, according to the National Association of Realtors (NAR). While mortgage rates have eased from 7% seen at the start of 2025 to near 6% by year-end, tight inventory continued to push home prices higher as more homeowners took listings off the market. Resale inventory dropped to its lowest level since January 2025. Though home price appreciation has been slowed in recent months, housing affordability remains a challenge.

Total existing home sales, including single-family homes, townhomes, condominiums, and co-ops, rose 5.1% to a seasonally adjusted annual rate of 4.35 million in December, the highest level for 2025 and highest since February 2023. On a year-over-year basis, sales were 1.4% higher than a year ago. For the year 2025, existing home sales totaled 4.06 million, unchanged from 2024 and matching the lowest level since 1995.

The existing home inventory level was 1.18 million units in December, down 18.1% from November but up 3.5% from a year ago. At the current sales rate, December unsold inventory sits at a 3.3-months’ supply, down from 4.2-months in November but up from 3.2-months in December 2024. Inventory between 4.5 to 6 months’ supply is generally considered a balanced market.

The December median sales price of all existing homes was $405,400, up 0.4% from last year. This marks the 30th consecutive month of year-over-year increases. The median condominium/co-op price in December was up 1.5% from a year ago at $364,400.  Recent gains for home inventory will put downward pressure on resale home prices in most markets in 2026. All four major regions saw an increase in sales in December, with gains ranging from 2.0% in the Northeast and Midwest to 6.9% in the South. However, sales were mixed on a year-over-year basis. Sales remained unchanged in the Midwest and West, rose 3.6% in the South, and fell 1.9% in the Northeast.

The Pending Home Sales Index (PHSI) is a forward-looking indicator based on signed contracts. The PHSI rose from 76.7 to 79.2 in November due to lower mortgage rates. On a year-over-year basis, pending sales were 2.6% higher than a year ago, according to the National Association of Realtors’ data.


This article was originally published by a eyeonhousing.org . Read the Original article here. .


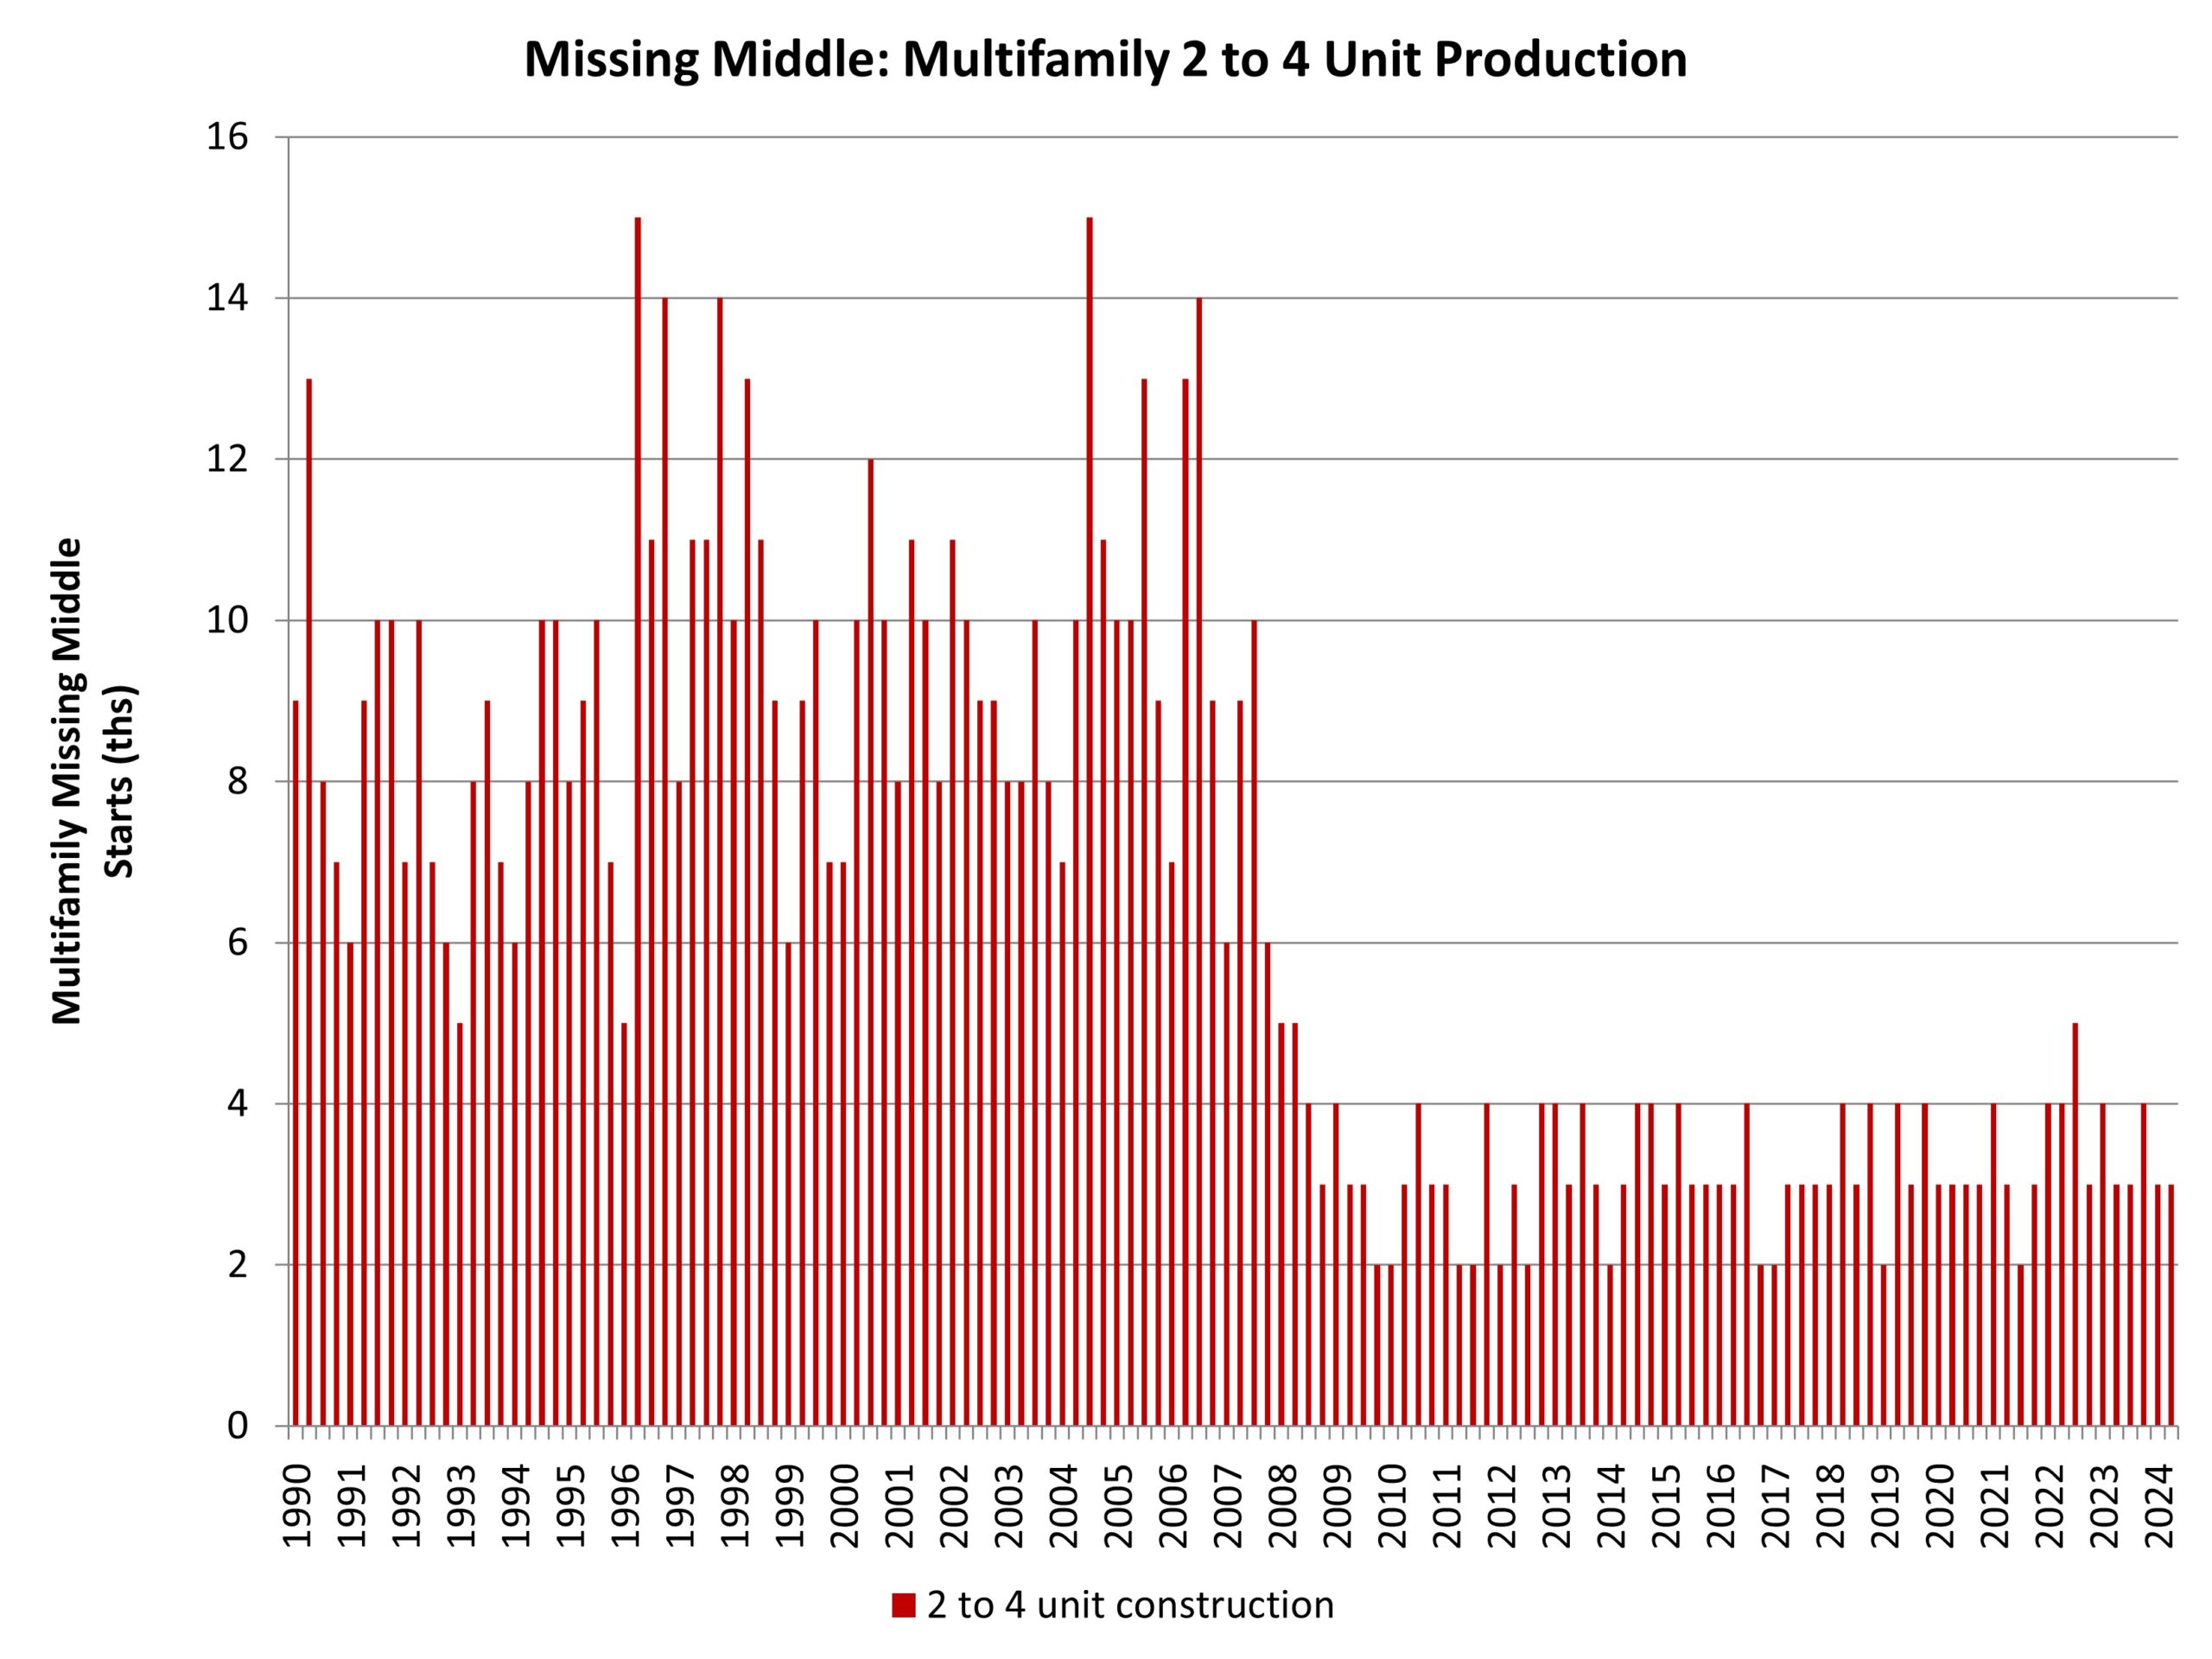
Multifamily units completed in 2024 recorded their highest level since 1986 at 608,000 units, according to NAHB analysis of the Census Bureau’s Survey of Construction. For the eighth consecutive year, most multifamily units were in buildings with 50 or more units (these will be labeled as high-density buildings).

As shown below, this trend is relatively new. Dating back to the earliest estimates in the series (1972), most multifamily units were historically located in buildings with less than 50 units (low-medium density buildings). Of the total 608,000 multifamily units completed in 2024, 330,000 (54%) were in high-density buildings while the remaining 278,000 (46%) were in low-medium density buildings.

Regional Distribution

The South continued to be the leading region in terms of units completed, rising from 212,000 in 2023 to 292,000 completions in 2024. The South accounted for 48% of the total number of completions; the West held 27% (163,000), the Midwest 14% (87,000), and the Northeast 11% (68,000). Singularly, the South was the only region where the number of units completed in low-medium density buildings outpaced the number in high-density buildings. The South had 147,000 completions in low-medium density compared to 145,000 units in high-density.

Conversely, in the Midwest and Northeast the number of units in high-density buildings nearly doubled those of low-medium density buildings. For the Midwest, there were 58,000 units in high-density buildings and 29,000 low-medium density units. The Northeast had 45,000 units in high-density buildings and 23,000 low-medium density units. The West featured an almost 50/50 split with 82,000 high-density units and 81,000 low-medium density.

Built-for-Rent

Among multifamily units completed in 2024, 95% were built-for-rent at a level of 580,000. Over half of these units (55%) were in a building with 50 units or more. This is a seismic shift towards high-density buildings, as this share was only 25% in 2004. Over the past twenty years, there has consistently been a falling share of units in buildings with 10-19 units, as the share in 2004 was 24%, while in 2024 this share only accounts for 4% of completed units.

Built-for-Sale

The number of multifamily units built-for-sale rose from 20,000 in 2023 to 29,000 in 2024. High-density buildings continued to be the primary type of building where these units were built, with 40% of built-for-sale units being completed in buildings with 50+ units. This share was up from 28% in 2023. The largest loss in market share for multifamily built-for-sale units was for buildings with 10-19 units, dropping from 23% in 2023 to just 13% in 2024.

Discover more from Eye On Housing

Subscribe to get the latest posts sent to your email.


This article was originally published by a eyeonhousing.org . Read the Original article here. .


Only 56% of professional remodelers undertake projects designed to allow homeowners to Age-in-Place (AIP), according to results from NAHB’s Q1 2025 Remodeling Market Index (RMI) survey.  This is the lowest percentage recorded since NAHB began periodically asking AIP questions on its RMI survey in 2004.  Economic uncertainty and high interest rates over the past year are the most likely explanations for this slight pullback in projects.  Additionally, stock market volatility has dampened any potential wealth effects, especially since over 75% of all corporate equities and mutual fund holdings are held by those 55 or older.

The National Institute of Aging defines AIP as “staying in your own home as you get older.”  This concept is becoming more relevant as the overall median age of the population continues to increase.  Given the age of the existing housing stock, the need to update homes for AIP is a major demand-driver for the remodeling sector.

Age Groups

When asked about the age groups of homeowners who request AIP work, 73% of remodelers indicated that homeowners are 65 years or older, followed by 55 to 64 years at 61%.  These two age groups have consistently been above 60% since the Q4 2010 survey.

Familiarity with Aging-in-Place

Ninety-six percent of remodelers indicated that most or some of their consumers are familiar with the AIP concept.  That share has been at least 90% since the Q4 2018 survey.

Type of Aging-in-Place Projects

Grab bars remain the most common AIP project, with 87% of remodelers reporting this job in the last year, followed by curb-less shower (78%), installing higher toilets (71%), and widening doorways (52%).  While their relative ranking has changed, these four have consistently been the AIP project types most often cited by remodelers.

Frequency of Aging-in-Place Requests

Seventy-three percent of remodelers indicated that requests for AIP features have significantly or somewhat increased over the past 5 years.  This figure has not changed much since the inception of the series in 2004, ranging from 72% to 77%.

Reasons for Aging-in-Place Work

As for the reason why customers are undertaking AIP projects, 91% of remodelers stated that customers are planning ahead for future needs, followed by living with older parents (48%) and acute age-related disabilities (43%). 

Who is Requesting Aging-in-Place Work?

Sixty-five percent of remodelers indicated that a majority of their AIP work was determined by the client, whereas the other 35% said it was mostly suggested by the contractor.  The ‘determined by client’ option has consistently been above 50 percent.

Receptive to Aging-in-Place Modifications

When asked how receptive potential clients are to incorporating suggested AIP modifications, 48% indicated that their customers were very receptive and 51% were somewhat receptive, with only 2% stated that customers were not at all receptive to these modifications.  The combined share of potential clients being receptive (‘very receptive’ + ‘somewhat receptive’) has consistently been above 95%.

Discover more from Eye On Housing

Subscribe to get the latest posts sent to your email.


This article was originally published by a eyeonhousing.org . Read the Original article here. .


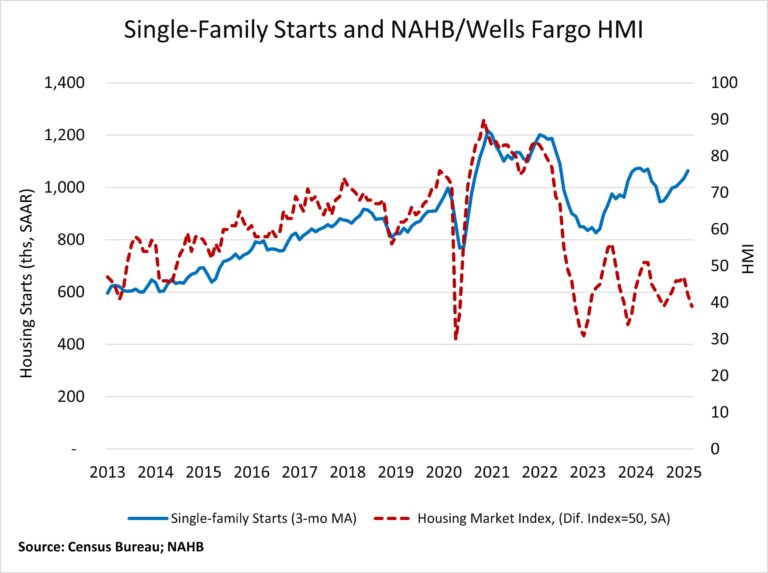
Limited existing inventory helped single-family starts to post a solid gain in February, but builders are still grappling with elevated construction costs stemming from tariff issues and persistent shortages related to buildable lots and labor.

Overall housing starts increased 11.2% in February to a seasonally adjusted annual rate of 1.50 million units, according to a report from the U.S. Department of Housing and Urban Development and the U.S. Census Bureau. The February reading of 1.50 million starts is the number of housing units builders would begin if development kept this pace for the next 12 months.

Within this overall number, single-family starts increased 11.4% to a 1.11 million seasonally adjusted annual rate, the highest pace since February 2024. The multifamily sector, which includes apartment buildings and condos, increased 10.7% to an annualized 393,000 pace.

While solid demand and a lack of existing inventory provided a boost to single-family production in February, our latest builder survey shows that builders remain concerned about challenging housing affordability conditions, most notably elevated financing and construction costs as well as tariffs on key building materials.

On a regional and year-to-date basis, combined single-family and multifamily starts were 4.7% lower in the Northeast, 21.5% lower in the Midwest, 8.3% lower in the South and 20.2% higher in the West.

Overall permits decreased 1.2% to a 1.46-million-unit annualized rate in February and were down 6.8% compared to February 2024. Single-family permits decreased 0.2% to a 992,000-unit rate and were down 3.4% compared to the previous year. Multifamily permits decreased 3.1% to a 464,000 pace.

Looking at regional permit data on a year-to-date basis, permits were 30.1% lower in the Northeast, 2.3% higher in the Midwest, 2.1% lower in the South and 12.5% lower in the West.

The number of single-family homes under construction in February was down 6.7% from a year ago, at 640,000 homes. In February, the count of apartments under construction increased 0.3% to an annualized 772,000 pace. It marks the first gain after 18 months of consecutive declines but was still down 20% from a year ago.

There were 526,000 multifamily completions in February, down 15% from the previous year. For each apartment starting construction, there are 1.5 apartments completing the construction process.

Discover more from Eye On Housing

Subscribe to get the latest posts sent to your email.


This article was originally published by a eyeonhousing.org . Read the Original article here. .


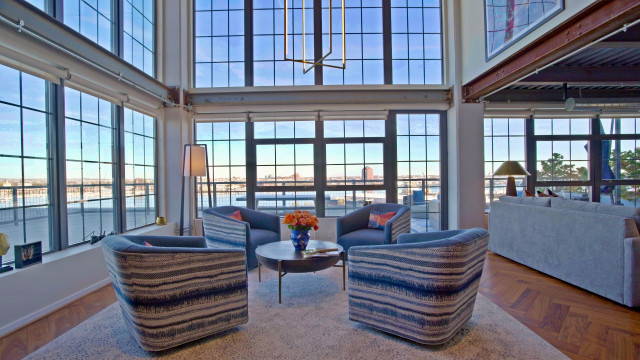
When retired lawyers Jim and Sheila Vidmar’s dream condo came on the market in Baltimore, the empty-nest couple knew they had to jump on it. The two-bedroom, two-bathroom corner unit on the 11th floor of a 24-floor former grain elevator built in 1923 offers sweeping views of the Patapsco River and Chesapeake Bay.

To help maximize the views and cozy up the industrial concrete-and-corrugated steel interiors, the Vidmars hired designer Brigid Wethington, who had worked with them on their previous home. Wethington, who used Houzz Pro software to manage the project, took inspiration from sunsets to bring in a palette of blues, whites and oranges. Durable fabric furnishings and multiple area rugs also soften the rooms, while walnut flooring in a herringbone pattern and other wood details add warmth. A layered lighting scheme enhances design elements without taking away from the stunning views.

Read more and save photos


This article was originally published by a www.houzz.com . Read the Original article here. .


NORTHVILLE, Mich. (FOX 2) – In Michigan alone there are an estimated 66,000 licensed real estate agents, making it an extremely competitive industry.

But there are ways to set yourself apart from the crowd – one agent from Metro Detroit who has really taken his profession to new heights.

Dylan Tent calls himself the heli-realtor – a helicopter pilot who also sells houses. Tent uses his passion to literally and figuratively elevate his sales game.

While his situation is unique, his story provides lessons for anyone looking to set themselves apart.

His videos are outrageous combining daring stunts with unique stories – all to get eyeballs on the properties he represents.

“I did jump a motorcycle pretty far over someone’s house and that’s when people saw, (and said) ‘Wow this video got 30,000 views. I want to hire that guy.'”

And so far, so good.

“An average real estate video might get 500 to 1,000 views, and we have stuff that goes into the hundreds of thousands and millions,” Tent said.

But his path to get there, wasn’t exactly a straight line.

“I quit college after watching a snowboarding movie called ‘The Art of Flight.’ I wanted to be a heli-ski pilot.”

That career choice was short-lived after he says it was more dangerous and less profitable than he thought.

“I started taking pictures of people’s houses from the air and selling them door to door,” he said. “One of the customers said if I got my real estate licenseI could sell his house.

“It was a beautiful lake house. I started adding up in my head, it was a little more profitable to sell real estate and then I could actually purchase and own a helicopter myself.”

Dylan turned 2,000 pictures from above into three real estate sales – and was off from there.

Having a helicopter offers certain advantages including travel for one, which broadens your sales area.

“Lapeer, Metamora, Detroit, Howell,” he said. “I have gone to all of those locations in two hours rather than six or seven hours of driving.”

And it potentially separates you from the competition.

“It really is a resource for video content,” he said. “If I post a video of a house we might get so many thousands of views. If I take off, or land in their front yard or back yard, or lake lot, we’ll get it to go viral almost every time.”

He wouldn’t do it if it didn’t work. but that’s not to say this sales tactic is for everyone.

FOX 2: “You have taken a lot of risks that have seemingly paid off?”

“For example, I had a property that had a gun range and we did some exploding targets that were blowing up stuffed animals on the gun range,” he said. “We were in an area where everyone has guns in that area. Other real estate agents were like, ‘I don’t think we should do that, that is unprofessional.’ I said I’m going to sell that property to a gun owner, I’m probably not going to sell it to someone who doesn’t have that.

“I don’t care if that makes someone angry.”

Tent says the real reason behind his success incorporates passion into his craft, something anyone can do.

“If I was a scratch golfer, I would probably focus on selling houses on golf courses,” he said. “If I was a yoga instructor, I would offer free yoga classes in the park. I have built more relationships through my hobbies than I have, anything else.”

In addition to selling houses, Dylan also offers helicopter tours of the Detroit areas. You can find him and contact him with social media by searching for Dylan Tent, Heli Realitor.

You can find Dylan Tent on social media below:


This article was originally published by a www.fox2detroit.com . Read the Original article here. .

Pin It