Tag

Growth

Browsing


Despite high mortgage rates, the lack of resale homes and pent-up demand drove solid growth in single-family permits across nearly all regions in the second quarter. In contrast, multifamily construction permit activity experienced declines across all regions for the second quarter of 2024. These trends are tabulated from the recent release of the National Association of Home Builders’ (NAHB) Home Building Geography Index (HBGI).

Single-Family

All markets for single-family construction saw higher growth in the second quarter compared to the first quarter. In contrast to the second quarter of 2023, which experienced declines across all markets, this year shows a clear reversal. Large metro core counties had the largest growth rate for the second consecutive quarter at 17.6%, while micro counties continued to have the lowest for the third straight quarter, at 3.4%.

Looking at single-family HBGI market shares, small metro core counties continued to have the largest market share at 28.9%. Large metro suburban counties are the only other market with over 20% market share, at 25.0% in the second quarter. The smallest market share continued to be non metro/micro counties at 4.3%. However, this market remains almost a percentage point higher than what it was pre-pandemic in 2019.

Multifamily

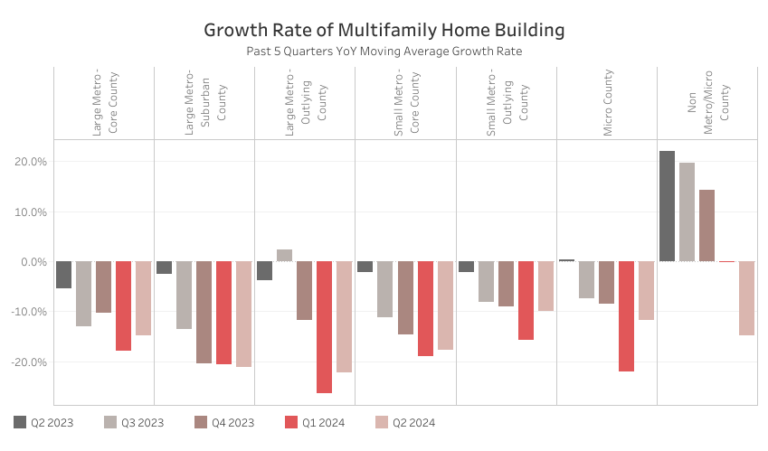
In the multifamily sector, the HBGI year-over-year growth continued to post declines for all markets in the second quarter. This can be contributed to high levels of multifamily units under construction and tighter financial conditions. Only two markets had larger declines than the first quarter, with large metro suburban counties down 21.1% and non metro/micro counties down 14.8%. Notably, non metro/micro counties were the last market to experience a decline in multifamily construction. These counties were an area of growth in the second, third and fourth quarters of last year while all other markets experience declines or negligible growth.

Multifamily market shares in the HBGI remained similar to the first quarter, with large metro core counties having the largest market share at 40.1%. The smallest market was non metro/micro counties, with a 1.1% market share.

The second quarter of 2024 HBGI data along with an interactive HBGI map can be found at http://nahb.org/hbgi.

Discover more from Eye On Housing

Subscribe to get the latest posts sent to your email.


This article was originally published by a eyeonhousing.org . Read the Original article here. .

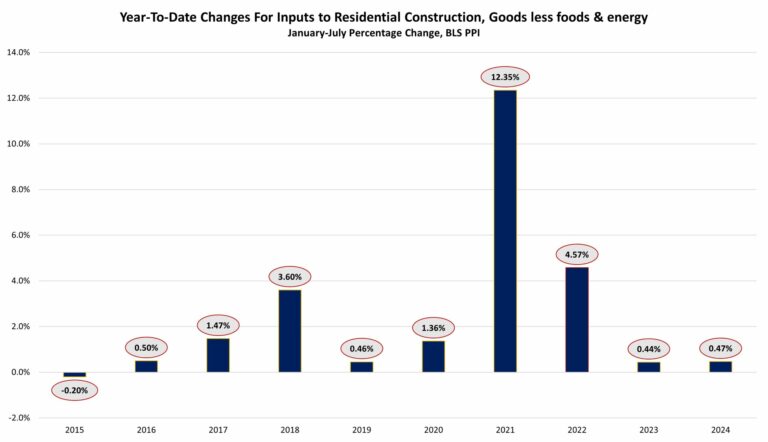
Inputs to residential construction, goods less foods and energy, decreased 0.04% over July according to the most recent Producer Price Index (PPI) report published by the U.S. Bureau of Labor Statistics (BLS). The index for inputs to residential construction, goods less food and energy, represents building materials used in residential construction. Compared to a year ago, the index is up 2.01% in July, marking the sixth straight month of above 2% growth.

Just past the midpoint of 2024, the year-to-date (YTD) increase in the index is at 0.47%. This is slightly higher yet similar to the YTD growth rate for 2023, which was 0.44%.

The seasonally adjusted PPI for final demand goods increased 0.62% in July, after decreasing a revised 0.36% in June. In July, the PPI for final demand energy increased 1.90%, final demand food also rose 0.61% and final demand goods, less food and energy, rose 0.24%. The BLS producer price indices measure the average change in selling prices that domestic producers receive for their output.

The seasonally adjusted PPI for softwood lumber fell 1.04% in July after rising 3.29% in June. Softwood lumber prices were 13.12% lower than July 2023.

The non-seasonally adjusted PPI for gypsum building materials increased 0.08% in July after no increase in June. Compared to last year, the index was up 4.25%, the highest yearly increase since April 2023 when the index was up 12.14%.

The seasonally adjusted PPI for ready-mix concrete rose 0.03% in July after falling 0.15% in June. Monthly growth in prices for read-mix concrete has been relatively flat for four consecutive months after prices peaked in March. Over the year, ready-mix concrete prices were 5.05% higher than July 2023.

The non-seasonally adjusted PPI for steel mill products fell for the second straight month, down 3.29% in July. Steel mill product prices are 13.99% lower than last year. Overall, steel mill product prices have fallen 36.99% since peaking back December of 2021.

The non-seasonally adjusted special commodity grouping PPI for copper rose 0.56% in July after falling 2.79% in June. Over the year, the index was up 14.26%. This special commodity grouping of copper includes the following commodities: copper and nickel ores, copper cathode and refined copper, copper base scrap, secondary copper (alloyed and unalloyed), copper and brass mill shapes, copper wire and cable, and copper base castings (excluding die-castings).

Discover more from Eye On Housing

Subscribe to get the latest posts sent to your email.


This article was originally published by a eyeonhousing.org . Read the Original article here. .

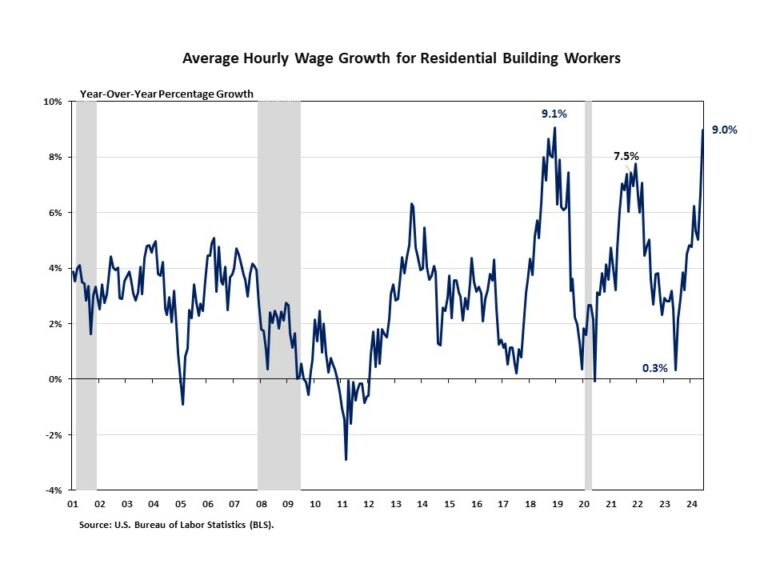
Residential building workers’ wage growth accelerated to 9.0% in June. This marks the fastest year-over-year (YOY) growth rate since December 2018. After a 0.3% increase in June 2023, the YOY growth rate for residential building worker wages have been trending upward over the past year.

The ongoing skilled labor shortage in the construction labor market and lingering inflation impacts account for the recent acceleration in wage growth. However, demand for construction labor is weakening as interest rates remain elevated. As mentioned in the latest JOLTS blog, the number of open construction sector jobs shifted notably lower from 366,000 in May to 295,000 in June. Nonetheless, the ongoing skilled labor shortage continues to challenge the construction sector.

According to the Bureau of Labor Statistics report, average hourly earnings for residential building workers* was $32.28 per hour in June 2024, increasing 9.0% from $29.62 per hour a year ago. This was 16.2% higher than the manufacturing’s average hourly earnings of $27.79 per hour, 10.6% higher than transportation and warehousing ($29.18 per hour), and 11.1% lower than mining and logging ($36.33 per hour).

Note: *Data used in this post relate to production and nonsupervisory workers in the residential building industry. This group accounts for approximately two-thirds of the total employment of the residential building industry.

Discover more from Eye On Housing

Subscribe to get the latest posts sent to your email.


This article was originally published by a eyeonhousing.org . Read the Original article here. .

Pin It