Tag

Grows

Browsing


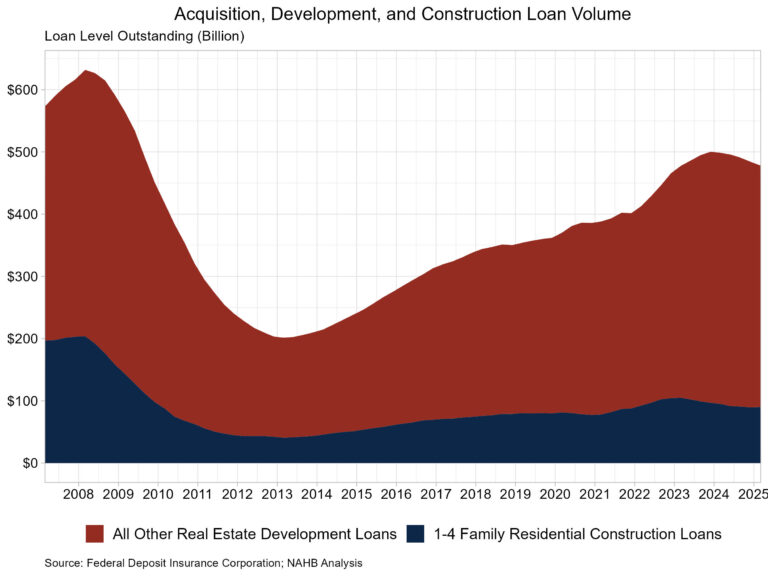
Credit conditions for builders and developers eased in the first quarter of 2025 as the level of outstanding 1-4 family residential construction loans rose for the first time in two years, according to data released by FDIC. While the volume of 1-4 family residential construction loans rose, a drop in other real estate development loans offset the increase, resulting in the fifth straight quarterly decline in the total volume of outstanding acquisition, development, and construction loans.

In the first quarter of 2025, the total level of outstanding acquisition, development, and construction loans fell to $478.3 billion, down 4.1% from a year ago. This was driven by the drop in other real estate development loans, which fell to $388.2 billion, down 3.8% compared to the a year ago. The volume of 1-4 family residential construction and land development loans totaled $90.0 billion in the first quarter, down 5.2% from a year ago. On a quarterly basis, this volume is up 0.6% from $89.5 billion one quarter ago.

It is worth noting, the FDIC data represent only the stock of loans, not changes in the underlying flows, so it is an imperfect data source. Nonetheless, lending remains much reduced from years past. The current amount of existing 1-4 family residential AD&C loans now stands 56% lower than the peak level of residential construction lending of $204 billion reached during the first quarter of 2008. Alternative sources of financing, including equity partners, have supplemented this capital market in recent years.

Quality Metrics of Construction Loans

Along with the volume increase of 1-4 family residential construction loans, the share of the volume that is 30+ days past due or nonaccrual status grew in the first quarter. The total level of past due and nonaccrual loans was $1.2 billion, up 24.4% from $978.4 million a year ago. As a share of the total 1-4 family residential construction loan volume, this accounts for only 1.4% but is notably the highest share since 2015.

Discover more from Eye On Housing

Subscribe to get the latest posts sent to your email.


This article was originally published by a eyeonhousing.org . Read the Original article here. .

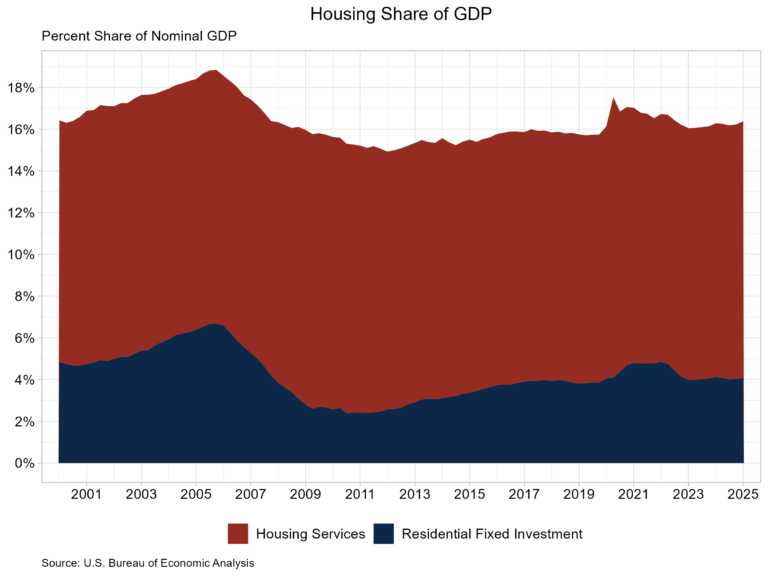
Housing’s share of the economy grew to 16.4% in the first quarter of 2025, according to the advance estimate of GDP produced by the Bureau of Economic Analysis. This is the highest reading since the third quarter of 2022 and is up 0.2 percentage points from the fourth quarter of 2024.

The more cyclical home building and remodeling component – residential fixed investment (RFI) – was 4.1% of GDP, up from 4.0% in the previous quarter. The second component – housing services – was 12.3% of GDP, up from 12.2% in the previous quarter. The graph below stacks the nominal shares for housing services and RFI, resulting in housing’s total share of the economy.

Housing service growth is much less volatile when compared to RFI due to the cyclical nature of RFI. Historically, RFI has averaged roughly 5% of GDP, while housing services have averaged between 12% and 13%, for a combined 17% to 18% of GDP. These shares tend to vary over the business cycle. However, the housing share of GDP lagged during the post-Great Recession period due to underbuilding, particularly for the single-family sector.

In the first quarter, RFI added 5 basis points to the headline GDP growth rate, marking the second straight quarter of positive contributions. RFI was 4.1% of the economy, recording a $1.216 trillion seasonally adjusted annual pace. Among the two segments of RFI, residential structures rose 1.2% while residential equipment rose 5.5%.

Breaking down the components of residential structures, single-family structure RFI grew 5.9%, while multifamily investment fell 11.5%. RFI for multifamily structures has contracted for seven consecutive quarters. Permanent site structure RFI, which is made up of single-family and multifamily RFI, grew 1.2%.  Other structures RFI rose 0.6% in the first quarter, down from 11.4% the previous period.

The second impact of housing on GDP is the measure of housing services. Similar to the RFI, housing services consumption can be broken out into two components. The first component, housing, includes gross rents paid by renters, owners’ imputed rent (an estimate of how much it would cost to rent owner-occupied units), rental value of farm dwellings, and group housing. The inclusion of owners’ imputed rent is necessary from a national income accounting approach, because without this measure, increases in homeownership would result in declines in GDP. The second component, household utilities, is composed of consumption expenditures on water supply, sanitation, electricity, and gas.

For the first quarter, housing services represented 12.4% of the economy or $3.691 trillion on a seasonally adjusted annual basis. Housing services expenditures grew 3.4% at an annual rate in the first quarter and contributed 41 basis points to GDP growth. Real personal consumption expenditures for housing grew 1.3%, while household utilities expenditures grew 18.7%. Real personal expenditures for natural gas services grew 53.1% in the first quarter, as residential consumption of natural gas recorded its highest monthly level since January 2014, at 1.035 trillion cubic feet in January 2025. Through the first two months of 2025, residential households consumed 1.833 trillion cubic feet of natural gas, higher than the 1.582 trillion in 2024 and 1.498 trillion in 2023.

Discover more from Eye On Housing

Subscribe to get the latest posts sent to your email.


This article was originally published by a eyeonhousing.org . Read the Original article here. .


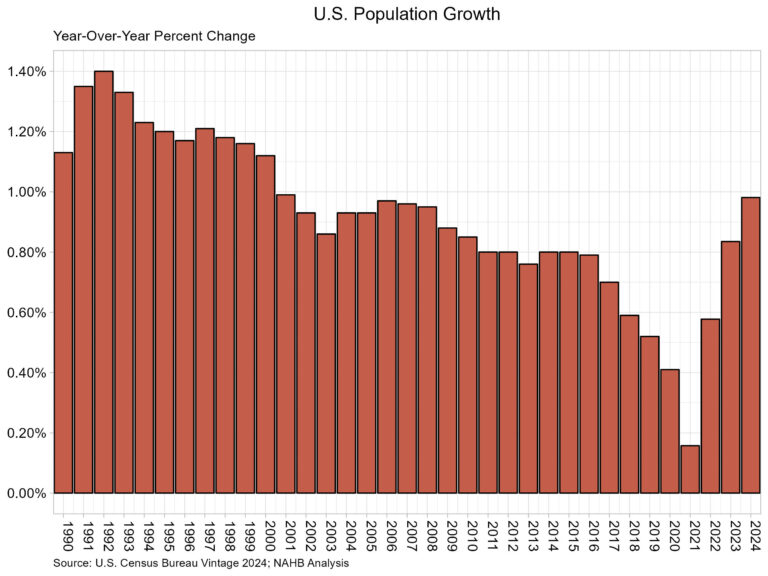
According to the U.S. Census Bureau’s latest estimates, the U.S. resident population grew by 3,304,757 to a total population of 340,110,988. The population grew at a rate of 0.98%, the highest rate since 0.99% in 2001. This also marked the third straight increase in the growth rate of the U.S. population. The vintage population estimates are released annually and represent the change in the U.S. population between July 1st of 2023 and 2024.

The Census Bureau reports that the primary source of population growth was net international migration (immigration), as international migration levels once again were higher than the previous year. The level of net international migration between 2023 and 2024 was 2,786,119. The second component of population growth is natural growth, which represents births minus deaths. Births totaled 3,605,563, down slightly from last year, while the number of deaths was reported at 3,086,925, also a decrease from last year. The natural growth, therefore, between 2023 and 2024 was 518,638.

Each region in the U.S. experienced population growth for the 2023-2024 period. The South led in population growth at 1.34% followed by the West at 0.85%. Meanwhile, the Midwest population grew 0.75%, while the Northeast grew the least at 0.59%.  

At the State level, 47 States and the District of Columbia had a population increase over the year. Of note, D.C. had the highest growth rate at 2.13%. Florida was second with population growth at 2.00% followed by Texas at 1.80%. Numerically, Texas experienced the largest population increase gaining 562,941. This was followed by Florida at 467,347 and California at 232,570.

Only three states lost population or remained level according to Census estimates. Vermont and West Virginia tied with a decline of 0.03%. Meanwhile Mississippi saw no population change.

California remained the most populous state by a healthy margin. California’s population was at 39,198,693, while the next most populous state was Texas at 31,290,831. To round out the top five States by total population the proceeding highest were Florida (23,372,215), New York (19,867,248), and Pennsylvania (13,078,751).

Discover more from Eye On Housing

Subscribe to get the latest posts sent to your email.


This article was originally published by a eyeonhousing.org . Read the Original article here. .
Pin It