Tag

Flat

Browsing


Single-family built-for-rent construction posted flat growth on a year-over-year basis, as a higher cost of financing crowded out development activity.

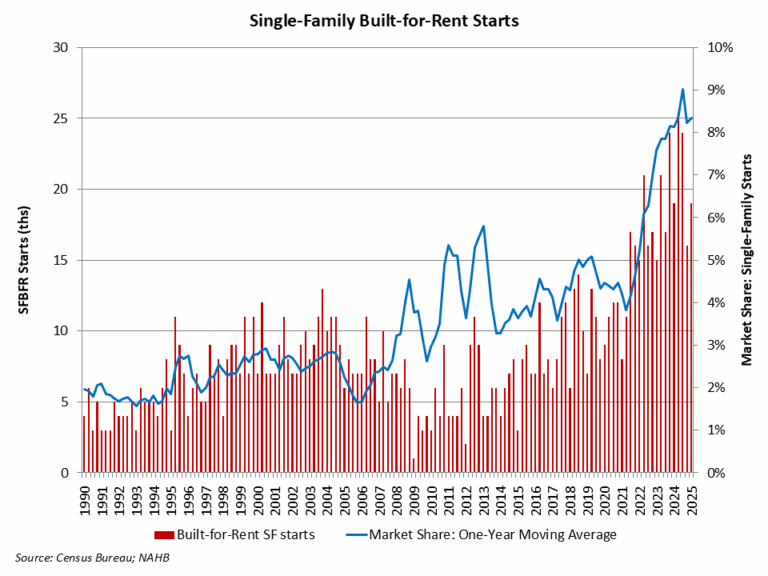
According to NAHB’s analysis of data from the Census Bureau’s Quarterly Starts and Completions by Purpose and Design, there were approximately 19,000 single-family built-for-rent (SFBFR) starts during the first quarter of 2025. This is flat relative to the first quarter of 2024. Over the last four quarters, 84,000 such homes began construction, which is a 4% increase compared to the 81,000 estimated SFBFR starts in the four quarters prior to that period.

The SFBFR market is a source of inventory amid challenges over housing affordability and downpayment requirements in the for-sale market, particularly during a period when a growing number of people want more space and a single-family structure. Single-family built-for-rent construction differs in terms of structural characteristics compared to other newly-built single-family homes, particularly with respect to home size. However, investor demand for single-family homes, both existing and new, has cooled with higher interest rates.

Given the relatively small size of this market segment, the quarter-to-quarter movements typically are not statistically significant. The current four-quarter moving average of market share (8%) is nonetheless higher than the historical average of 2.7% (1992-2012).

Importantly, as measured for this analysis, the estimates noted above include only homes built and held by the builder for rental purposes. The estimates exclude homes that are sold to another party for rental purposes, which NAHB estimates may represent another three to five percent of single-family starts based on industry surveys.

The Census data notes an elevated share of single-family homes built as condos (non-fee simple), with this share averaging more than 4% over recent quarters. Some, but certainly not all, of these homes will be used for rental purposes. Additionally, it is theoretically possible some single-family built-for-rent units are being counted in multifamily starts, as a form of “horizontal multifamily,” given these units are often built on a single plat of land. However, spot checks by NAHB with permitting offices indicate no evidence of this data issue occurring.

With the onset of the Great Recession and declines for the homeownership rate, the share of built-for-rent homes increased in the years after the recession. While the market share of SFBFR homes is small, it has clearly expanded. Given affordability challenges in the for-sale market, the SFBFR market will likely retain an elevated market share. However, in the near-term, SFBFR construction is likely to slow until the return on new deals improves.

Discover more from Eye On Housing

Subscribe to get the latest posts sent to your email.


This article was originally published by a eyeonhousing.org . Read the Original article here. .


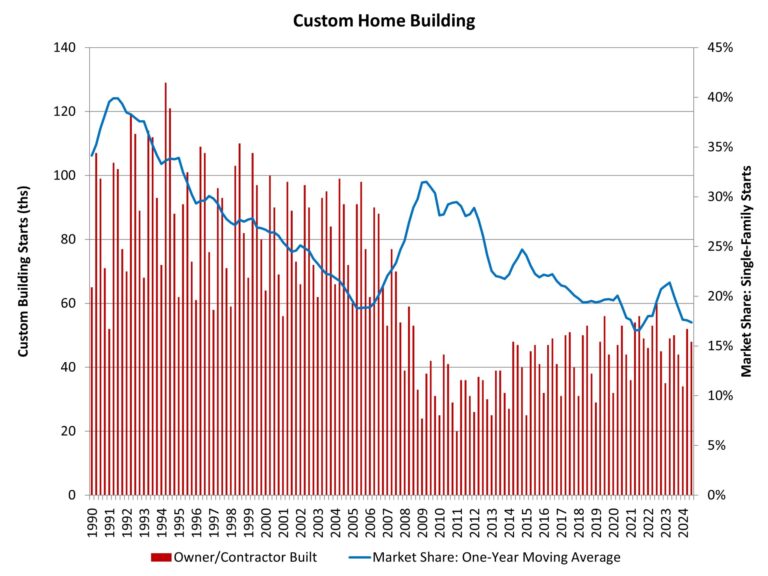
NAHB’s analysis of Census Data from the Quarterly Starts and Completions by Purpose and Design survey indicates flat year-over year growth for custom home builders. The custom building market is less sensitive to the interest rate cycle than other forms of home building but is more sensitive to changes in household wealth and stock prices.

There were 34,000 total custom building starts during the first quarter of 2025. This was unchanged relative to the first quarter of 2024. Over the last four quarters, custom housing starts totaled 181,000 homes, just more than a 2% increase compared to the prior four quarter total (177,000).

Currently, the market share of custom home building, based on a one-year moving average, is approximately 18% of total single-family starts. This is down from a prior cycle peak of 31.5% set during the second quarter of 2009 and the 21% recent peak rate at the beginning of 2023, after which spec home building gained market share.

Note that this definition of custom home building does not include homes intended for sale, so the analysis in this post uses a narrow definition of the sector. It represents home construction undertaken on a contract basis for which the builder does not hold tax basis in the structure during construction.

Discover more from Eye On Housing

Subscribe to get the latest posts sent to your email.


This article was originally published by a eyeonhousing.org . Read the Original article here. .

NAHB’s analysis of Census Data from the Quarterly Starts and Completions by Purpose and Design survey indicates relatively flat conditions for custom home builders after a period slight softening of market share due to declining mortgage interest rates. However, post-election stock market gains should support custom building at the end of 2024 and going into 2025.

There were 48,000 total custom building starts during the third quarter of 2024. This marks a 4% decline compared to the third quarter of 2023. Over the last four quarters, custom housing starts totaled 178,000 homes, just below a 1% decline compared to the prior four quarter total (179,000).

After share declines due to a rise in spec building in the wake of the pandemic, the market share for custom homes increased until 2023 and then entered a period of retrenchment. As measured on a one-year moving average, the market share of custom home building, in terms of total single-family starts, has fallen back to 17%. This is down from a prior cycle peak of 31.5% set during the second quarter of 2009 and a 21% local peak rate at the beginning of 2023.

Note that this definition of custom home building does not include homes intended for sale, so the analysis in this post uses a narrow definition of the sector. It represents home construction undertaken on a contract basis for which the builder does not hold tax basis in the structure during construction.

Discover more from Eye On Housing

Subscribe to get the latest posts sent to your email.


This article was originally published by a eyeonhousing.org . Read the Original article here. .

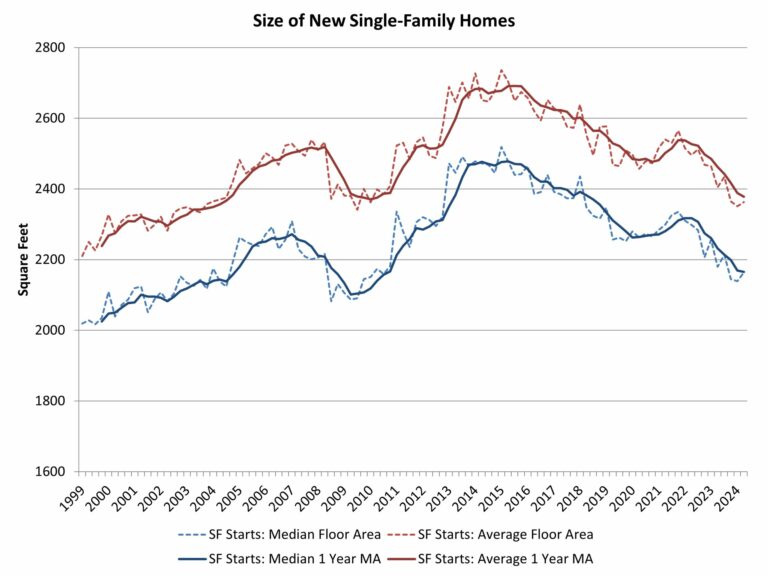
An expected impact of the virus crisis was a need for more residential space, as people use homes for more purposes including work. Home size correspondingly increased in 2021 as interest rates reached historic lows. However, as interest rates increased in 2022 and 2023, and housing affordability worsened, the demand for home size has trended lower.

According to second quarter 2024 data from the Census Quarterly Starts and Completions by Purpose and Design and NAHB analysis, median single-family square floor area edged up to 2,164 square feet, just off the lowest reading since the second half of 2009. Average (mean) square footage for new single-family homes registered at 2,363 square feet.

Since Great Recession lows (and on a one-year moving average basis), the average size of a new single-family home is now effectively flat at 2,387 square feet, while the median size is about 3% higher at 2,165 square feet.

Home size rose from 2009 to 2015 as entry-level new construction lost market share. Home size declined between 2016 and 2020 as more starter homes were developed. After a brief increase during the post-COVID building boom, home size trended lower due to declining affordability conditions. As interest rates decline, new home size could level off and increase in the quarters ahead.

Discover more from Eye On Housing

Subscribe to get the latest posts sent to your email.


This article was originally published by a eyeonhousing.org . Read the Original article here. .

Pin It