Tag

Finance

Browsing


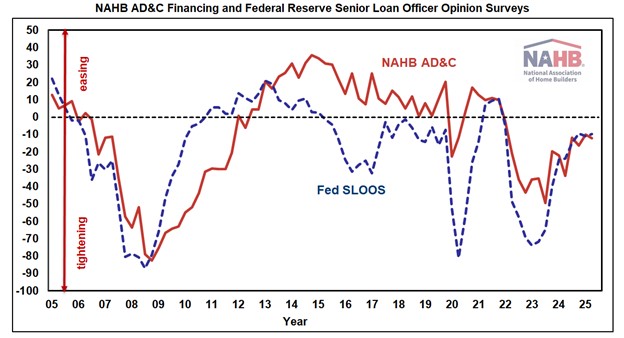
For the fourteenth consecutive quarter, builders and developers reported tighter credit conditions on loans for residential Land Acquisition, Development & Construction (AD&C) in NAHB’s quarterly survey on AD&C Financing.  

In the second quarter of 2025, the NAHB survey’s net easing index posted a reading of -12.3 (the negative number indicating that credit tightened since the previous quarter).  This is in reasonably close agreement with the second quarter reading of -9.7 for the similar net easing index derived from the Federal Reserve’s survey of senior loan officers.  Like the NAHB net easing index, the one from the Fed has been in negative territory (indicating credit tightening) for fourteen consecutive quarters.  Over the past year the additional tightening indicated by both indices has been relatively modest, with index levels hovering between -20 and 0.  Modest or not, however, after fourteen straight quarters of tightening, many builders are probably wondering how much room lenders have left to tighten further.    

More details from the Fed’s survey of lenders—including measures of demand and net easing for residential mortgages—appeared in a previous post.

According to NAHB builders, the most common ways lenders tightened credit on AD&C loans in the second quarter were by reducing the amount they are willing to lend (cited by 60% of the builders who reported tighter credit), requiring personal guarantees (53%), increasing the interest rate and not making new loans (47% each), and increasing documentation requirements (40%). 

Also in the second quarter, the cost of credit declined on loans made specifically for residential land acquisition (the “A” in AD&C).  The average contract interest rate on the loans declined from 8.23% to 7.82%, while the average initial points dropped from 0.71% to 0.56%.  As a result, the average effective interest rate (which takes both the contract rate and initial points into account) on land acquisition loans declined from 10.68% to 9.95%.

For the other three categories of AD&C loans tracked in the NAHB survey, credit became more expensive since the previous quarter.  The average contract interest rate increased on loans for land development (from 7.86% to 8.04%) and speculative single-family construction (from 8.08% to 8.17%), while declining only slightly (from 7.96% to 7.95%) on loans for pre-sold single-family construction.  Meanwhile, average initial points were unchanged at 0.74% on loans for land development, but increased from 0.68% to 0.72% on loans for speculative single-family construction, and from 0.45% to 0.58% on loans for pre-sold single-family construction.

Those combinations of quarter-to-quarter changes took the effective interest up from 11.50% to 11.77%  on loans for land development, from 12.59% to 12.82% on loans for speculative single-family construction, and from 12.49% to 12.73% on loans for pre-sold single-family construction.

Although the average effective interest rate was higher in 2025 Q2 than in 2025 Q1 for three of the four categories of AD&C loans, the rate was down year-over-year for all four. 

Financing costs for builders and developers could decline further over the next quarter, especially if (as NAHB expects) the Federal Reserve reduces the target federal funds rate at its September meeting.  In fact, as discussed in NAHB’s post on the Fed’s July meeting, a reduction in construction financing costs rather than an effect on mortgage rates is the main benefit builders can expect from easier monetary policy.

More detail on credit conditions for residential builders and developers is available on NAHB’s AD&C Financing Survey web page.

Discover more from Eye On Housing

Subscribe to get the latest posts sent to your email.


This article was originally published by a eyeonhousing.org . Read the Original article here. .

Overall consumer credit continued to rise in 2025, but the pace of growth remains slow. Student loan balances also rose year-over-year as borrowers resumed payments following the end of pandemic-era relief. Meanwhile, credit card and auto loan debt both experienced their slowest annual growth rates in years. Despite historically high interest rates, credit card and auto loan rates have eased slightly, providing some relief for consumers facing elevated borrowing costs.

Total outstanding U.S. consumer credit reached $5.05 trillion for the second quarter of 2025, according to the Federal Reserve’s G.19 Consumer Credit Report. This is an increase of 2.32% at a seasonally adjusted annual rate (SAAR) compared to the previous quarter, and a 2.09% increase compared to last year. Both rates have increased from last quarter.

Nonrevolving Credit

Nonrevolving credit, largely driven by student and auto loans (the G.19 report excludes mortgage loans), reached $3.76 trillion (SA) in the second quarter of 2025. This marks a 2.90% increase (SAAR) from the previous quarter, and a 1.94% increase from last year.

Student loan debt stood at $1.81 trillion (NSA) for the second quarter of 2025, marking a 4.16% increase from a year ago. The end of the COVID-19 Emergency Relief—which allowed 0% interest and halted payments until September 1, 2023—led year-over-year growth to decline for four consecutive quarters, from Q3 2023 through Q2 2024 as borrowers resumed payments and took on less new debt. The past four quarters have shown a return to growth, nearly matching pre-pandemic growth rates.

Auto loans reached a level of $1.56 trillion (NSA), showing a year-over-year increase of only 0.31%, marking the slowest growth rate since 2010. The deceleration in growth can be attributed to several factors, including stricter lending standards, elevated interest rates, and overall inflation. Auto loan rates for a 60-month new car stood at 7.67% (NSA) for the second quarter of 2025, a historically elevated level. However, auto rates have slowed modestly, decreasing by 0.53 percentage points compared to a year ago.

Revolving Credit

Revolving credit, primarily made up of credit card debt, rose to $1.30 trillion (SA) in the second quarter of 2025. This represents a 0.66% increase (SAAR) from the previous quarter and a 2.54% increase year-over-year. Both measures reflect a notable slowdown, marking the weakest growth in revolving credit in several years. This deceleration comes as credit card interest rates remain elevated, with the average rate held by commercial banks (NSA) at 21.16%. Although rates have hovered near historic hi­ghs since Q4 2022, the past two quarters have shown modest year-over-year declines, reflecting the impact of rate cuts that began in 2024.

Discover more from Eye On Housing

Subscribe to get the latest posts sent to your email.


This article was originally published by a eyeonhousing.org . Read the Original article here. .


In the second quarter of 2025, overall demand for residential mortgages was weaker, while lending standards for most types of residential mortgages were essentially unchanged, according to the recent release of the Senior Loan Officer Opinion Survey (SLOOS).  For commercial real estate (CRE) loans, lending standards for construction & development were modestly tighter, while demand was moderately weaker. However, for multifamily loans within the CRE category, lending conditions and demand were essentially unchanged for the third consecutive quarter. 

Last week, the Federal Reserve left its monetary policy stance (i.e., Federal Funds rate) unchanged for the fifth consecutive meeting, with Chairman Jerome Powell indicating in his statement that the Fed “is attentive to the risks to both sides of its dual mandate [maximum employment and inflation at the rate of 2%]” and the “uncertainty about the economic outlook remains elevated”.  NAHB is still forecasting two interest rate cuts before the end of 2025.

Residential Mortgages

In the second quarter of 2025, five of seven residential mortgage loan categories saw a neutral net easing index (i.e., 0) for lending conditions.  Only Qualified Mortgage (QM) non-jumbo non-GSE eligible loans experienced easing, as evidenced by a positive value (+1.8). Meanwhile, the only loans to experience tightening were non-QM non-jumbo loans at -2.0.  Nevertheless, based on the Federal Reserve classification of any reading between -5 and +5 as “essentially unchanged,” all seven categories fell within this range.

All residential mortgage loan categories reported at least modestly weaker demand in the second quarter of 2025, except for QM-jumbo which was essentially unchanged for the second consecutive quarter.  Most notably, non-QM non-jumbo (-22.0%) and subprime (-20.0%) loans experienced significantly weaker demand during the quarter.  The net percentage of banks reporting stronger demand for most of the residential mortgage loan categories has been negative for at least four years.

Commercial Real Estate (CRE) Loans

Across CRE loan categories, construction & development loans recorded a net easing index of -9.7 for the second quarter of 2025, indicating modestly tighter credit conditions.  For multifamily loans, the net easing index was -4.8, or essentially unchanged.  Both categories of CRE loans show tightening of lending conditions (i.e., net easing indexes below zero) since Q2 2022.  However, the tightening has become less defined recently for multifamily, with its net easing index essentially unchanged (i.e., between -5.0 and +5.0) for three consecutive quarters.

The net percentage of banks reporting stronger demand was -11.3% for construction & development loans and -3.2% for multifamily loans, with negative numbers indicating weakening demand.  Like the trend for lending conditions, demand for multifamily loans has experienced unchanged conditions (i.e., between -5.0% and +5.0%) for three straight quarters.

Discover more from Eye On Housing

Subscribe to get the latest posts sent to your email.


This article was originally published by a eyeonhousing.org . Read the Original article here. .


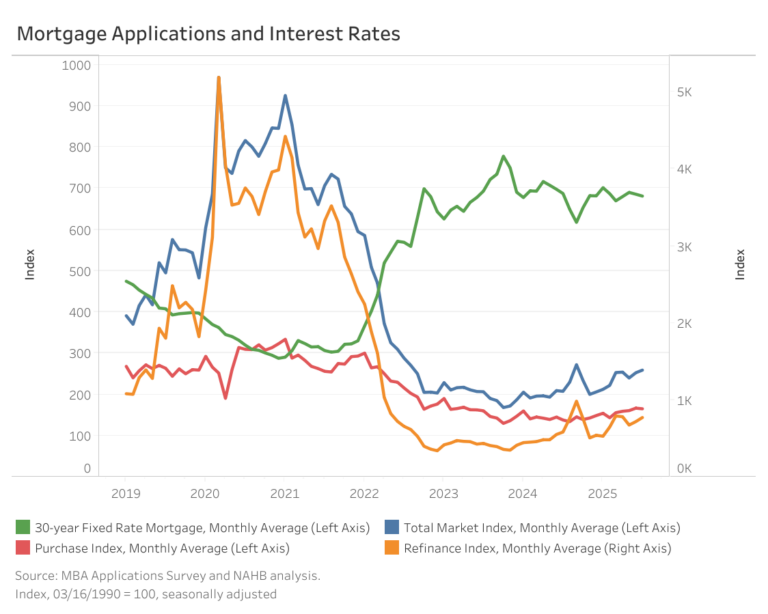
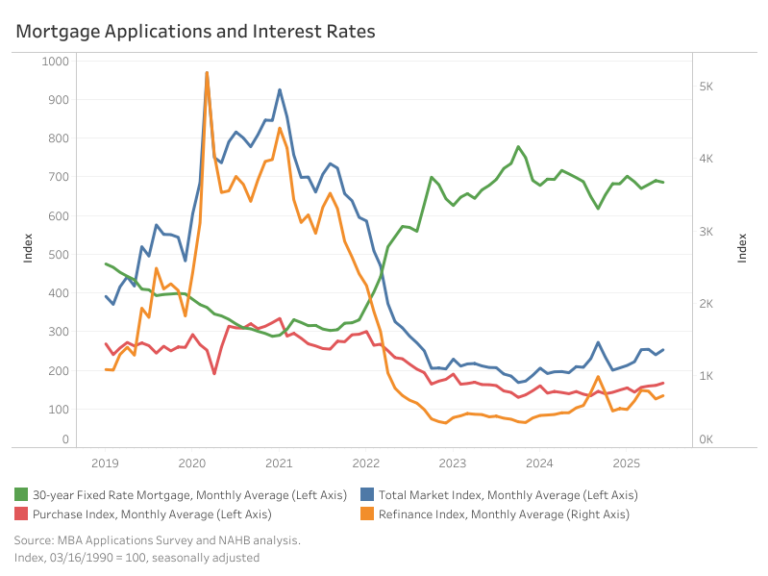
Mortgage application activity picked up in July as interest rates eased modestly. The Mortgage Bankers Association’s (MBA) Market Composite Index, which tracks mortgage application volume, rose 2.4% from June on a seasonally adjusted basis. Compared to July 2024, total applications were up 24.5%.

The average contract rate for 30-year fixed mortgages edged down by 4 basis points to 6.8%. While refinancing increased by 7.4%, purchase applications slipped 1.2% as high home prices and mortgage rates continued to keep homebuyers on the sideline. Year-over-year, the 30-year rate was 6 basis points lower, with purchase and refinance applications up 19.6% and 32.2%, respectively.

Loan sizes continued to trend downward for the third consecutive month. The average loan amount across all loan types declined 1.7% to $376,500. Purchase loan sizes fell 2.5% to $428,800, while refinance loans increased 3.0% to $299,300. Adjustable-rate mortgage (ARM) loan sizes saw the largest decline among all loan types, falling 6.6% to $957,500 from $1.03 million.   

Discover more from Eye On Housing

Subscribe to get the latest posts sent to your email.


This article was originally published by a eyeonhousing.org . Read the Original article here. .

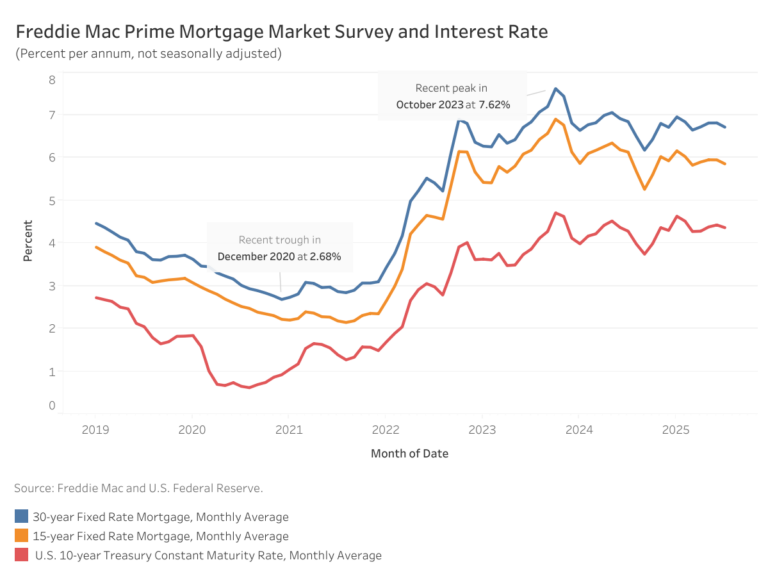
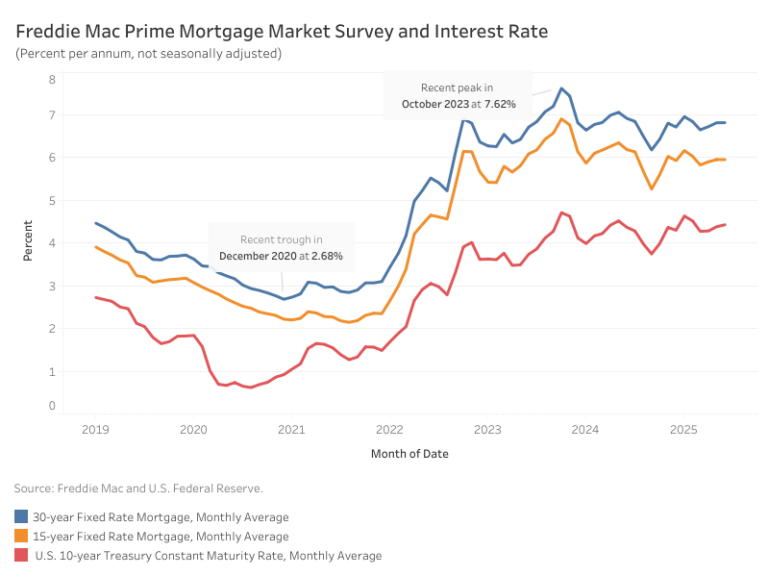
Average mortgage rates dipped in July, according to Freddie Mac. The average 30-year fixed-rate mortgage was 6.72%, 10 basis points (bps) lower than June. Meanwhile, the 15-year rate declined 9 bps to average at 5.86%. Compared to a year ago, the 30-year rate is down 13 basis points (bps), and the 15-year rate is 28 bps lower.

The 10-year Treasury yield, a key benchmark for long-term borrowing, averaged 4.37% in July – a 6 bps decline from the previous month. Yields began the month lower but reversed course and rose steadily as investor expectations solidified that the Federal Reserve would maintain its current policy stance. These expectations were driven by economic data showing an uptick in inflation while the economy and labor market remained solid.

On July 30, the Federal Open Market Committee (FOMC) solidified market expectations by voting to keep the federal funds rate unchanged at 4.25% to 4.50%. However, just days later, the July employment report released by the Bureau of Labor Statistics on Friday, August 1, showed downward revisions to job gains in May and June. In response, yields fell to around 4.2% as investors perceived an increased likelihood of a rate cut at the Fed’s next meeting in September.

Discover more from Eye On Housing

Subscribe to get the latest posts sent to your email.


This article was originally published by a eyeonhousing.org . Read the Original article here. .

Personal income increased by 0.3% in June, following a 0.4% dip in May, according to the latest data from the Bureau of Economic Analysis. The gains in personal income were largely driven by higher wages and social benefits. However, the pace of personal income growth slowed from its peak monthly gain of 1.4% in January 2024.  

Real disposable income, the amount remaining after adjusted for taxes and inflation, was unchanged in June, following a 0.7% decline in May. On a year-over-year basis, real (inflation-adjusted) disposable income rose 1.7%, down from a 6.5% year-over-year peak recorded in June 2023.  

Spending also showed signs of softening. Personal consumption expenditures rose 0.3% in June, after staying flat in May. Real spending, adjusted to remove inflation, increased 0.1% in June, with expenditures on goods climbing 0.1% and spending on services up 0.1%.


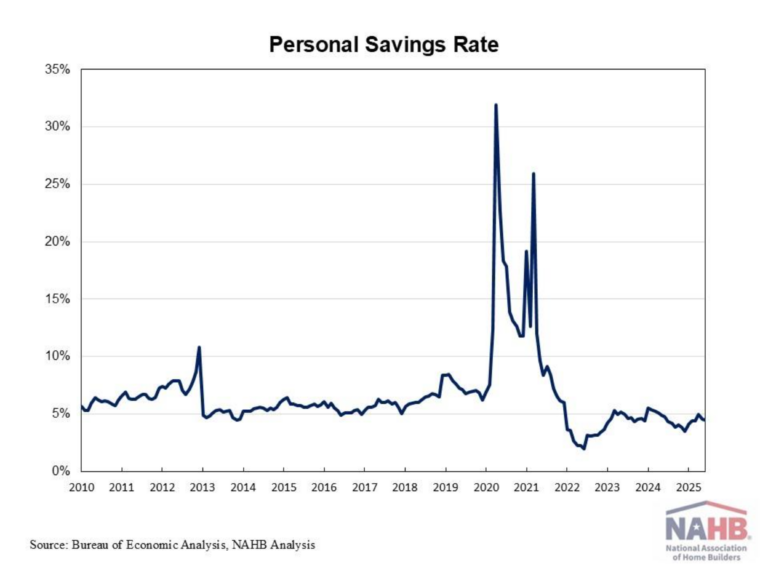
With income growth outpacing spending, the personal savings rate increased to 4.5% in June. But with inflation eroding compensation gains, people are dipping into savings to support spending. This trend will ultimately lead to a slowing of consumer spending. 

Discover more from Eye On Housing

Subscribe to get the latest posts sent to your email.


This article was originally published by a eyeonhousing.org . Read the Original article here. .

Mortgage application activity picked up in June, supported by a slight decline in interest rates. The Mortgage Bankers Association’s (MBA) Market Composite Index, which tracks mortgage application volume, rose 5.4% from May on a seasonally adjusted basis. Compared to June 2024, total applications were up 21.1%.

The average contract rate for 30-year fixed mortgages edged down by 4 basis points to 6.86%. In response, purchase applications increased 3.7% month-over-month, while refinance activity climbed 6.5%. On a year-over-year basis, the 30-year rate was 12 basis points lower, with purchase and refinance applications up 15.2% and 30.3%, respectively.

Loan sizes continued to trend lower. The average loan amount across all loan types declined 2% to $383,000. Purchase loans edged down 0.9% to $439,800, and refinance loans decreased 1.8% to $290,500. Adjustable-rate mortgage (ARM) loan sizes dropped 3.1% to $1.03 million. 

Discover more from Eye On Housing

Subscribe to get the latest posts sent to your email.


This article was originally published by a eyeonhousing.org . Read the Original article here. .

In the first quarter of 2025, state and local governments experienced an increase in property tax revenue growth. On a seasonally adjusted basis, state and local government property tax revenue grew 1.1% over the quarter, according to the Census Bureau’s quarterly summary of state and local tax revenue. Meanwhile, total tax revenue for state and local governments grew 1.3% over the quarter, with corporate income tax revenue up 6.6%, sales tax revenue up 0.9% and individual income tax revenue up 0.2%.

Property tax revenue stood at $203.4 billion in the first quarter, a slight increase from $201.1 billion in the fourth quarter. While this does show growth over the quarter, growth has notably slowed over the past year. The quarterly growth in the first quarter of 2024 was almost double (2.1%) the current rate. On a year-over-year basis, property tax revenue was 5.2% higher, up from $193.3 billion.

Property taxes typically make up the largest share of the total tax revenue for state and local governments, accounting for over one-third at 37.8% in the first quarter. The second highest revenue source was sales tax at 27.7%, totaling $148.9 billion, followed closely by individual income tax at 26.1% ($140.5 billion). Corporate income tax rounded out the remaining 8.4% at $45.4 billion.

Discover more from Eye On Housing

Subscribe to get the latest posts sent to your email.


This article was originally published by a eyeonhousing.org . Read the Original article here. .


Average mortgage rates were flat in June, according to Freddie Mac. The average 30-year fixed-rate mortgage held at 6.82%, while the 15-year stayed at 5.95%. Compared to a year ago, the 30-year rate is down 10 basis points (bps), and the 15-year rate is 24 bps lower.

The 10-year Treasury yield, a benchmark for long-term borrowing, averaged 4.43% in June – a marginal increase of 5 bps from the previous month. However, the most recent weekly yield saw a small decrease following Federal Reserve Chair Jerome Powell’s congressional testimony, where he noted the possibility of a rate cut being “sooner rather than later” if inflation remains contained. Nonetheless, he reiterated the Fed’s “wait and see” stance, citing ongoing uncertainty around how changes in trade, immigration, fiscal, and regulatory policies will affect the economy.

Last week, the Federal Open Market Committee (FOMC) continued its pause on rate cuts, keeping the federal funds rate unchanged at 4.25% to 4.5%. The updated dot plot continues to signal a cumulative rate cut of 50 bps by the end of 2025. However, the latest Summary of Economic Projections revised the median 2025 GDP forecast down from 1.7% to 1.4%. Forecasts for unemployment (4.4% to 4.5%), PCE inflation (2.7% to 3.0%), and core PCE inflation (2.8% to 3.1%) were all revised upward.

Discover more from Eye On Housing

Subscribe to get the latest posts sent to your email.


This article was originally published by a eyeonhousing.org . Read the Original article here. .

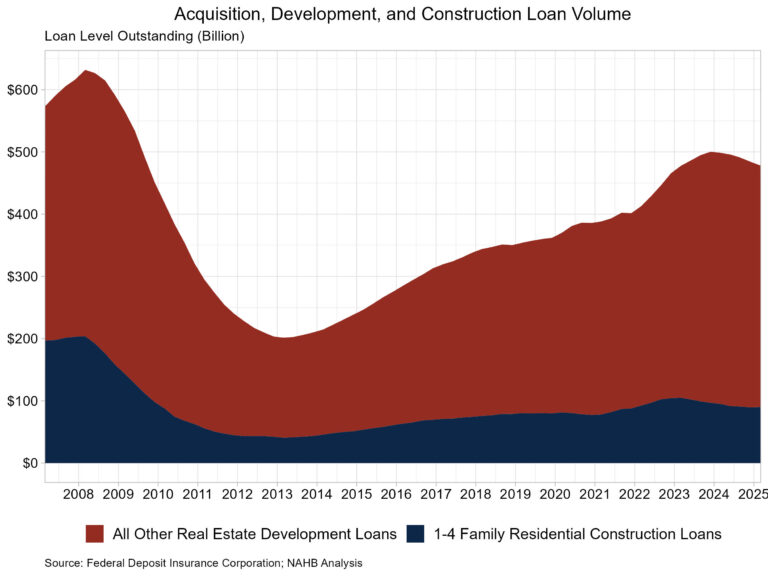
Credit conditions for builders and developers eased in the first quarter of 2025 as the level of outstanding 1-4 family residential construction loans rose for the first time in two years, according to data released by FDIC. While the volume of 1-4 family residential construction loans rose, a drop in other real estate development loans offset the increase, resulting in the fifth straight quarterly decline in the total volume of outstanding acquisition, development, and construction loans.

In the first quarter of 2025, the total level of outstanding acquisition, development, and construction loans fell to $478.3 billion, down 4.1% from a year ago. This was driven by the drop in other real estate development loans, which fell to $388.2 billion, down 3.8% compared to the a year ago. The volume of 1-4 family residential construction and land development loans totaled $90.0 billion in the first quarter, down 5.2% from a year ago. On a quarterly basis, this volume is up 0.6% from $89.5 billion one quarter ago.

It is worth noting, the FDIC data represent only the stock of loans, not changes in the underlying flows, so it is an imperfect data source. Nonetheless, lending remains much reduced from years past. The current amount of existing 1-4 family residential AD&C loans now stands 56% lower than the peak level of residential construction lending of $204 billion reached during the first quarter of 2008. Alternative sources of financing, including equity partners, have supplemented this capital market in recent years.

Quality Metrics of Construction Loans

Along with the volume increase of 1-4 family residential construction loans, the share of the volume that is 30+ days past due or nonaccrual status grew in the first quarter. The total level of past due and nonaccrual loans was $1.2 billion, up 24.4% from $978.4 million a year ago. As a share of the total 1-4 family residential construction loan volume, this accounts for only 1.4% but is notably the highest share since 2015.

Discover more from Eye On Housing

Subscribe to get the latest posts sent to your email.


This article was originally published by a eyeonhousing.org . Read the Original article here. .
Pin It