This article was originally published by a www.houzz.com . Read the Original article here. .

This article was originally published by a www.houzz.com . Read the Original article here. .
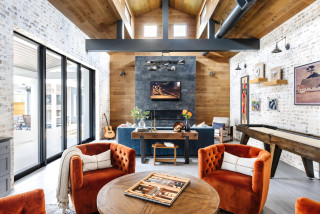
“I don’t want it to be beige, I want it to be fun!” That was the first direction the client gave interior designer Bonnie Bagley Catlin for the renovation of a family basement in Parker, Colorado. This meant bringing in color, texture, comfortable furniture and, perhaps most importantly, an inviting bar for entertaining. The homeowners, a couple with several kids who were away at college, had recently relocated from Texas. They knew they’d be renovating a good portion of their home. It was clear that the daylight basement would be the most popular spot for the whole family to gather when the kids were home from school, so it was renovated as part of phase one.
Basement at a Glance
Who lives here: A couple of empty nesters
Location: Parker, Colorado
Size: 550 square feet (51 square meters)
Designer: Bonnie Bagley Catlin of Signature Designs Kitchen | Bath | Interiors
Contractor: Jim Ince of All About Bathrooms
Before: “I love working with clients who have relocated here,” Bagley Catlin says. Having moved to the Colorado Rockies from Southern California three years ago herself, she has a keen understanding of what it’s like for newbies who may feel like a fish out of water. This is helpful toward establishing trust early on in the design process.
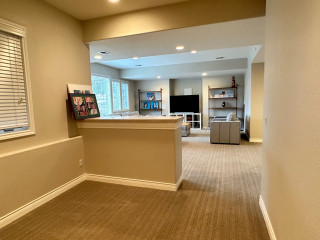
“This room was an empty box,” Bagley Catlin says. The project contractor had no idea what the half wall might contain and wanted nothing to do with trying to remove it. Instead, Bagley Catlin designed around it. One other existing detail to note is the white panel behind the TV. This is the main water shutoff for the house, and it was important to keep it accessible.
Find an interior designer on Houzz
“Once I saw the counter installed, I knew we could not leave the bar’s base as drywall because it looked so unfinished,” Bagley Catlin says. “So I suggested we wrap it in fluted walnut paneling.” Local company Blacksheep Woodwork crafted both the walnut counter and paneling.
Shop for a sofa
Before: The bar area was a blank slate. It had a nice-size window for a basement that let in natural light.
Blacksheep Woodwork also crafted the bar’s live-edge walnut shelves and routed channels in the bottoms of them for LED rope lights. The lights wash down the backsplash wall and illuminate the countertop.
Find a local carpenter on Houzz
This countertop is a durable quartz from Pental. Its gray coloring takes a back seat to the star of the room, the green backsplash tile.
Backsplash tile: Eliot Brazil crackle tile, Encore Ceramics
“We really maxed out the functionality of this bar,” Bagley Catlin says. There’s a beverage fridge, a wine fridge, a panel-front ice maker and a bar sink. For storage, there’s a mix of glass-front and solid cabinet storage, as well as open shelves for display.
Flooring: Prominence Plus Ash Oak, Shaw Floors
Browse bar and counter stools in the Houzz Shop
Wanting to bring the fun of the backsplash over to the bar seating, the homeowners chose to add a green epoxy to the walnut countertop.
“I suggested the vertically oriented grid composition for the backsplash to give it a different dimension from the usual,” Bagley Catlin says. “I also suggested we go with a medium grout rather than a dark one to really set the tile off in contrast.”
“The green color and the dark cabinets on the bar side across the room are so intense that I knew we needed a color punch on the built-in wall,” she says. Sherwin-Williams’ Still Water anchors this side of the room in a deep blue.
Wall color: Natural Tan, Sherwin-Williams; trim color: Simply White, Benjamin Moore
The couple chose and sourced the upholstered furniture and the rug themselves. “They wanted a place for the whole family to hang out and be comfy,” Bagley Catlin says. “I added custom pillows to elevate the look.” The throw pillows and blankets zhuzh the seating up, add punches of color with earth tones mixed in, and bring in a Colorado mountain (faux) furry feeling.
This article was originally published by a www.houzz.com . Read the Original article here. .
![]()
In addition, Zalewski added trees and shrubs for privacy and beauty, and redesigned the side yard. He kept easy maintenance at the front of his mind throughout the process. He also considered the master plan he’d drafted for the entire property. Later phases will include adding an outdoor kitchen and reworking the front yard.
This article was originally published by a www.houzz.com . Read the Original article here. .

The homeownership rate for multigenerational households increased by 4.9 percentage points (pp) over the last decade, but there’s another household type that experienced an even larger increase in the homeownership rate over the same period—single parent households.
In further analysis of the Census’s American Community Survey (ACS) data, NAHB dives deeper into the homeownership rate for other family household types: married couples with no children, married couples with children and single parent households. In 2022, most family households were married with no children (44%), followed by married with children (26%), single parents (12%), others (12%), and multigenerational families (6%). This composition has not changed much, with the exception of a gradual decrease in the share of married with children and single parent households, which is offset by an increase in the share of married with no children households.
The homeownership rate for single parent households saw the largest gains in homeownership rate with an increase of 5.7 percentage points over the decade. However, the overall level of homeownership rate for single parent households remains the lowest among all other family household types at just 41%. Another group that saw a large increase was the married couple with children households, with a 4.5% increase over the decade from 73% to 78%. Like multigenerational households, these increases were spurred on by historically low mortgage rates in 2021.
The only household type to have plateaued was married without children. As a matter of fact, these households saw decreasing homeownership rates for a few years before creeping back up to be at roughly the same rate as they were ten years ago at 84%. Nonetheless, married without children households remain as the group with the highest homeownership rate with an average rate of 84% over the decade.
We also examined the estimated home price-to-income ratio (HPI) for various household types. To calculate the home prices for recent homebuyers we used the median property value for owners who moved into their property within the past year. Here is where we see the effect of how multigenerational households were able to lower their HPI with pooled income and budgets. In contrast are single parent households with their estimated home prices approaching five times their income, indicating that these households are significantly burdened by housing costs.
Given that homeownership rates jumped in recent years for most household types despite increases in home prices suggests that the low mortgage rates in 2021 made steep home prices more palatable for homebuyers to enter the market. However, it is unlikely that we’ll see a continued increase in homeownership while mortgage rates remain elevated.
Discover more from Eye On Housing
Subscribe to get the latest posts sent to your email.
This article was originally published by a eyeonhousing.org . Read the Original article here. .

Despite high mortgage rates, the lack of resale homes and pent-up demand drove solid growth in single-family permits across nearly all regions in the second quarter. In contrast, multifamily construction permit activity experienced declines across all regions for the second quarter of 2024. These trends are tabulated from the recent release of the National Association of Home Builders’ (NAHB) Home Building Geography Index (HBGI).
Single-Family
All markets for single-family construction saw higher growth in the second quarter compared to the first quarter. In contrast to the second quarter of 2023, which experienced declines across all markets, this year shows a clear reversal. Large metro core counties had the largest growth rate for the second consecutive quarter at 17.6%, while micro counties continued to have the lowest for the third straight quarter, at 3.4%.
Looking at single-family HBGI market shares, small metro core counties continued to have the largest market share at 28.9%. Large metro suburban counties are the only other market with over 20% market share, at 25.0% in the second quarter. The smallest market share continued to be non metro/micro counties at 4.3%. However, this market remains almost a percentage point higher than what it was pre-pandemic in 2019.
Multifamily
In the multifamily sector, the HBGI year-over-year growth continued to post declines for all markets in the second quarter. This can be contributed to high levels of multifamily units under construction and tighter financial conditions. Only two markets had larger declines than the first quarter, with large metro suburban counties down 21.1% and non metro/micro counties down 14.8%. Notably, non metro/micro counties were the last market to experience a decline in multifamily construction. These counties were an area of growth in the second, third and fourth quarters of last year while all other markets experience declines or negligible growth.
Multifamily market shares in the HBGI remained similar to the first quarter, with large metro core counties having the largest market share at 40.1%. The smallest market was non metro/micro counties, with a 1.1% market share.
The second quarter of 2024 HBGI data along with an interactive HBGI map can be found at http://nahb.org/hbgi.
Discover more from Eye On Housing
Subscribe to get the latest posts sent to your email.
This article was originally published by a eyeonhousing.org . Read the Original article here. .

“Their work is very stressful and they were having their first baby. The goal here was zen,” Glaister says. This meant an uncluttered, clean-lined look, an organic feel and warm contemporary style. It also meant laying out the house for the way they lived. The importance of the kitchen to the couple was the biggest influence on the way Glaister reconfigured the first floor. It would truly serve as the heart of their new home.
This article was originally published by a www.houzz.com . Read the Original article here. .

Designer tip. “Coating the walls, ceiling, and trim in a single paint color creates a cohesive, moody atmosphere while allowing key elements and finishes to take center stage,” Jensen says. “This unified approach adds depth and prevents the space from feeling overly busy or disjointed, with accent finishes providing just the right amount of contrast.”
New to home remodeling? Learn the basics