Tag

Existing

Browsing


The U.S. housing market showed mixed but generally improving conditions in March, as new home sales strengthened and price pressures continued to ease. While inventory dynamics varied across segments, moderating home prices and increased availability at the lower end of the market provided some relief to buyers navigating ongoing affordability challenges.

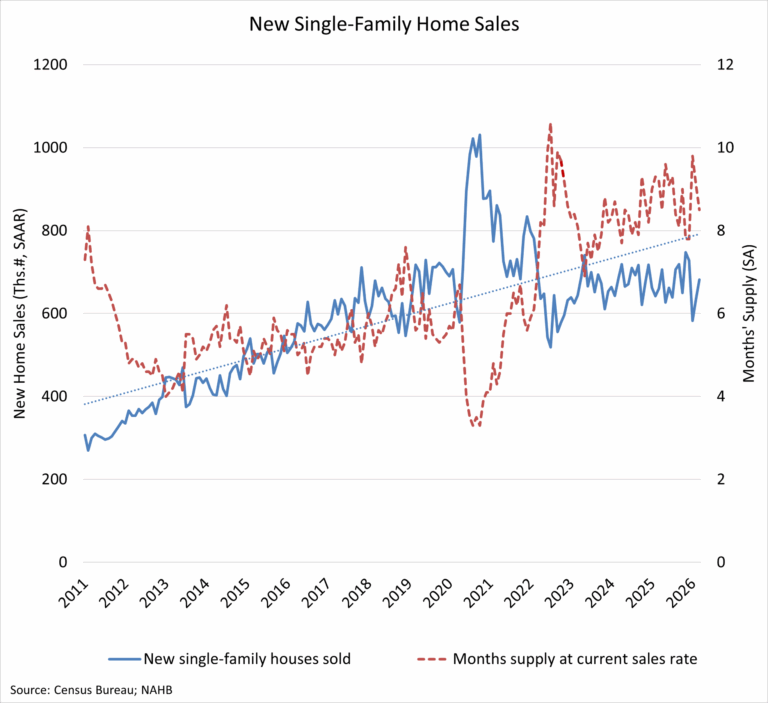
Sales of newly built single-family homes increased 7.4% month-over-month in March to a seasonally adjusted annual rate of 682,000 units, according to the U.S. Department of Housing and Urban Development and the U.S. Census Bureau. This represented a 3.3% increase compared to a year earlier. A new home sale is recorded when a contract is signed, or a deposit is accepted, regardless of the stage of construction. The seasonally adjusted annual rate reflects the pace of sales that would occur over a 12-month period if current conditions persist.

New single-family home inventory totaled 481,000 units in March, down 0.4% from the prior month and 4.6% from a year earlier. At the current sales pace, the months’ supply of new homes stood at 8.5 months, down from 9.2 months one year ago, though still above the six-month level generally considered to indicate a balanced market.

Combined new and existing home inventory has edged higher in recent months, with the total months’ supply reaching 4.8 months. Meanwhile, inventory conditions in the existing home market have retreated after showing gradual improvement in prior months. Moderating prices across both markets have helped support buyer demand amid ongoing affordability concerns.

At the end of March, there were 119,000 completed, ready-to-occupy homes available for sale on a non-seasonally adjusted basis, up 5.3% from a year earlier. Completed homes accounted for one-quarter of total inventory, while homes under construction made up 51%. The remaining 24% of homes sold in March had not yet started construction at the time the sales contract was signed.

Home prices showed further signs of cooling at the start of 2026. The median new home sale price was $387,400, down 6.2% from a year ago, and 9.7% below the recent peak of $429,100 reached in December 2025. Affordability improved at the lower end of the market, with 20 percent of new homes priced below $300,000. Over a quarter (28%) of homes were priced above $500,000, while the remaining share fell within the $300,000 to $500,000 range.

Regionally, year-over-year new home sales increased 8.0% in the Midwest, reflecting ongoing strength in residential construction across the Midwestern states. New home sales declined 17.6% in the Northeast, 14.0% in the West and 2.6% in the South.


This article was originally published by a eyeonhousing.org . Read the Original article here. .


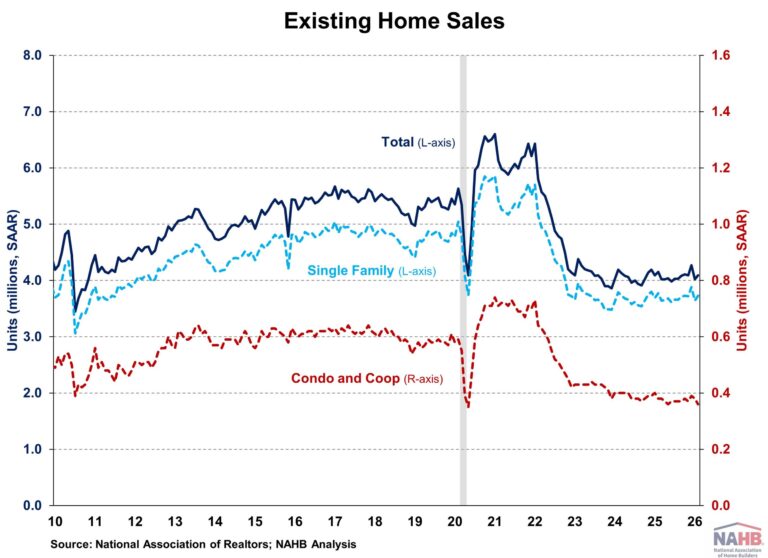
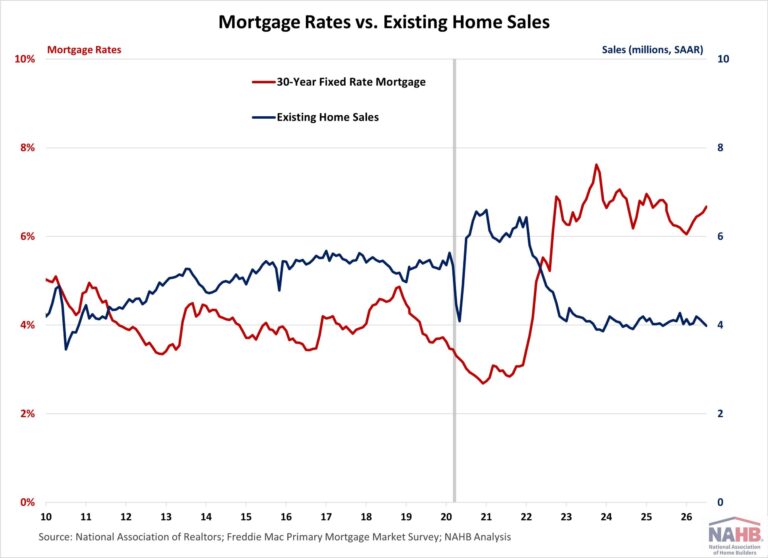
Existing home sales fell to a nine-month low in March as tight inventory, rising mortgage rates and growing concerns about the job market constrained sales activity. While inventory has improved in recent months, it remains below historical norms, continuing to push home prices higher as demand outpaces supply. Meanwhile, the Iran war has reversed the downward trend in mortgage rates, which jumped from 5.98% before the conflict to 6.37% last week. These headwinds will likely dampen home sales while tight inventory continues to drive home prices higher, further worsening housing affordability.

Total existing home sales, including single-family homes, townhomes, condominiums, and co-ops, fell 3.6% to a seasonally adjusted annual rate of 3.98 million in March, the lowest level since June 2025, according to the National Association of Realtors (NAR). On a year-over-year basis, sales were 1.0% lower than a year ago.

The existing home inventory level was 1.4 million units in March, up 3.0% from February and 2.3% from a year ago. At the current sales rate, March unsold inventory sits at a 4.1-months’ supply, up from 3.8-months in February and 4.0-months a year ago. Inventory between 4.5 to 6 months’ supply is generally considered a balanced market.

Homes stayed on the market for a median of 41 days in March, down from 47 days in the previous month and 36 days in March 2025.

The first-time buyer share was 32% in March, down from 34% in February and unchanged from a year ago.

The March all-cash sales share was 27% of transactions, down from 31% in February but up slightly from 26% a year ago. All-cash buyers are less affected by changes in interest rates.

The March median sales price of all existing homes was $408,800, up 1.4% from last year. This marks the 33rd consecutive month of year-over-year increases. The median condominium/co-op price in March was up 2.3% from a year ago at $371,500. Recent gains for home inventory will put downward pressure on resale home prices in most markets in 2026.

All four major regions saw sales declines in March, ranging from 1.3% in the West to 8.5% in the Northeast. On a year-over-year basis, sales rose in the West (+1.3%) and South (+2.2%), while sales in the Midwest and Northeast declined (-3.2% and 12.2% respectively).

The Pending Home Sales Index (PHSI) is a forward-looking indicator based on signed contracts. The PHSI rose from 70.8 to 72.1 in February due to improved affordability. On a year-over-year basis, pending sales were 0.8% lower than a year ago, according to the National Association of Realtors’ data. However, resurgence in mortgage rates driven by the Iran war could reverse the increase.


This article was originally published by a eyeonhousing.org . Read the Original article here. .


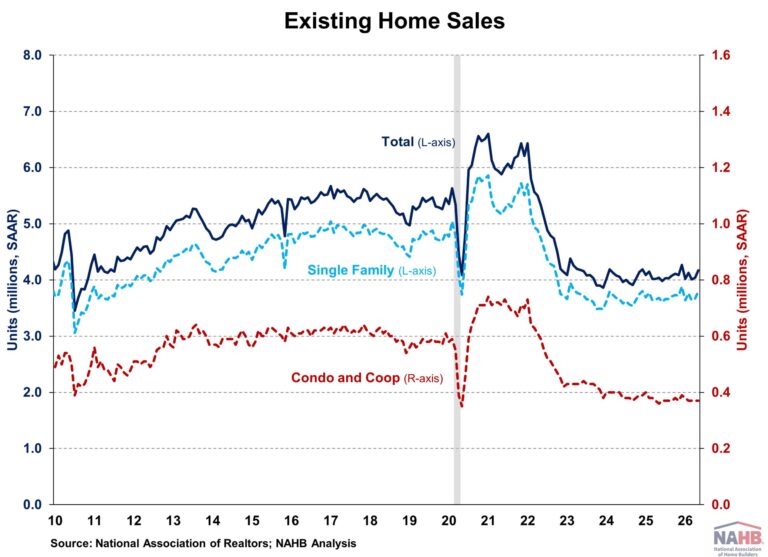
Following the sharp decline last month, existing home sales bounced back in February as housing affordability improved. Lower mortgage rates and moderating home price growth helped pull buyers back to the market. However, tight inventory will likely continue to push home prices higher if demand outpaces supply growth.

Total existing home sales, including single-family homes, townhomes, condominiums, and co-ops, rose 1.7% to a seasonally adjusted annual rate of 4.09 million in February, according to the National Association of Realtors (NAR). On a year-over-year basis, sales were 1.4% lower than a year ago.

The existing home inventory level was 1.3 million units in February, up 2.4% from January and 4.9% from a year ago. At the current sales rate, February unsold inventory sits at a 3.8-months’ supply, unchanged from last month but up from 3.6-months in February. Inventory between 4.5 to 6 months’ supply is generally considered a balanced market.

Homes stayed on the market for a median of 47 days in February, up from 46 days in the previous month and 42 days in February 2025.

The first-time buyer share was 34% in February, up from 31% in January and one year ago.

The February all-cash sales share was 31% of transactions, up from 27% in January but down from 32% a year ago. All-cash buyers are less affected by changes in interest rates.

The February median sales price of all existing homes was $398,000, up 0.3% from last year. This marks the 32nd consecutive month of year-over-year increases. However, the year-over-year growth has moderated since peaking in December 2024, suggesting that price appreciation may continue to slow. The median condominium/co-op price in February was up 0.9% from a year ago at $358,100. Recent gains for home inventory will put downward pressure on resale home prices in most markets in 2026.

Three of the four major regions saw sales increases in February, ranging from 1.1% in the Midwest to 8.2% in the West. Sales in the Northeast fell 6.0%. On a year-over-year basis, sales rose only in the South (+0.5%), while sales in the West, Midwest, and Northeast all declined (-1.3%, -4.1%, and -4.1%, respectively). 

The Pending Home Sales Index (PHSI) is a forward-looking indicator based on signed contracts. The PHSI fell from 71.5 to 70.9 in January. On a year-over-year basis, pending sales were 0.4% lower than a year ago, according to the National Association of Realtors’ data. The decline suggests buyers are holding back due to limited inventory choices.


This article was originally published by a eyeonhousing.org . Read the Original article here. .


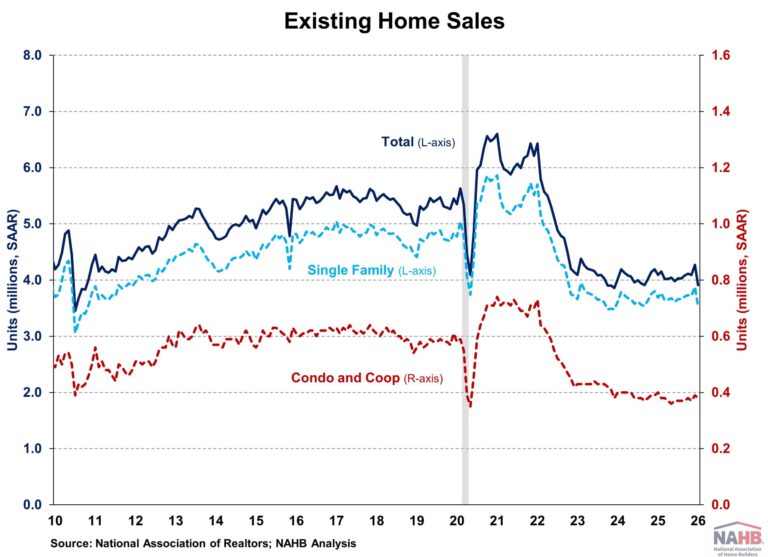
Existing home sales fell in January to a more than two-year low after December’s strong rebound, as tight inventory continued to push home prices higher and winter storms weighed on activity. Despite mortgage rates trending lower and wage growth outpacing price gains, limited resale supply kept many buyers on the sidelines. Resale inventory remained at lowest level since January 2025. Though home price appreciation has slowed in recent months, affordability remains a challenge.

Total existing home sales, including single-family homes, townhomes, condominiums, and co-ops, fell 8.4% to a seasonally adjusted annual rate of 3.91 million in January, according to the National Association of Realtors (NAR). This marks the lowest level since August 2024. On a year-over-year basis, sales were 4.4% lower than a year ago.

The existing home inventory level was 1.2 million units in January, down 0.8% from December but up 3.4% from a year ago. At the current sales rate, January unsold inventory sits at a 3.7-months’ supply, up from 3.5-months in December and January 2024. Inventory between 4.5 to 6 months’ supply is generally considered a balanced market.

Homes stayed on the market for a median of 46 days in January, up from 39 days in the previous month and 41 days in January 2025.

The first-time buyer share was 31% in January, up from 29% in December and 28% from a year ago.

The January all-cash sales share was 27% of transactions, down from 28% in December and 29% a year ago. All-cash buyers are less affected by changes in interest rates.

The January median sales price of all existing homes was $396,800, up 0.9% from last year. This marks the new high for the month of January and the 31st consecutive month of year-over-year increases. The median condominium/co-op price in January was up 3.8% from a year ago at $364,600. Recent gains for home inventory will put downward pressure on resale home prices in most markets in 2026.

Sales declined in all four major regions in January, ranging from 5.9% in the Northeast to 10.3% in the West. On a year-over-year basis, sales also fell across all regions, from 1.6% in the South to 7.9% in the West.

The Pending Home Sales Index (PHSI) is a forward-looking indicator based on signed contracts. The PHSI fell from 79.2 to 71.8 in December after four months of increases. On a year-over-year basis, pending sales were 3.0% lower than a year ago, according to the National Association of Realtors’ data. The decline suggests buyers are holding back due to limited inventory choices.


This article was originally published by a eyeonhousing.org . Read the Original article here. .


Existing home sales rose in December to the fastest pace in nearly three years, but annual sales for 2025 remained at a 30-year low as elevated home prices and mortgage rates kept buyers on the sidelines, according to the National Association of Realtors (NAR). While mortgage rates have eased from 7% seen at the start of 2025 to near 6% by year-end, tight inventory continued to push home prices higher as more homeowners took listings off the market. Resale inventory dropped to its lowest level since January 2025. Though home price appreciation has been slowed in recent months, housing affordability remains a challenge.

Total existing home sales, including single-family homes, townhomes, condominiums, and co-ops, rose 5.1% to a seasonally adjusted annual rate of 4.35 million in December, the highest level for 2025 and highest since February 2023. On a year-over-year basis, sales were 1.4% higher than a year ago. For the year 2025, existing home sales totaled 4.06 million, unchanged from 2024 and matching the lowest level since 1995.

The existing home inventory level was 1.18 million units in December, down 18.1% from November but up 3.5% from a year ago. At the current sales rate, December unsold inventory sits at a 3.3-months’ supply, down from 4.2-months in November but up from 3.2-months in December 2024. Inventory between 4.5 to 6 months’ supply is generally considered a balanced market.

The December median sales price of all existing homes was $405,400, up 0.4% from last year. This marks the 30th consecutive month of year-over-year increases. The median condominium/co-op price in December was up 1.5% from a year ago at $364,400.  Recent gains for home inventory will put downward pressure on resale home prices in most markets in 2026. All four major regions saw an increase in sales in December, with gains ranging from 2.0% in the Northeast and Midwest to 6.9% in the South. However, sales were mixed on a year-over-year basis. Sales remained unchanged in the Midwest and West, rose 3.6% in the South, and fell 1.9% in the Northeast.

The Pending Home Sales Index (PHSI) is a forward-looking indicator based on signed contracts. The PHSI rose from 76.7 to 79.2 in November due to lower mortgage rates. On a year-over-year basis, pending sales were 2.6% higher than a year ago, according to the National Association of Realtors’ data.


This article was originally published by a eyeonhousing.org . Read the Original article here. .


Existing home sales rose for the third consecutive month in November as lower mortgage rates continued to boost home sales, according to the National Association of Realtors (NAR). However, the increase remained modest as mortgage rates still stayed above 6% while down from recent highs. The weakening job market also weighed on buyer activity.

Meanwhile, inventory fell for the fourth consecutive month as homeowners with record-high housing wealth held back from listing properties. Relatively tight supply continued to push home prices higher and challenge housing affordability, even as wage growth outpaced home price gains.

Total existing home sales, including single-family homes, townhomes, condominiums, and co-ops, rose 0.5% to a seasonally adjusted annual rate of 4.13 million in November, the highest level since February. However, on a year-over-year basis, sales were 1.0% lower than a year ago.

The existing home inventory level was 1.43 million units in November, down 5.9% from October but up 7.5% from a year ago. At the current sales rate, November unsold inventory sits at a 4.2-months’ supply, down from 4.4-months in October but up from 3.8-months in November 2024. Inventory between 4.5 to 6 months’ supply is generally considered a balanced market.

Homes stayed on the market for a median of 36 days in November, up from 34 days last month and 32 days in November 2024.

The first-time buyer share was 30% in November, down from 32% in October but unchanged from a year ago.

The November all-cash sales share was 27% of transactions, down from 29% in October but up from 25% a year ago. All-cash buyers are less affected by changes in interest rates.

The November median sales price of all existing homes was $409,200, up 1.2% from last year. This marks the 29th consecutive month of year-over-year increases. The median condominium/co-op price in November was up 0.1% from a year ago at $358,600.  Recent gains for home inventory will put downward pressure on resale home prices in most markets in 2025.

Existing home sales in November were mixed across the four major regions. Sales rose in the Northeast (+4.1%) and South (+1.1%), fell in the Midwest (-2.0%), and remained unchanged in the West. On a year-over-year basis, sales were unchanged in the Northeast and South (2.8%), while down in the Midwest (-3.0%) and West (-1.3%).

The Pending Home Sales Index (PHSI) is a forward-looking indicator based on signed contracts. The PHSI rose from 74.9 to 76.3 in October. On a year-over-year basis, pending sales were 0.4% lower than a year ago, according to the National Association of Realtors’ data.


This article was originally published by a eyeonhousing.org . Read the Original article here. .


Existing home sales rose to an eight-month high in October as buyers took advantage of lower mortgage rates, according to the National Association of Realtors (NAR). Resale inventory improved from a year ago but remained below pre-pandemic levels. Relatively tight supply continued to push home prices higher and challenge housing affordability. These affordability pressures vary by region, with first-time buyers in the Northeast facing limited inventory, while buyers in the West struggle with elevated home prices.

Mortgage rates hovered between 6.5% and 7% earlier this year due to economic and tariff uncertainty. However, with the Fed resuming rate cuts in September, mortgage rates have fallen gradually. As of October 30th, the average mortgage rate decreased to 6.17%, the lowest in over a year. With additional rate cuts expected in coming months, lower mortgage rates and improved inventory should bring more buyers and sellers into the market.

Total existing home sales, including single-family homes, townhomes, condominiums, and co-ops, rose 1.2% to a seasonally adjusted annual rate of 4.10 million in October, the highest level since February. On a year-over-year basis, sales were 1.7% higher than a year ago.

The existing home inventory level was 1.52 million units in October, down 0.7% from September but up 10.9% from a year ago. At the current sales rate, October unsold inventory sits at a 4.4-months’ supply, down from 4.5-months in September but up from 4.1-months in October 2024. Inventory between 4.5 to 6 months’ supply is generally considered a balanced market.

Homes stayed on the market for a median of 34 days in October, up from 33 days last month and 29 days in October 2024.

The first-time buyer share was 32% in October, up from 30% in September and 27% from a year ago.

The October all-cash sales share was 29% of transactions, down from 30% in September but up from 27% a year ago. All-cash buyers are less affected by changes in interest rates.

The October median sales price of all existing homes was $415,200, up 2.1% from last year. This marks the 28th consecutive month of year-over-year increases. The median condominium/co-op price in October was up 0.9% from a year ago at $363,700.  Recent gains for home inventory will put downward pressure on resale home prices in most markets in 2025.

Existing home sales in October were mixed across the four major regions. Sales rose in the Midwest (5.3%) and South (0.5%), fell in the West (-1.3%), and remained unchanged in the Northeast. On a year-over-year basis, sales were up in the Northeast (4.3%), South (2.8%) and Midwest (2.1%), while down in the West (-2.6%).

The Pending Home Sales Index (PHSI) is a forward-looking indicator based on signed contracts. The PHSI remained unchanged at 74.8 in September, suggesting job market concerns kept buyers on the sideline despite mortgage rates near one-year lows. On a year-over-year basis, pending sales were 0.9% lower than a year ago, according to the National Association of Realtors’ data.


This article was originally published by a eyeonhousing.org . Read the Original article here. .

While new homes remain largely unaffordable, builder efforts to improve housing affordability paid dividends in the second quarter of 2025, according to the latest data from the National Association of Home Builders (NAHB)/Wells Fargo Cost of Housing Index (CHI). The CHI results from the second quarter of 2025 show that a family earning the nation’s median income of $104,200 needed 36% of its income to cover the mortgage payment on a median-priced new home. Low-income families, defined as those earning only 50% of median income, would have to spend 71% of their earnings to pay for the same new home.

The figures are somewhat higher for the purchase of existing homes in the U.S., showing that it took more income to buy an existing home. A typical family would have to pay 37% of their income for a median-priced existing home while a low-income family would need to pay 74% of their earnings to make the same mortgage payment.

The second quarter of 2025 marked the largest historical gap where existing home prices exceeded those of new homes. Different dynamics in the two sectors are responsible for the price divergence. On one hand, builders are offering incentives for smaller homes on smaller lots, with streamlined options and features, and thus shifting their production toward less expensive homes.  Many existing homeowners, meanwhile, are locked-in their homes by low mortgage rates, limiting resale inventory, and causing existing home prices to increase.

The percentage of a family’s income needed to purchase a new home was unchanged at 36% from the first to the second quarter, while the low-income CHI fell from 72% to 71% over the same period. Median new home prices edged down 1%, from $416,900 in Q1 2025 to $410,800 in Q2 2025, while the average 30-year mortgage rate slipped from 6.91% to 6.88%.

Affordability of existing homes, on the other hand, edged lower for both median- and low-income families between the first and second quarters. Median existing home prices rose 7% during this period, from $402,300 to $429,400. The share of income needed to pay for an existing home rose from 35% to 37% for a typical family and from 70% to 74% for a low-income family during this period.

CHI is also available for 175 metropolitan areas, calculating the percentage of a family’s income needed to make the mortgage payment on an existing home based on the local median home price and median income in those markets.

In 10 out of 175 markets in the second quarter, the typical family is severely cost-burdened (must pay more than 50% of their income on a median-priced existing home). In 85 other markets, such families are cost-burdened (need to pay between 31% and 50%). There are 80 markets where the CHI is 30% of earnings or lower.

The Top 5 Severely Cost-Burdened Markets

San Jose-Sunnyvale-Santa Clara, Calif., was the most severely cost-burdened market on the CHI, where 93% of a typical family’s income is needed to make a mortgage payment on an existing home. This was followed by:

Urban Honolulu, Hawaii (73%)

San Francisco-Oakland-Fremont, Calif. (72%)

San Diego-Chula Vista-Carlsbad, Calif. (67%)

Naples-Marco Island, Fla. (60%)

Miami-Fort Lauderdale-Palm Springs, Fla. (60%)

Low-income families would have to pay between 119% and 186% of their income in all six of the above markets to cover a mortgage.

The Top 5 Least Cost-Burdened Markets

By contrast, Decatur, Ill., was the least cost-burdened markets on the CHI, where typical families needed to spend just 17% of their income to pay for a mortgage on an existing home. Rounding out the least burdened markets are:

Elmira, N.Y. (18%)

Peoria, Ill. (19%)

Davenport-Moline-Rock Island, Iowa-Ill. (19%)

Binghamton, N.Y. (19%)

Low-income families in these markets would have to pay between 33% and 38% of their income to cover the mortgage payment for a median-priced existing home.

Visit nahb.org/chi for tables and details.

Discover more from Eye On Housing

Subscribe to get the latest posts sent to your email.


This article was originally published by a eyeonhousing.org . Read the Original article here. .
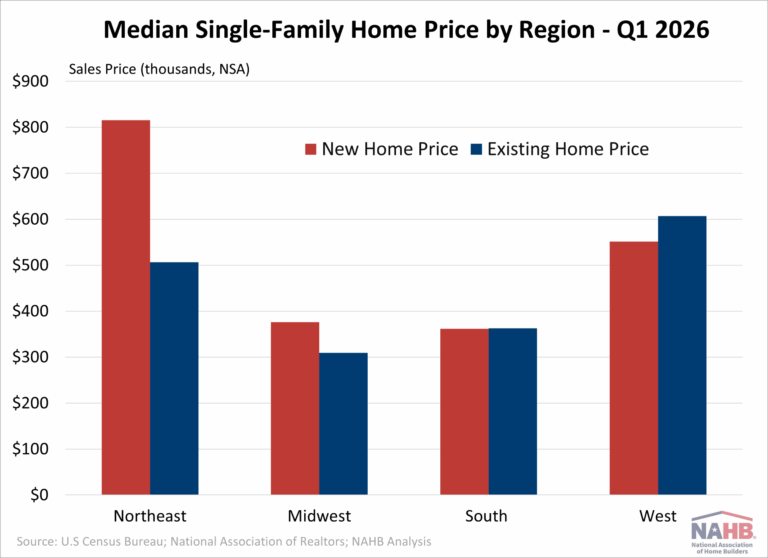

In the second quarter of 2025, the median price for a new single-family home was $410,800, which was $18,600 lower than the median price of existing homes, which stood at $429,400. This marks the largest historical gap where existing home prices exceeded those of new homes, according to U.S. Census Bureau and National Association of Realtors data (not seasonally adjusted – NSA) 

Typically, new homes carry a price premium over existing homes. From 2010 to 2019, this pattern held steady, with an average difference of $66,000. However, over the past five years, the gap has narrowed significantly, averaging just $24,800. Notably, this trend reversed in 2024. In both the second and third quarters, the median price of existing homes surpassed that of new homes. 

Both new and existing homes saw dramatic increases in prices post-pandemic due to higher construction costs and limited supply. While overall home prices remain elevated compared to historical norms, new homes prices have moderated due to tactical builder business decisions, whereas existing homes prices continue to increase because of lean supply and perhaps a lack of price discovery for existing homeowners. 

Indeed, the median price for a new single-family home sold in the second quarter of 2025 decreased 0.9% from the previous year. New home prices have continued to experience year-over-year declines for nine consecutive quarters.  

Meanwhile, the median price for existing single-family homes increased 1.7% from one year ago. Existing home prices have continued to experience year-over-year increases for eight consecutive quarters. 

There are several factors as to why new and existing homes are selling at similar price points. Tight inventory continues to push up prices for existing homes, as many homeowners who secured low mortgage rates during the pandemic are hesitant to sell due to current high interest rates.  

Meanwhile, new home pricing is more volatile – prices change due to the types and locations of homes being built. Despite various challenges facing the industry, home builders are adapting to affordability challenges by building on smaller lots, constructing smaller homes, and offering incentives. Additionally, there has been a shift in home building toward the South, associated with less expensive homes because of policy effects.  

Moreover, the least expensive region for new homes in the first quarter was the South, with a median price of $372,100. The Midwest followed closely behind at $385,300. For existing homes, the Midwest was the most affordably region at $328,800, followed by the South at $376,300. 

New homes were most expensive in the Northeast with a median price of $796,700, while the West sold at $531,100. For existing homes, the West led as the most expensive region at $646,100 homes, followed by Northeast at $646,100.  

The new home price premium was most pronounced in the Northeast, where new homes sold for $269,500 more than existing homes. The West and South followed the national trend, with existing homes priced $4,200 more than new homes in the West and $115,000 more in the South. 

Discover more from Eye On Housing

Subscribe to get the latest posts sent to your email.


This article was originally published by a eyeonhousing.org . Read the Original article here. .


Existing home sales fell to 9-month low in June as home prices hit another monthly record high, according to the National Association of Realtors (NAR). Sluggish pace of sales suggest that higher mortgage rates and elevated home prices are continuing to sideline buyers, despite improved inventory conditions.

Mortgage rates have hovered between 6.5% and 7% due to ongoing economic and tariff uncertainty this year, prompting the Fed to pause interest rate cuts. With mortgage rates expected to stay above 6% for longer due to an anticipated slower easing pace in 2025, these prolonged higher rates and high home prices would continue to weigh on the market. As such, sales are likely to remain limited in the coming months.

Total existing home sales, including single-family homes, townhomes, condominiums, and co-ops, fell 2.7% to a seasonally adjusted annual rate of 3.93 million in June, the lowest level since October 2024. On a year-over-year basis, sales were unchanged from a year ago.

The existing home inventory level was 1.53 million units in June, down 0.6% from May, but up 15.9% from a year ago. At the current sales rate, June unsold inventory sits at a 4.7-months’ supply, up from 4.6-months in May and 4.0-months in June 2024. Inventory between 4.5 to 6 month’s supply is generally considered a balanced market.

Homes stayed on the market for a median of 27 days in June, unchanged from May but up from 22 days in June 2024.

The first-time buyer share was 30% in June, unchanged from May but up 29% from a year ago.

The June all-cash sales share was 29% of transactions, up from 27% in May and 28% a year ago. All-cash buyers are less affected by changes in interest rates.

The June median sales price of all existing homes was $453,300, up 2.0% from last year. This marked an all-time high for the month of June and the 24th consecutive month of year-over-year increases. The median condominium/co-op price in June was up 0.8% from a year ago at $374,500.  Recent gains for home inventory will put downward pressure on resale home prices in most markets in 2025.

Geographically, three of the four regions experienced a decline in existing home sales in June, with a decrease of 2.2% in the South, 4.0% in the Midwest, and 8.0% in the Northeast. Meanwhile, sales in the West rose 1.4%. On a year-over-year basis, sales were up in the Midwest (2.2%) and the South (1.7%) but were down in the West (-4.1%) and the Northeast (-4.2%).

The Pending Home Sales Index (PHSI) is a forward-looking indicator based on signed contracts. The PHSI rose from 71.3 to 72.6 in May, suggesting a solid labor market is supporting the market despite the elevated mortgage rates. On a year-over-year basis, pending sales were 1.1% higher than a year ago, per National Association of Realtors data.

Discover more from Eye On Housing

Subscribe to get the latest posts sent to your email.


This article was originally published by a eyeonhousing.org . Read the Original article here. .
Pin It