Tag

Drop

Browsing


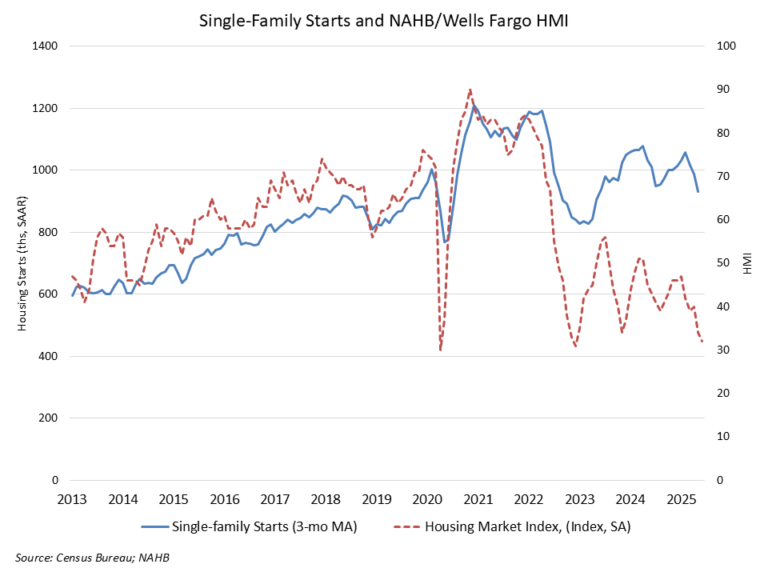
A sharp decline in multifamily production pushed overall housing starts down in May, while single-family output was essentially flat due to economic and tariff uncertainty along with elevated interest rates.

Overall housing starts decreased 9.8% in May to a seasonally adjusted annual rate of 1.26 million units, according to a report from the U.S. Department of Housing and Urban Development and the U.S. Census Bureau.

The May reading of 1.26 million starts is the number of housing units builders would begin if development kept this pace for the next 12 months. Within this overall number, single-family starts increased 0.4% to a 924,000 seasonally adjusted annual rate and are down 7.3% compared to May 2024. The volatile multifamily sector, which includes apartment buildings and condos, decreased 29.7% in May to an annualized 332,000 pace.

On a year-to-date basis, single-family starts are down 7.1%. In contrast, multifamily 5-plus unit starts are up 14.5% as more prospective home buyers remain on the sidelines helping rental demand.

Single-family permits and construction starts are down on a year-to-date basis for 2025 for what has been a disappointing spring housing market, given ongoing elevated mortgage interest rates, challenging housing affordability conditions led by higher construction costs, and macroeconomic uncertainty. NAHB is forecasting that 2025 will end with a decline for single-family housing starts.

The number of single-family homes currently under construction totaled 623,000 homes as of May. This is 1.3% lower than April, 7.6% lower than a year ago and 25% lower than the post-Great Recession peak level in June 2022. There were 752,000 apartments under construction in June, 4.6% lower than May and 18.2% lower than a year ago.

On a regional and year-to-date basis, combined single-family and multifamily starts were 21.1% higher in the Northeast, 10.8% higher in the Midwest, 6.8% lower in the South and 1.6% lower in the West.

Overall permits decreased 2% to a 1.39-million-unit annualized rate in May. Single-family permits decreased 2.7% to an 898,000-unit rate and are down 6.4% compared to May 2024. Multifamily permits decreased 0.8% to a 495,000 pace.

Looking at regional permit data on a year-to-date basis, permits were 17.2% lower in the Northeast, 6% higher in the Midwest, 5.4% lower in the South and 3.7% lower in the West.

Discover more from Eye On Housing

Subscribe to get the latest posts sent to your email.


This article was originally published by a eyeonhousing.org . Read the Original article here. .

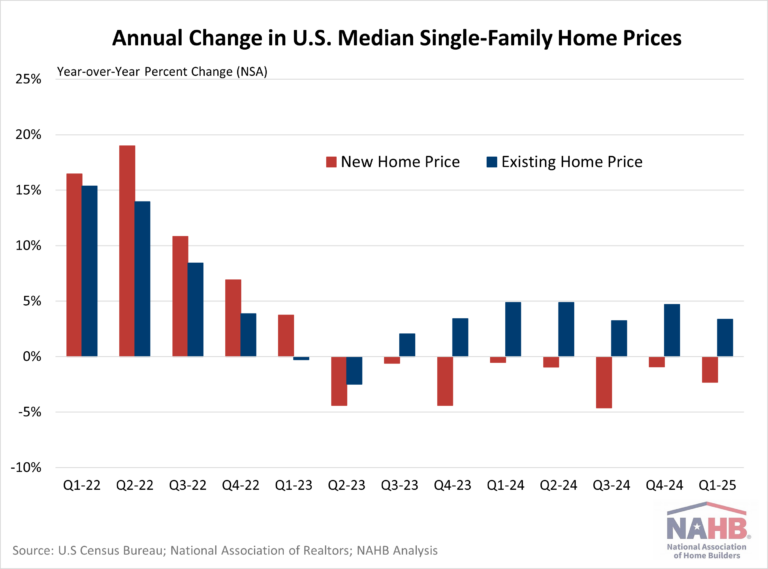
The median price for a new single-family home sold in the first quarter of 2025 was $416,900, a mere $14,600 above the existing home sale price of $402,300, according to U.S. Census Bureau and National Association of Realtors data (not seasonally adjusted – NSA).

Typically, new homes carry a price premium over existing homes. However, the median existing home price exceeded the new home price in the second quarter of 2024 and again in the third quarter of 2024. The first quarter of 2025’s $14,600 price difference is considerably modest by historical standards. Just over two years ago in Q4 2022, the price gap hit a peak with new homes selling for $64,200 more than existing homes. The average difference over the last five years was $26,700, while the decade (2010-2019) prior saw a much wider gap of $66,000.

Both new and existing homes saw dramatic increases in prices post-pandemic due to higher construction costs and limited supply. While overall home prices remain elevated compared to historical norms, new home prices have moderated due to builder business decisions, but existing home prices continue to increase because of lean supply.

The median price for a new single-family home sold in the first quarter of 2025 decreased 2.32% from the previous year. New home prices have continued to experience year-over-year declines for eight consecutive quarters.

Meanwhile, the median price for existing single-family homes increased 3.38% from one year ago. Existing home prices have continued to experience year-over-year increases for seven consecutive quarters.

There are several factors as to why new and existing homes are selling at similar price points. Tight inventory continues to push up prices for existing homes, as many homeowners who secured low mortgage rates during the pandemic are hesitant to sell due to current high interest rates.

Meanwhile, new home pricing is more volatile – prices change due to the types and locations of homes being built. Despite various challenges facing the industry, home builders are adapting to affordability challenges by building on smaller lots, constructing smaller homes, and offering incentives. Additionally, there has been a shift in home building toward the South, associated with less expensive homes because of policy effects.

The least expensive region for homes in the first quarter was the Midwest, with a median price of $367,500 for new homes and $297,800 for existing homes. The South followed closely, with a median new home price of $376,000 and an existing home price of $361,800.

New homes were most expensive in the Northeast with a median price of $784,900, while the West sold at $522,100. However, for existing homes, the West led as the most expensive region at $626,000, followed by the Northeast at $482,700.

The new home price premium was most pronounced in the Northeast, where new homes sold for $302,200 more than existing homes. In contrast, the South saw little difference with a modest $14,200— similar to the national trend. Uniquely, this pattern reversed in the West, where existing homes were $103,900 more than new homes.

Discover more from Eye On Housing

Subscribe to get the latest posts sent to your email.


This article was originally published by a eyeonhousing.org . Read the Original article here. .

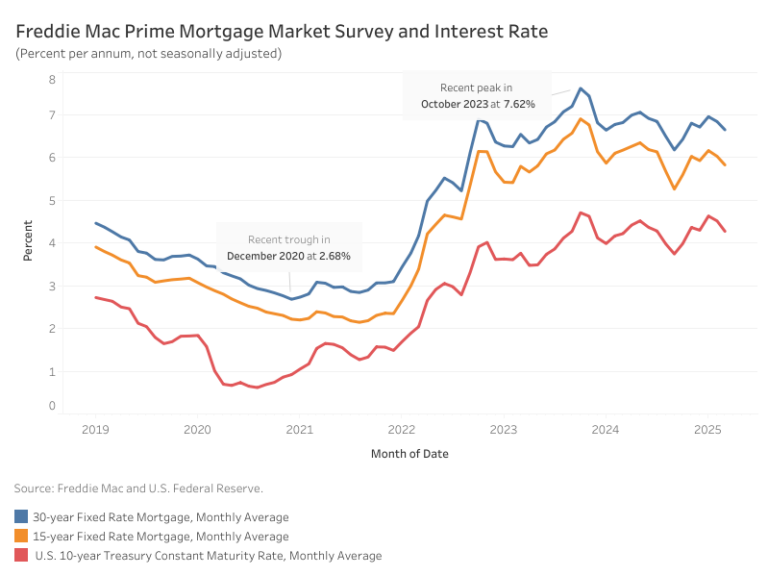
Mortgage rates dropped significantly at the start of March before stabilizing, with the average 30-year fixed-rate mortgage settling at 6.65%, according to Freddie Mac. This marks a 19-basis-point (bps) decline from February. Meanwhile, the 15-year fixed-rate mortgage fell by 20 bps to 5.83%.

The drop in long-term borrowing costs was driven by a 24-bps decline in the 10-year Treasury yield, which averaged 4.28% in March. This decline provided a boost to the housing market—new home sales increased 5.1% year-over-year in February, while the participation of first-time homebuyer of existing homes rose 26% over the same period. However, existing home sales saw a slight dip from last February.

The decrease in Treasury yields reflects growing concerns about an economic slowdown, particularly as shifts in tariff policy weaken consumer confidence. Despite this, the labor market remained resilient in February, posting steady job gains even as the unemployment rate ticked up slightly. The strength of upcoming jobs reports will be critical in assessing whether recession risks are intensifying.

At the latest FOMC meeting, the Federal Reserve held interest rates steady but revised its 2025 economic projections: expected GDP growth was lowered to 1.7% (down from 2.1% in December 2024) and the projected unemployment rate was raised to 4.4%, up 0.1 percentage point from previous estimates.

Discover more from Eye On Housing

Subscribe to get the latest posts sent to your email.


This article was originally published by a eyeonhousing.org . Read the Original article here. .

Total outstanding US consumer debt stood at $5.08 trillion for the first quarter of 2024, increasing at an annualized rate of 2.46% (seasonally adjusted), according to the Federal Reserve’s G.19 Consumer Credit Report. From the second quarter of 2023 to the second quarter of 2024, the total increased by 1.84%. This year-over-year (YoY) growth rate is the lowest observed since the first quarter of 2021.

Nonrevolving and Revolving Debt

Of the total outstanding US debt in the first quarter of 2024, the nonrevolving share is 74%, with revolving at 26%. Nonrevolving debt (primarily student and auto loans) stands at $3.73 trillion (SA) for the second quarter of 2024. Revolving debt (mainly credit card debt) stands at $1.34 trillion.

The pace of growth has slowed for both nonrevolving and revolving debt as households’ pandemic-era savings have dwindled. In terms of YoY growth, both nonrevolving and revolving debt peaked in the fourth quarter of 2022 at 15.10% and 5.34% respectively. In the second quarter of 2024, the YoY growth rate for nonrevolving debt decreased to 6.12%, from 7.99% in the first quarter, while the growth rate for revolving debt increased from 0.14% to 0.39%. This was the sixth consecutive quarterly decline in YoY growth for nonrevolving debt while revolving debt saw its first uptick in the YoY rate in five quarters.

Student and Auto Loans

Breaking down the components of nonrevolving debt, student loans account for 47%, and auto loans make up 42% (the G.19 report excludes real estate loans). Collectively, the other loans make up the remaining 11% of nonrevolving debt.

Student loans in the second quarter of 2024 totaled $1.74 trillion (non-seasonally adjusted), marking the fourth consecutive decrease in the YoY rate at -0.96%, following an annual decrease of -1.22% in the previous quarter. The third quarter of 2023 marked the first YoY decrease for student loan debt since the data was first reported.

Auto loan debt for the second quarter of 2024 was $1.57 trillion (NSA). Auto loan YoY growth has steadily decelerated over the past six quarters. The fourth quarter of 2021 saw a high of 13.74% YoY growth compared to the second quarter of 2024 YoY growth rate of 1.95%. This slowdown partially reflects the relatively high interest rate on auto loans, which have increased from 4.52% in Q1 2022 to 8.20% in Q2 2024 (60-month new car loans). However, this car loan rate experienced its first (albeit slight) decline in over two years, falling from 8.22% in the previous quarter.

Credit Cards

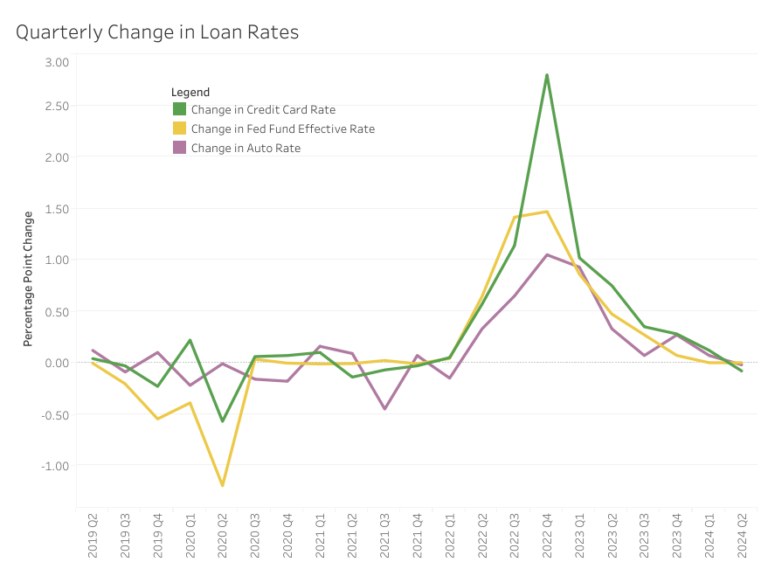
The interest rate on credit cards saw its first decrease since the fourth quarter of 2021.  The interest rate for the second quarter of 2024 was 21.51%, falling from 21.59% in the previous quarter. Before this quarter, the rate experienced nine consecutive quarterly increases, with a dramatic increase of 2.8 percentage points from Q3 2022 to Q4 2022. This aligns closely with the Federal Funds Effective Rate increasing 1.47 percentage points during the same period, the highest increase since the 1980s.

Discover more from Eye On Housing

Subscribe to get the latest posts sent to your email.


This article was originally published by a eyeonhousing.org . Read the Original article here. .

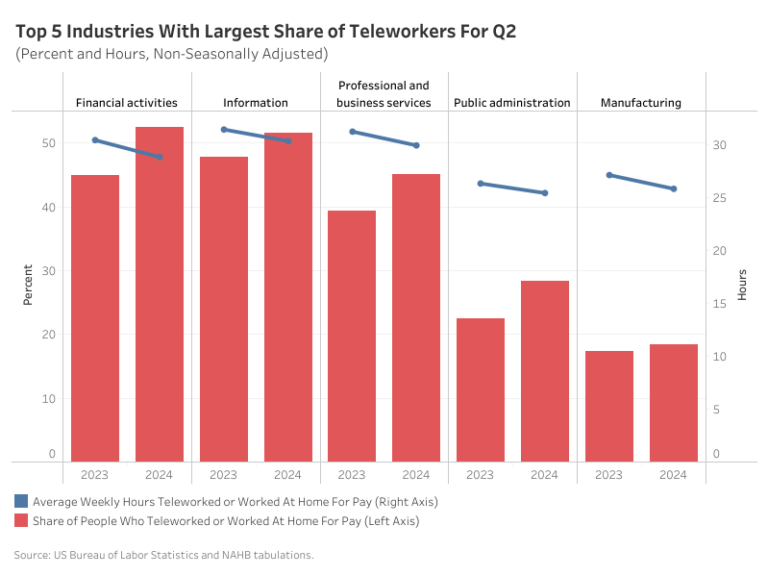
The total share of workers teleworking or working from home for pay has increased from 2023, according to the latest Telework or Work at Home for Pay Survey from the Bureau of Labor Statistics. In June 2023, 19% of the labor force teleworked on a non-seasonally adjusted basis. This share rose to 22.3% in June 2024, even though the total number of workers remained stable. However, the average weekly hours of remote work among teleworkers decreased slightly by 1.7 hours, from 28.7 to 27 hours a week. This decline is due to a shift toward hybrid work, with the proportion of people working all their hours remotely dropping from 53.2% to 48.4%.

Across all occupations, the share of teleworkers has increased, while the average weekly telework hours have declined. Management, professional, and related occupations had the highest share of teleworkers, with 37.8% working remotely in June, averaging 27.1 hours per week. In contrast, natural resources, construction, and maintenance occupations had the lowest share, with only 3.0% teleworking for an average of 21.4 hours a week.

By industry, financial activities saw the largest increase in teleworkers, rising by 7.5 percentage points from 44.9% in June 2023 to 52.4% in June 2024. Meanwhile, the average weekly telework hours for this industry decreased modestly from 30.4 hours to 28.8 hours. The information industry, previously the leader in telework, increased by 3.8 percentage points, from 47.8% to 51.6%. Its average weekly telework hours declined by 1.1 hours, from 31.4 to 30.3 hours.

The increase in teleworking has significant implications for the housing and real estate market. With more people working from home, there may be a growing demand to remodel their current homes to have dedicated office spaces. Additionally, commercial real estate could face challenges as businesses reconsider their office space needs, potentially leading to an increase in flexible workspaces or a reevaluation of leasing strategies.

There are also policy proposals that NAHB supports which aim to repurpose underused commercial spaces into residential real estate, such as the “Revitalizing Downtowns and Main Streets Act” that proposes a 20% tax credit to encourage converting vacant commercial properties into affordable housing, thereby addressing the nationwide housing shortage.

Discover more from Eye On Housing

Subscribe to get the latest posts sent to your email.


This article was originally published by a eyeonhousing.org . Read the Original article here. .
Pin It